Monitoring user sessions with MC
The User Sessions charts provide information about Vertica user activities for all user connections open to MC.
Choose User Sessions from the menu at the top of your database's Activity page to view these charts.
View open sessions
The Open Sessions tab displays a table of currently open sessions for each user. You can close a session or cancel a query on this tab by selecting that option from the Actions column.
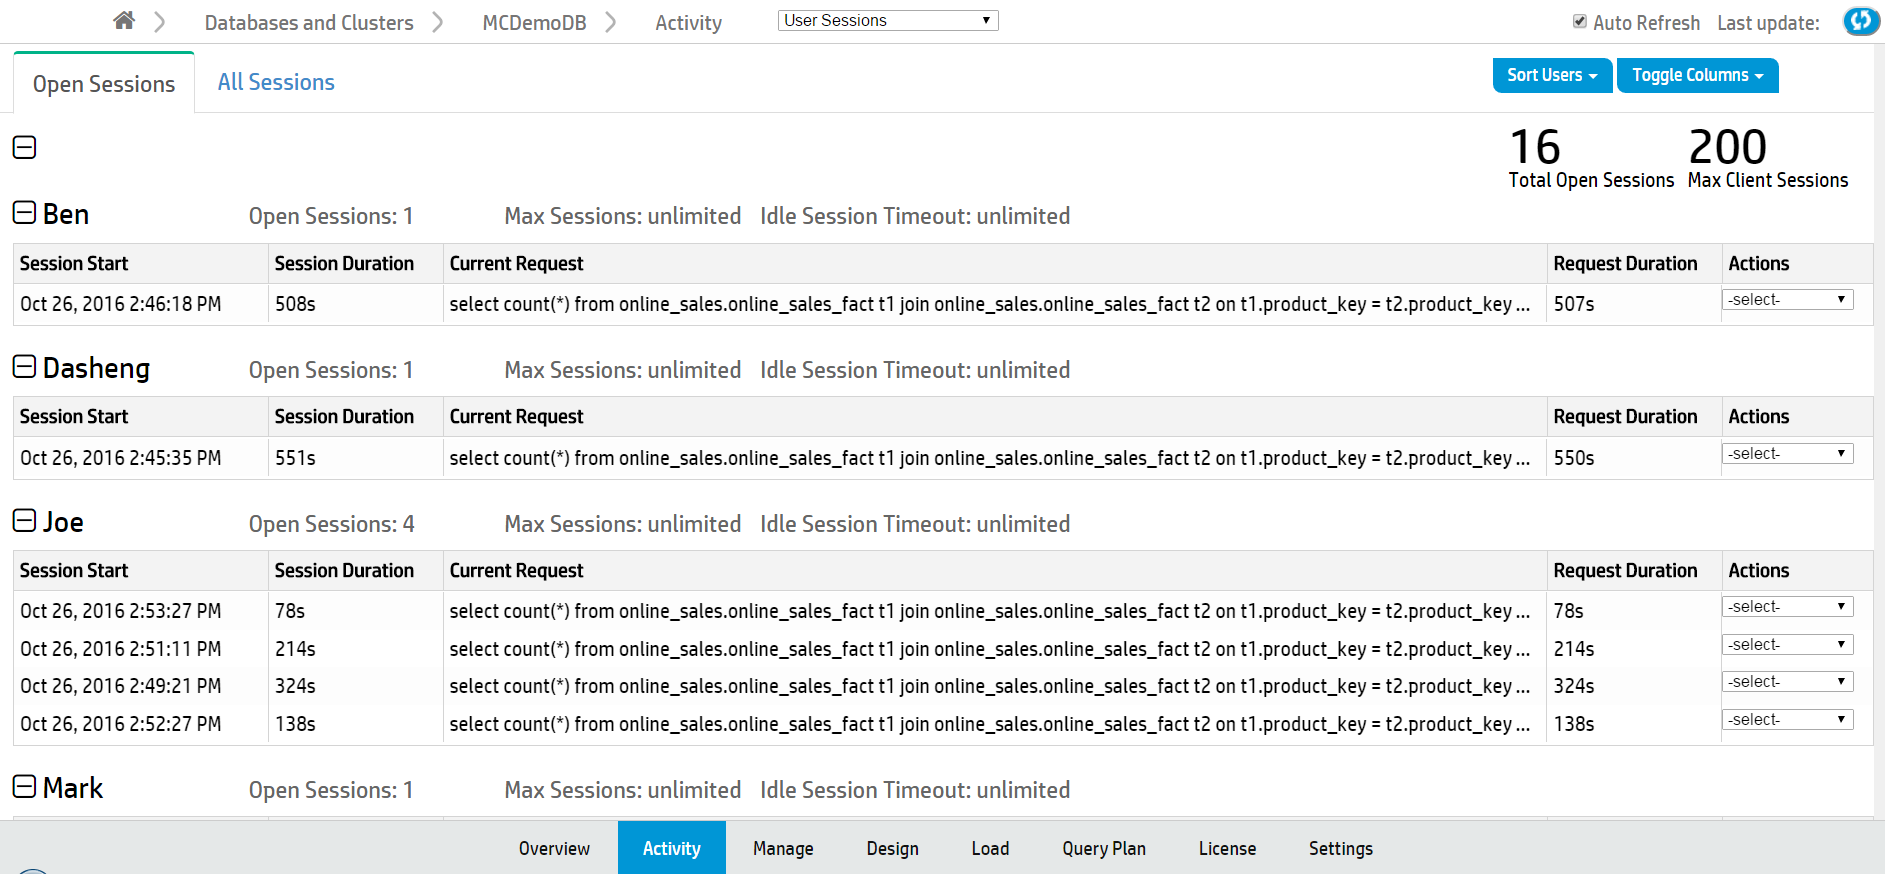
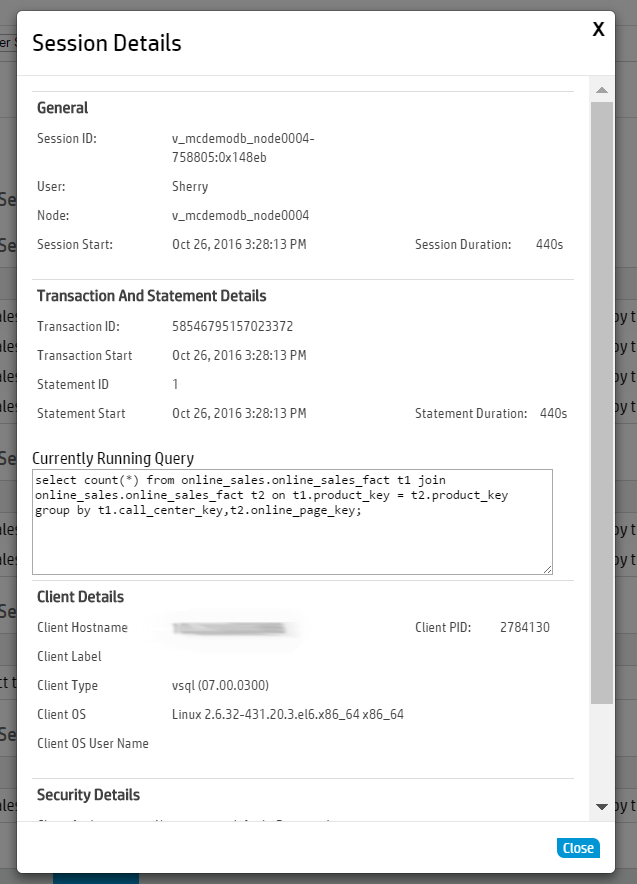
Click any row to open a Session Details dialog that shows more extensive information about that session.
To configure the Open Sessions page display:
-
Use the Sort Users button at the top right of the page to sort by user name or number of open sessions.
-
Use the Toggle Columns button at the top right of the page to select which columns to display. Each table displays session information by column, such as the session start time or the
View all user sessions
The All Sessions tab displays a history of all user sessions in a swim lane chart.
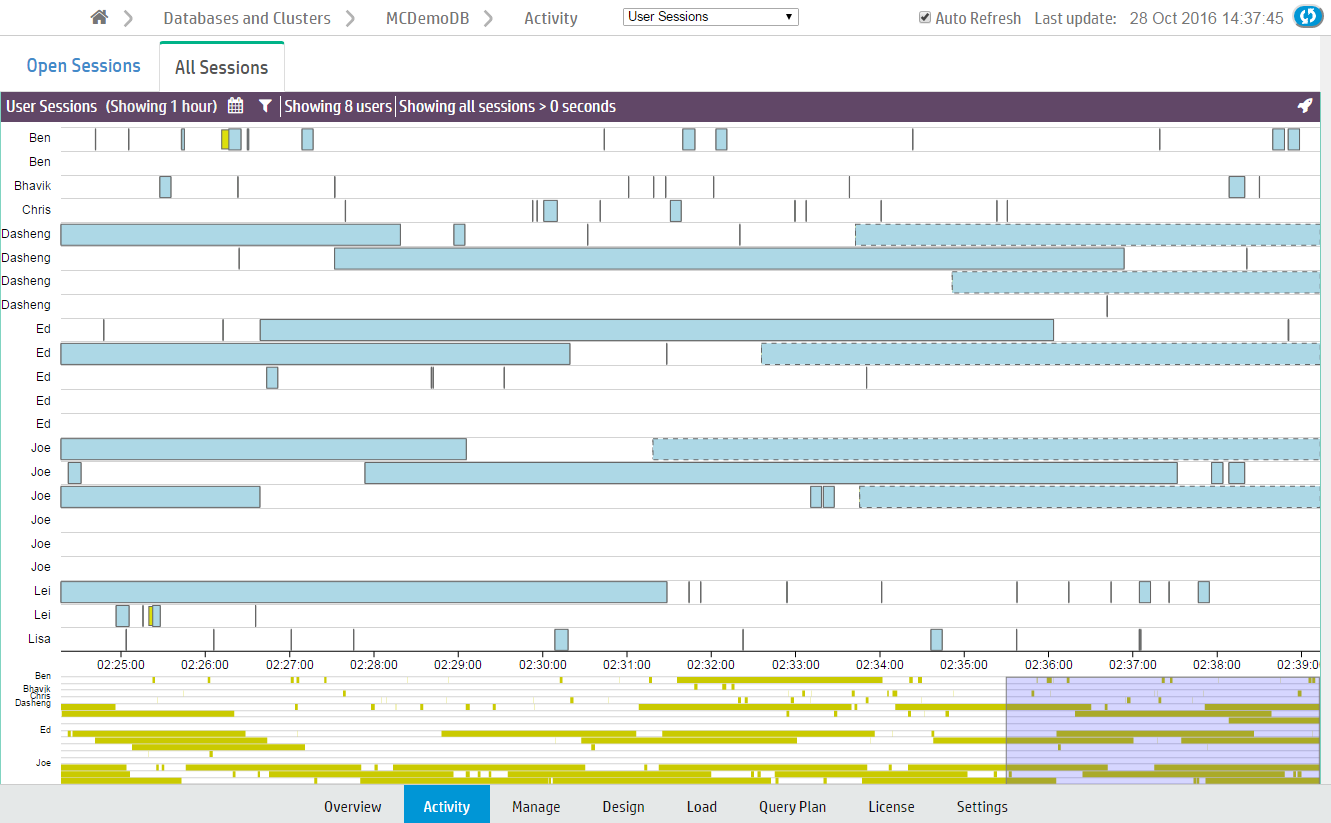
What chart colors mean
Bars outlined with a dotted line are currently running sessions.
Sessions are divided into two colors, yellow and blue.
-
Yellow bars represent user (system) sessions. If you click a yellow bar, MC opens a Detail page that shows all queries that ran or are still running within that session.
-
Blue bars represent user requests (transactions within the session). If you click a blue bar in the graph, MC opens a Detail page that includes information for that query request only.
When you hover your mouse over a transaction bar, a dialog box provides summary information about that request, such as which user ran the query, how long the transaction took to complete, or whether the transaction is still running.
Filter chart results
Extremely busy systems will show a lot of activity on the interface, perhaps more than you can interpret at a glance. You can filter chart results in several ways:
-
Zoom. The context chart at the bottom of the page highlights in blue which section of the All Sessions chart you are viewing. Click and drag the blue box left or right to view earlier or later user sessions. Click and drag the edges of the blue box to zoom in or out.
-
Select fewer users. Click the filter icon (
 ) at the top of the page. A menu of a menu of all available users appears below. Deselect users to exclude from the chart.
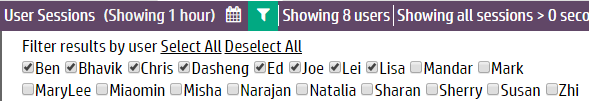
-
Change the session duration (how long a session took to run). Click the Filter icon (
) at the top of the page. The Filter sessions and queries by duration field appears below. Enter the minimum session length (in seconds) to display on the chart and click Update. 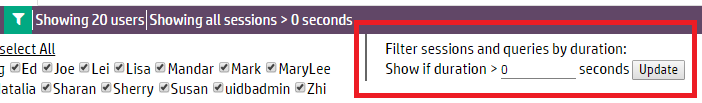
-
Specify a time frame. Click the Calendar icon (
 ) at the top of the page to display the From and To fields. Using the fields, select the time frame to display in the chart and click Update.