Monitoring user query phases with MC
The User Query Phases chart provides information about the query execution phases that a query goes through before completion. Viewing this chart helps you identify at a glance queries possibly delayed because of resource contention.
Note
For a list of query phases, see Query phase duration.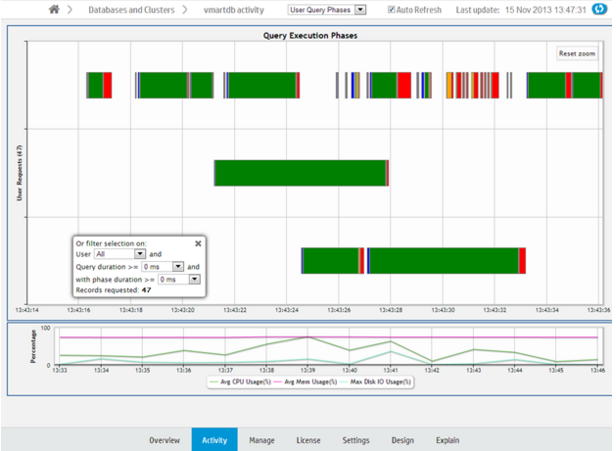
Each bar, bound by a gray box, represents an individual query. Within a query, a different color represents each query phase. The chart does not show phases for queries with durations of less than 4 seconds. Blank spaces within a query represent waiting times, as in the image below.
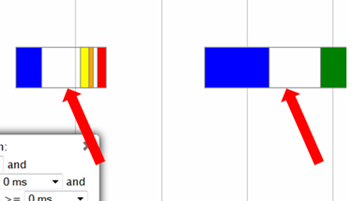
Hover over a phase in the query for information on the phase type and duration.
The chart shows queries run over the last 15 minutes. The chart automatically refreshes every five minutes, unless you clear the Auto Refresh option in the toolbar.
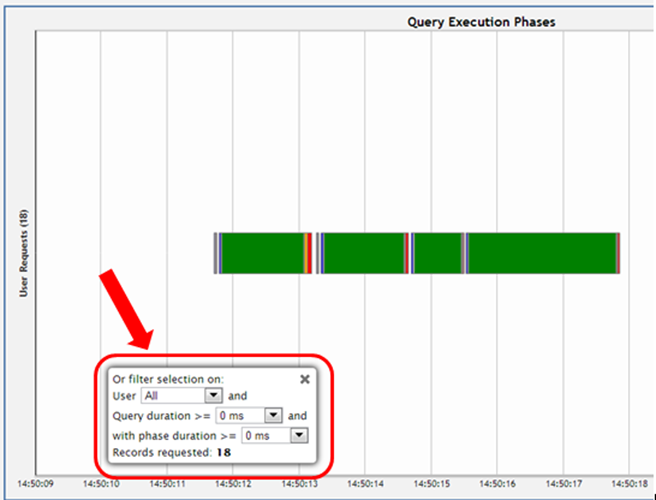
Filtering chart results
You can filter what the chart displays by selecting options for the user running the query, minimum query duration, and minimum phase duration.
Viewing more detail
To zoom in for detail, click-drag the mouse around a section of the chart. Click Reset Zoom, located at the top right corner of the chart, to restore the chart to its original view.
For more detail, click a query bar. The Detail page opens to provide information about the queries in tabular format, including the query type, session ID, node name, query type, date, time, the actual query that ran, and an option to run Explain Plan or profile the query. Click a table column header to sort the queries by that category.
To export the contents of the table to a file, click Export, located at the upper right of the page.
To return to the main Queries page, click Activity in the navigation bar.