Monitoring database storage with MC
The Infrastructure page's Storage View provides a summary of the amount of data stored in your database, and the persistent location of that data. Use this view to monitor how much of your storage capacity your databases are using.
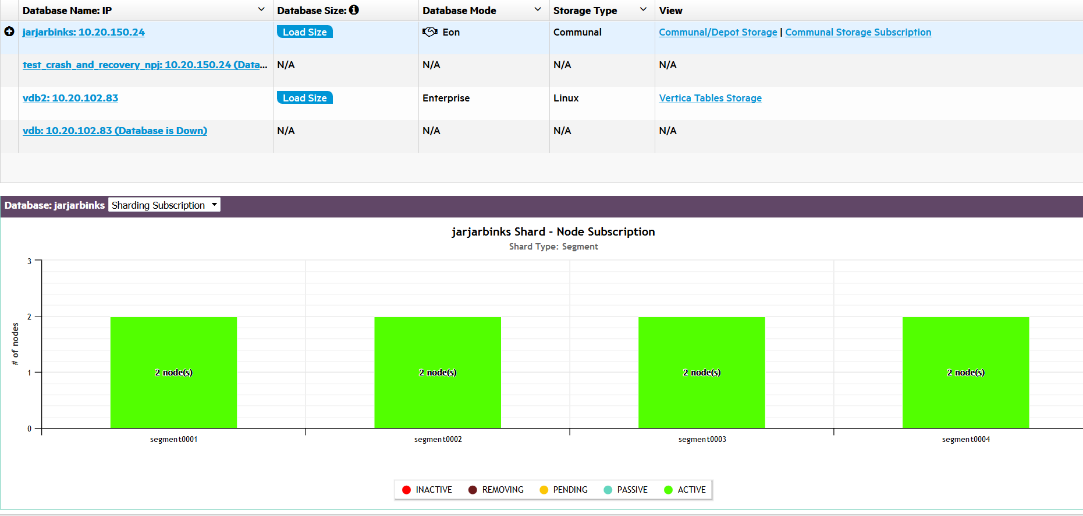
For a database running in Eon Mode, MC also displays bar charts in the Storage View that illustrate shard subscription status. Use these charts to determine if your current subscription layout is optimal for querying your Eon Mode database. For information about using subscription status charts, see Monitoring subscription status in Eon Mode.
Monitor storage usage
The storage summary table lists all databases currently monitored by MC and information about their storage:
-
Database Size. Click Load Size to calculate the total size of the database.
-
Database Mode. Vertica databases run in Enterprise Mode, or Eon Mode.
-
Storage Type. Enterprise Mode databases list the OS of the local nodes where data is stored. Eon Mode databases list the type of communal storage location where it stores its data. Eon Mode currently supports only S3-compatible storage locations.
-
View. The options displayed in this column depend on the database mode and type of data on the database.
-
Vertica Tables Storage: For Enterprise Mode databases only. Click for a dialog listing the node and local directories where Vertica table data is stored.
-
Communal/Depot Storage: For Eon Mode databases only. Click for a dialog displaying location paths for your depot and communal storage.
-
Communal Storage Subscription: For Eon Mode databases only. Click to view bar charts at the bottom of the Storage View page, illustrating shard subscription status. For more about these charts, Monitoring subscription status in Eon Mode.
-
External Tables: Available when there are external tables in your database. Click for a dialog displaying details about all external tables. (Also see Monitoring table utilization and projections with MC.)
-
HCatalog Details: Available when your Vertica database has access to Hive tables. (See Using the HCatalog Connector.) Click for a dialog displaying details about HCatalog schemas. For any HCatalog schema, click View Tables for details about all tables accessible through that schema. (Also see Monitoring table utilization and projections with MC.)
-
In front of Eon Mode database names in the list, a plus icon displays. Click the icon to expand more details about the database's depot capacity and usage. The depot is cache-like storage where Eon Mode databases keep local copies of communal storage data for faster query access.
-
Click Percentage Used to view the Depot Activity chart for that database.
-
Click View Depot Details by Nodes to see a dialog displaying location paths and depot usage information.