Monitoring system resources with MC
MC's Activity page provides immediate visual insight into potential problem areas in your database's health by giving you graph-based views of query and user activity, hardware and memory impact, table and projection usage, system bottlenecks, and resource pool usage.
Select one of the following charts in the toolbar menu:
How up to date is the information?
System-level activity charts automatically update every five minutes, unless you clear Auto Refresh in the toolbar. Depending on your system, it could take several moments for the charts to display when you first access the page or change the kind of resource you want to view.
Chart viewing options
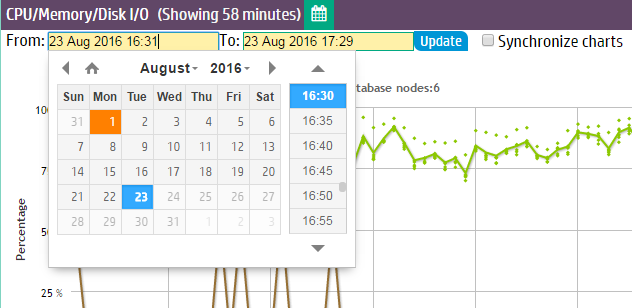
You can specify time frames for some charts, which display a calendar icon in their title bars. Click the calendar icon to specify the time frame for that module.
If you have enabled extended monitoring on your database, MC can display longer ranges of data in certain charts. See Extended monitoring. If a chart is using extended monitoring data, the rocket ship icon appears in the title bar:

You can expand some charts to view them in larger windows. Click the expand icon in the title bar to do so:
![]()
In this section
- Monitoring query activity with MC
- Monitoring internal sessions with MC
- Monitoring user sessions with MC
- Monitoring system memory usage with MC
- Monitoring system bottlenecks with MC
- Monitoring user query phases with MC
- Monitoring table utilization and projections with MC
- Monitoring running queries with MC
- Monitoring catalog memory with MC