Monitoring running queries with MC
The Query Monitoring activity page displays the status of recent and currently running queries, and resource information by user and node. For Eon Mode databases, you can also display the status of queries by subcluster. From this page, you can profile a query or cancel a running query.
Use this page to check the status of your queries, and to quickly cancel running or queued queries to free up system resources. This page can help you identify where resources are being used, and which queries, users, nodes, or subclusters are using the most resources.
The Query Monitoring page includes four tables, displayed as tabs:
-
Running queries
-
Queued queries
-
Completed queries
-
Failed queries
From the Actions column you can:
-
Cancel. Cancel a running or queued query.
-
Close session. Close a session for a running or queued query.
-
Explain. Open the Query Plan page for any query.
-
Profile. Profile any query on the Query Plan page.
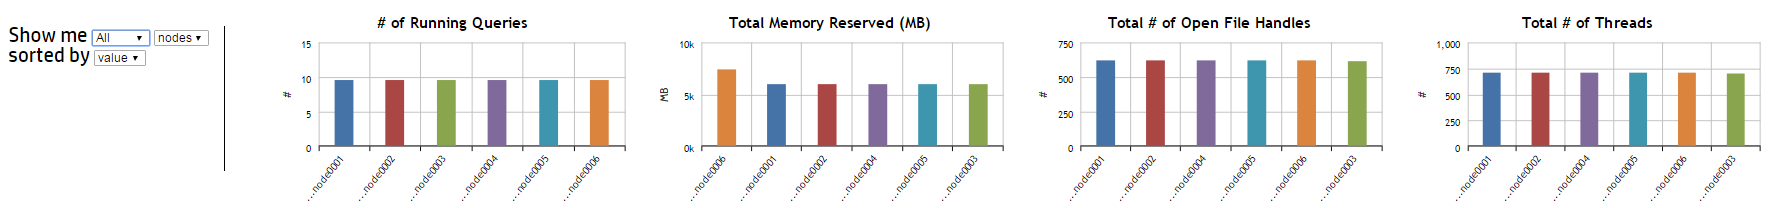
The four bar charts at the bottom of the page display aggregate query usage by node or user. Hover over a bar with your cursor to see its value. When sorted by value, the left-most bar in each chart represents the node or user with the highest value.
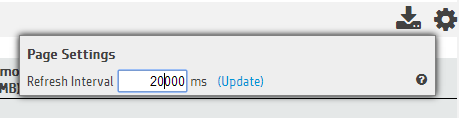
The Query Monitoring page refreshes every 20 seconds by default. To change the refresh interval, click the Page Settings button in the upper-right corner of the page. A dialog appears. Type the new refresh interval, in milliseconds, in the text box.
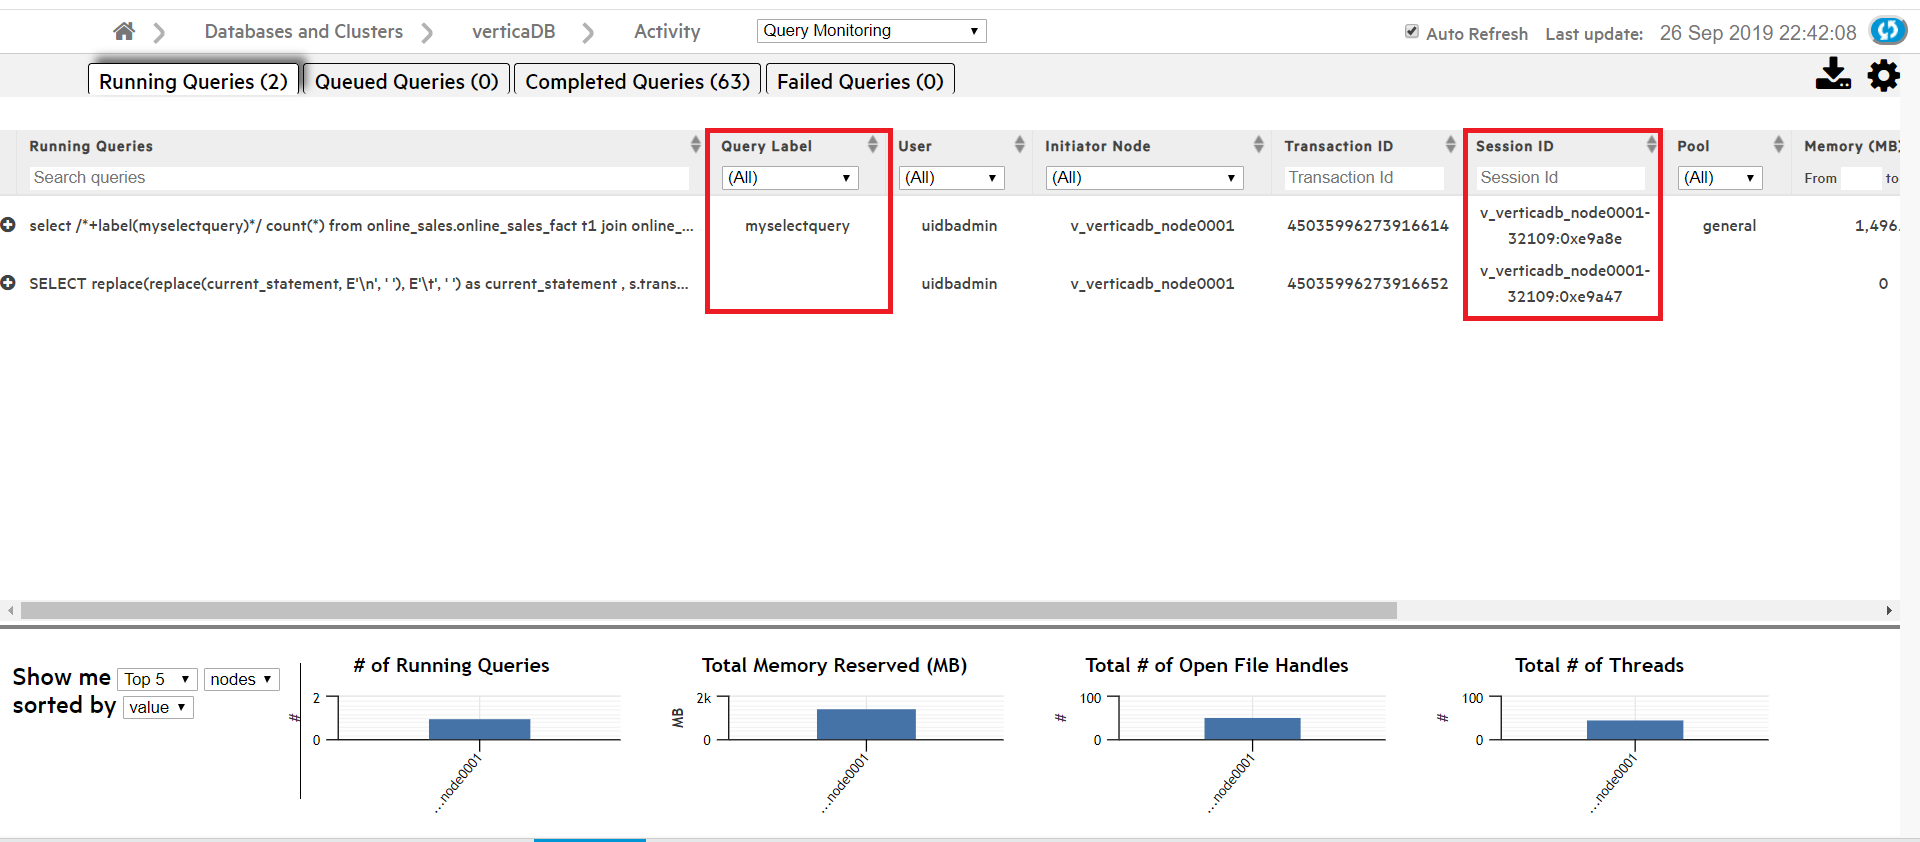
Sorting or searching queries by session ID or client label
The Query Monitoring Activity > Running Queries page includes columns that display the Session ID and Client Label for each query. You can sort the queries by Session ID or Client Label, or use the search field below either column to search for queries with a specific Session ID or Client Label.
Filtering chart results
Use the search field below each column title to narrow down your chart results. (For example, if you enter the text SELECT product_description in the Search Queries field and select a specific node in the Initiator Node column, the chart returns only queries which both contain that text and were initiated on the node you specified.)
Click a column title to sort the order of the queries by that category.
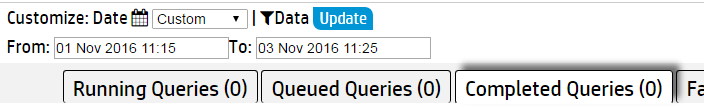
There may be a large number of results for Completed and Failed Queries. Use the Customize section at the top of these two tabs to further filter your chart results. For either tab, you can select a custom date and time range for your results.
In the Completed Queries tab, click Data to enter additional query information to filter based on any of the following fields:
-
User
-
Request
-
Request Duration
-
Node
-
Request label
Viewing more details
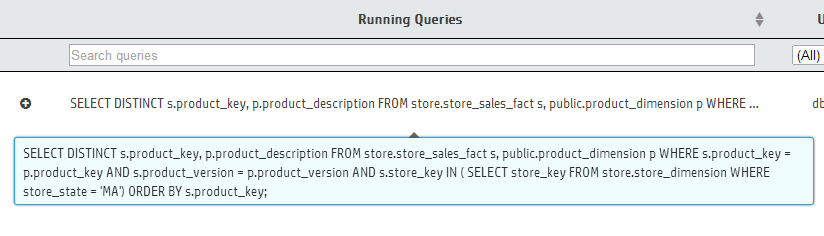
Click a query to view the entire query.
In the Failed Queries chart, click the plus (+) icon next to a failed query to see the failure details for each node involved in the query's execution.
To export the data in one of the Query Monitoring tables, click the table's tab, then click the Export (![]() ) button in the upper-right corner of the page. The browser downloads the data for that chart in a .dat file. The data exported includes columns that may not be visible in the MC, including the minimum and maximum values for Memory, Thread Count, and Open File Handles.
) button in the upper-right corner of the page. The browser downloads the data for that chart in a .dat file. The data exported includes columns that may not be visible in the MC, including the minimum and maximum values for Memory, Thread Count, and Open File Handles.