Monitoring catalog memory with MC
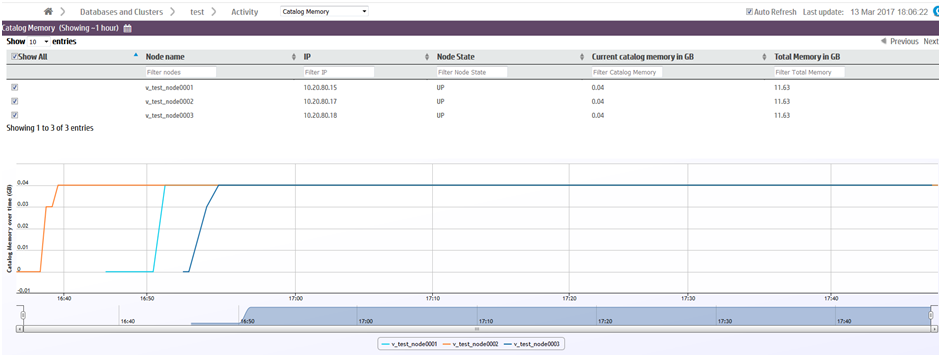
The Catalog Memory activity page displays the catalog memory for each node. Use this page to check for sudden changes in catalog memory, or discrepancies in memory distribution across your nodes.
The Catalog Memory page displays:
-
A node details table. The table lists the details of each node in the database, including their current catalog memory and total memory usage.
-
A catalog memory chart. A line graph visualization of each node's catalog memory usage over time. Each line represents a node. The color legend at the bottom of the chart indicates the color of each node's line.
In the image below, catalog memory begins at 0GB for all three nodes. Over the next twenty minutes, catalog memory increases to 0.04GB in the second node (orange), then the first node (cyan), and finally in the third node (dark blue). Starting at 16:55, note that the three overlapping node lines appear as one line when all three nodes have the same catalog memory.
Filtering chart results
If you have many nodes in your database, you may want to display only certain nodes in the catalog memory chart. You can remove nodes from the chart in two ways:
-
Deselect the node's check box in the node details table.
-
Deselect the node in the color legend below the chart.
Viewing more details
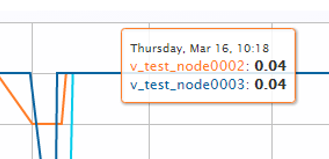
Hover over any line in the chart to view the time, node name, and catalog size.
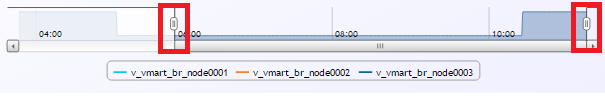
At the bottom of the chart is a summary bar that shows a quick overview of the catalog memory over time. Move the sliders on either side of the chart to zoom in on a specific time frame in the chart. When zoomed in, you can use the scrollbar to move forward or backward in time.