This is the multi-page printable view of this section.
Click here to print.
Return to the regular view of this page.
Monitoring with MC
Double check all topics and their variants and fix link names.
Management Console gathers and retains history of important system activities about your MC-managed database cluster, such as performance and resource utilization. You can use MC charts to locate performance bottlenecks on a particular node, to identify potential improvements to Vertica configuration, and as a reference for what actions users have taken on the MC interface.
The following list describes some of the areas you can monitor and troubleshoot through the MC interface:
-
Multiple database cluster states and key performance indicators that report on the cluster's overall health
-
Information on individual cluster nodes specific to resources
-
Database activity in relation to CPU/memory, networking, and disk I/O usage
-
Layout of subclusters, and resource utilization and query workload on subclusters. (Available in Eon mode databases only, where the database includes one default subcluster, and may include additional user-defined subclusters.)
-
Query concurrency and internal/user sessions that report on important events in time
-
Cluster-wide messages
-
Database and agent log entries
-
MC user activity (what users are doing while logged in to MC)
-
Issues related to the MC process
-
Error handling and feedback
About chart updates
MC retrieves statistical data from the production database to keep the charts updated. The charts also update dynamically with text, color, and messages that Management Console receives from the agents on the database cluster. This information can help you quickly resolve problems.
Each client session to MC uses a connection from MaxClientSessions, a database configuration parameter. This parameter determines the maximum number of sessions that can run on a single database cluster node. Sometimes multiple MC users, mapped to the same database account, are concurrently monitoring the Overview and Activity pages.
Tip
You can increase the value for
MaxClientSessions on an MC-monitored database to account for extra sessions. See
Managing sessions for details.
1 - Viewing the overview page
The Overview page displays a dynamic dashboard view of your database.
The Overview page displays a dynamic dashboard view of your database.
The page provides three tabs: Status Summary, System Health, and Query Synopsis. Access these tabs by clicking one of the three icons at the top left of the Overview page. Each tab contains charts and filters displaying information about your cluster. The QuickStats widgets on the right of the page display alerts and statistics about the state of your cluster.
Information on this page updates every two minutes, however you can adjust that value in the MC Settings page on the Monitoring tab. You can postpone updates by deselecting Auto Refresh in the toolbar.
Chart viewing options
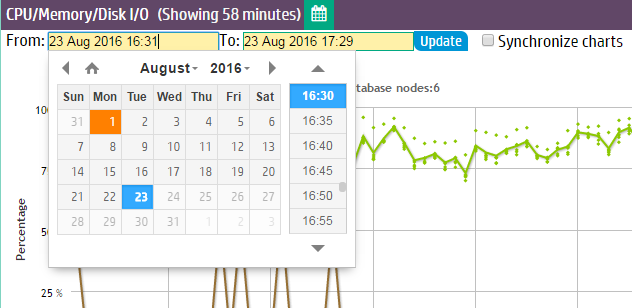
You can specify time frames for some charts, which display a calendar icon in their title bars. Click the calendar icon to specify the time frame for that module.
On the Status Summary tab, you can select Synchronize charts to simultaneously apply the specified time frame to all charts on that tab.
If you have enabled extended monitoring on your database, MC can display longer ranges of data in certain charts. See Extended monitoring. If a chart is using extended monitoring data, the rocket ship icon appears in the title bar:

You can expand some charts to view them in larger windows. Click the expand icon in the title bar to do so:

Changing what the chart displays
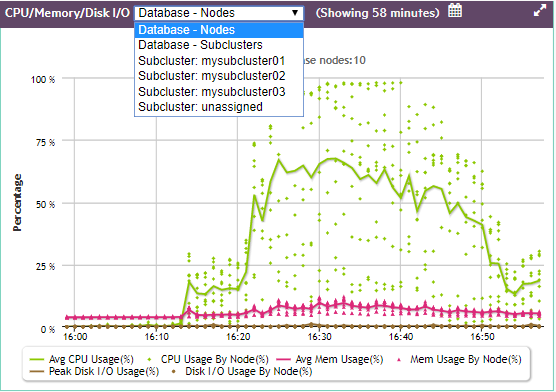
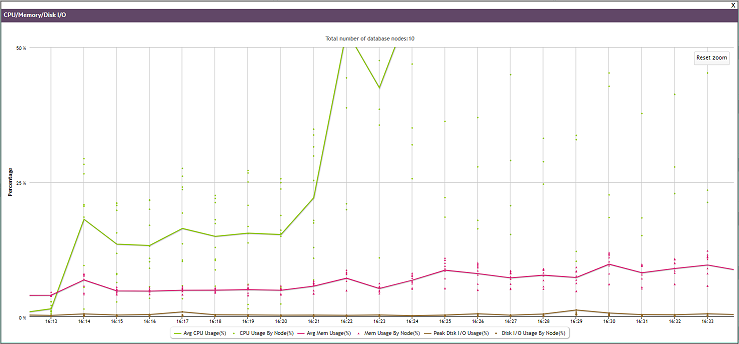
The charts on the Overview page can display information about the nodes in your database, or the activity in all your database subclusters, in a single subcluster, or on the nodes that are not assigned to a subcluster. Use the dropdown in the title bar to select the type of information you want to display in the chart.
Note
The dropdown list in the CPU/Memory/Disk I/O chart below, and all other MC charts, appears only for Eon Mode databases, and only if subclusters are defined.
Zooming to show chart details
There are several steps you can take to show increasing levels of detail in a chart.
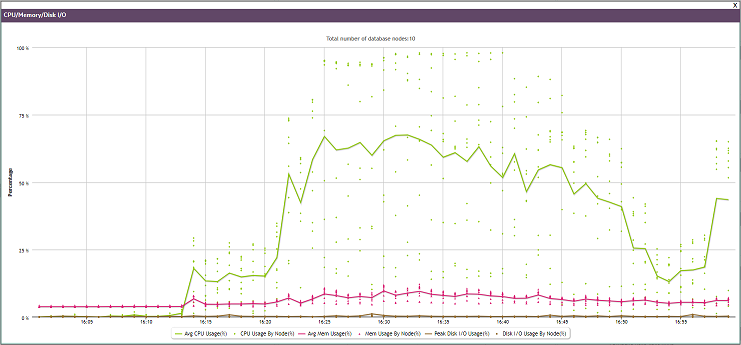
You can click the expand icon in the title bar to view the chart in a larger window:
You can use the cursor to outline a small area you want to expand, shown as a gray rectangle below:
When you release the cursor, the detail area expands to full size:
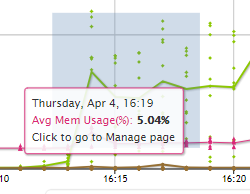
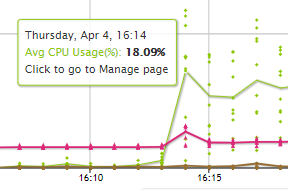
Hover over any line or point on the chart to see details about those specific data points. This works before or after you expand the chart:
What the lines and dots on the chart represent
The legend below the CPU/Memory/Disk I/O chart explains what the lines and dots on the chart represent.
Each line represents the average of the nodes you selected in the dropdown. If you selected Database - Nodes, the line represents the average for all the nodes in the database. If you selected one subcluster, the line represents the average for the nodes in that subcluster.
Each dot represents an individual entity within your dropdown choice. If you chose Database - Nodes, each dot represents one node in the database. If you chose Database - Subclusters, each dot represents one subcluster in the database. If you chose a single subcluster or the unassigned subclusters, each dot represents an individual node within that set.
You can hover over any line or dot to see a summary about it. You can click on a dot to display the Node Details page for that dot.
Quick stats
The Quick Stats sidebar on the right of the page provides instant alerts and information about your cluster's status.
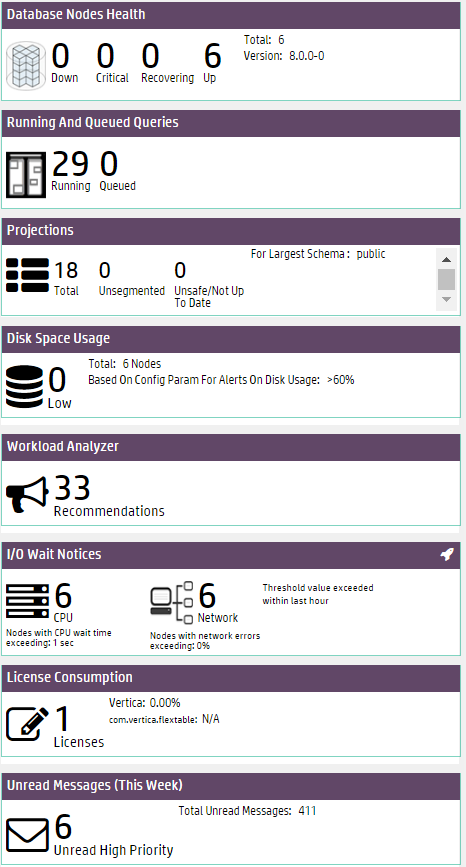
-
Database Nodes Health displays which nodes are down, critical, recovering, or up. Critical and recovering nodes are included in the total nodes considered "up" by the database. Click a node value to open the Manage page.
-
Running and Queued Queries displays current queries in the database. Click the query values to open the Query Monitoring charts.
-
Projections displays the number of total projections, unsegmented projections, and unsafe projections for the database schema with the most projections. Click a value to open the Table Treemap chart.
-
Disk Space Usage alerts you to the number of nodes that are low on disk space. Click the value to go to the Manage page. On the Manage page, the Storage Used KPI View is displayed.
-
Workload Analyzeranalyzes system information retained in SQL system tables and provides tuning recommendations, along with the cost (low, medium, or high) of running the command. See Analyzing workloads for more information.
-
I/O Wait Notices displays the number of nodes that, in the last hour, have recorded Disk I/O waits and Network I/O waits exceeding the wait threshold (1 second for Disk and 0 seconds for Network).
-
License Consumption displays the number of licenses your database uses, and the percentage of your Vertica Community Edition or Premium Edition license being used.
-
Unread Messages display the number of unread messages and alerts for the database. This count differs from the number of total messages across all your databases. Click the value to open the Message Center.
Status summary
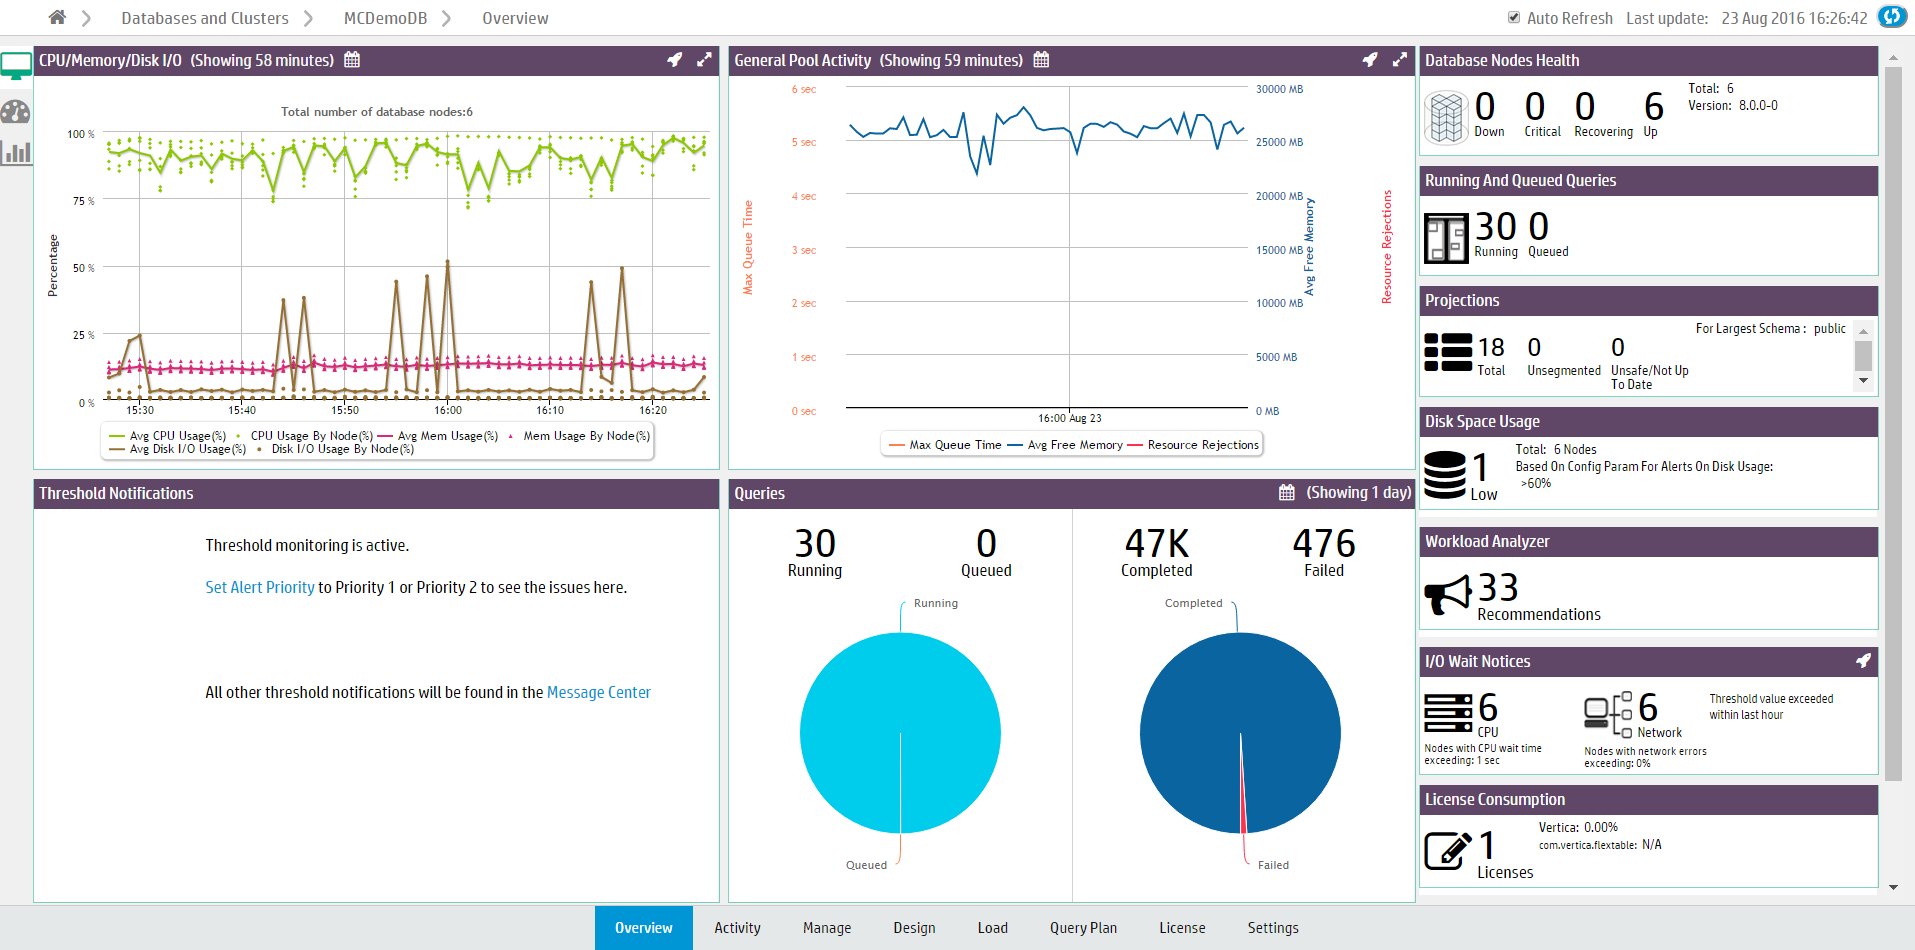
The Status Summary tab displays four modules that provide a general overview of the status of your cluster:
-
The CPU/Memory/Disk I/O Usage module shows cluster resource usage. The chart displays the number of nodes in the database cluster and plots average and per-node percentages for CPU, memory, and disk I/O usage.
-
The General Pool Activity module displays GENERAL pool activity. The chart displays average query queue times, average GENERAL pool free memory, and resource rejections. Use this chart to see how much free memory there is in GENERAL pool, or if there have been high queue times.
-
Click the dropdown in the title bar to view the GENERAL pool usage for the entire database (the default), for a specific subcluster, or for the nodes not assigned to a subcluster.
-
Click the expand icon in the title bar to open the chart in a bigger window.
-
Click a data point to open the Resource Pools Monitoring chart. See Managing workloads.
-
The Thresholds Notifications module displays alerts generated when a threshold has been exceeded in the database. Notifications are categorized by System Health and Performance.
-
In the module, you can acknowledge an alert (which marks it as read) or click the X to stop monitoring that threshold (which stops you receiving similar alerts in the future).
-
Customize thresholds and alert priorities for these notifications in the Thresholds tab of the database Settings page. See
Customizing Message Thresholds.
-
The Queries module displays query statistics. The first pie chart displays running and queued queries in the last 24 hours. The second chart displays completed and failed queries for the time frame you specify. Click a query count number above the chart to open the Query Monitoring chart. See Monitoring running queries with MC.
System health
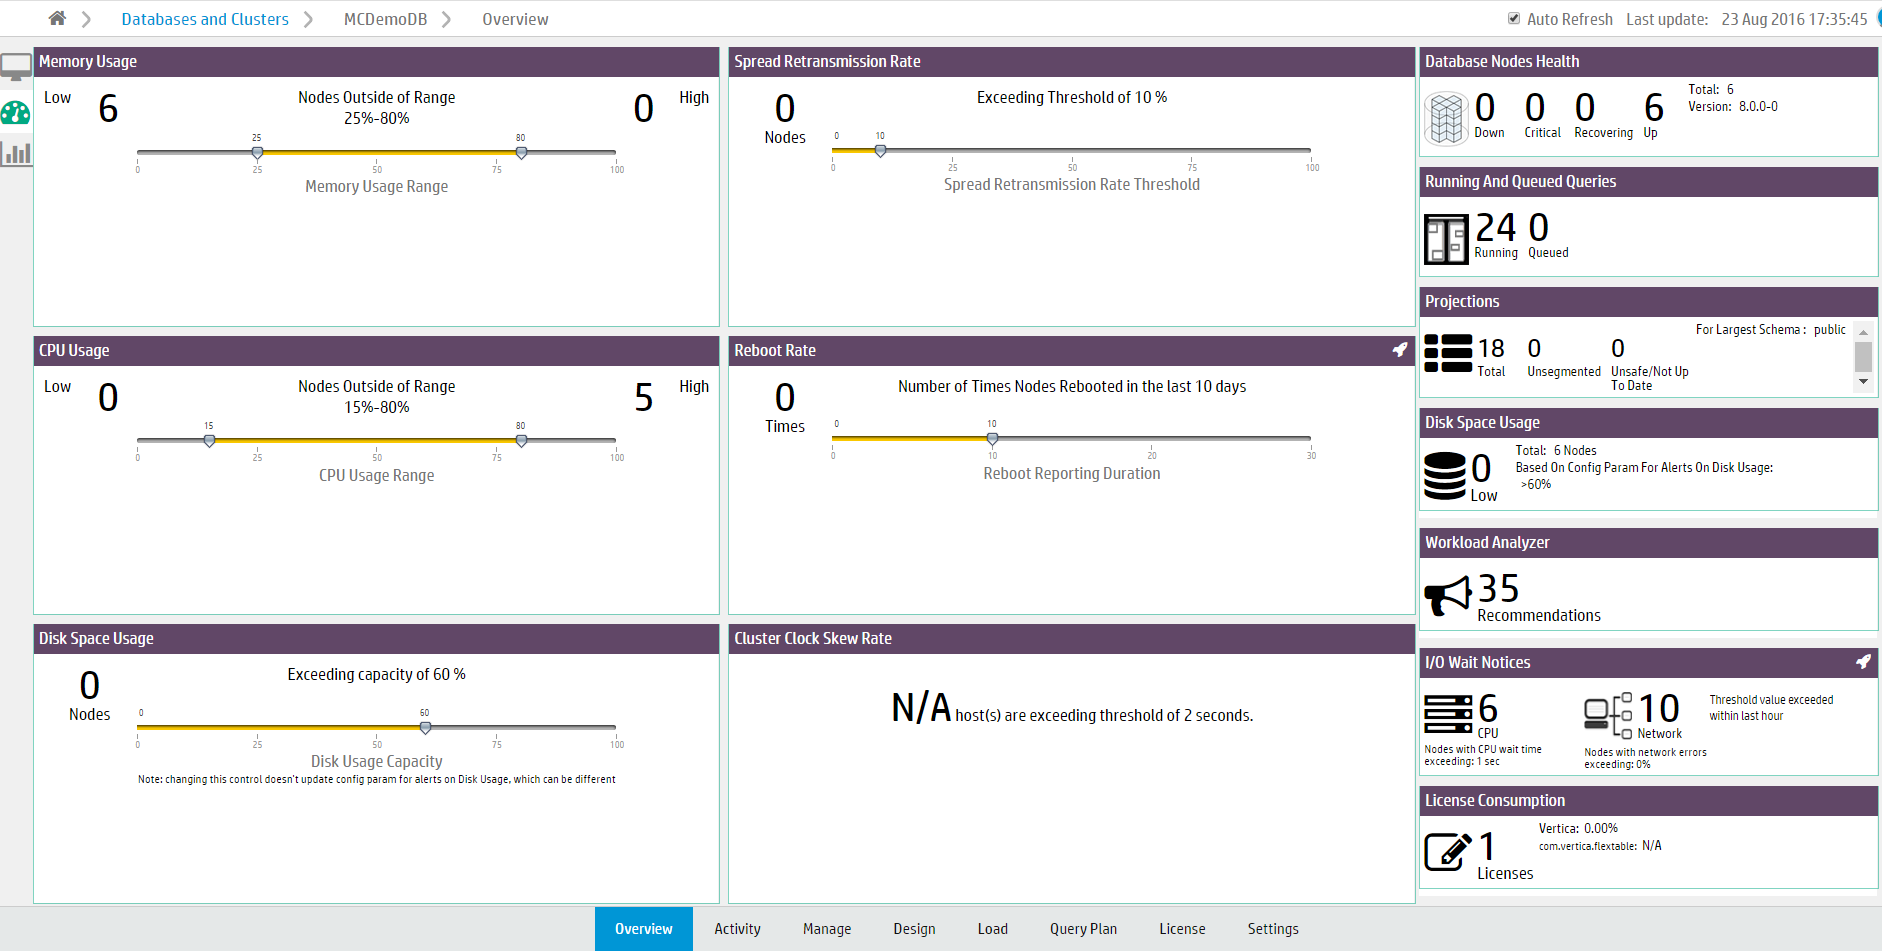
The System Health tab provides a summary of your system resource usage and node information, with filters that allow you to view resource usage within the ranges you specify.
Note
Note: Adjusting the filters on the System Health tab does not affect any database or MC settings.
-
The Memory Usage filter displays the number of nodes with high and low memory usage. Move the sliders to adjust the memory usage range filter.
For example, if you specify a range of 25% to 75% memory usage, the filter displays how many nodes are using less than 25% of memory (Low) and how many are using more than 75% (High). Hover your cursor over the Low and High values to see lists of what nodes fall, respectively, below or above the memory usage range you specified.
Click a node value to go to the Manage page, which displays the Memory Utilization KPI View.
-
The Spread Retransmission Rate filter displays the number of nodes with high spread retransmission rates. When a node's retransmission rate is too high, it is not communicating properly with other nodes. Move the slider to adjust the retransmission rate filter.
Hover your cursor over the Nodes value to see a list of what nodes exceeded the spread retransmission rate you specified. Click the node value to view spread retransmit rate alerts in the Message Center.
-
The CPU Usage chart displays the number of nodes with high and low CPU usage. Move the sliders to adjust the CPU usage range filter. Hover your cursor over the Low and High values to see lists of what nodes are below or above range you specified.
Click a node value to go to the Manage page, which displays the CPU Utilization KPI View.
-
The Reboot Rate filter displays the number of times nodes in the cluster have rebooted within the specified time frame. Use this filter to discover if nodes have gone down recently, or if there have been an unusual number of reboots. Move the slider to adjust the number of days. Hover over the Times value to see a list of the nodes that have rebooted and the times at which they did so.
-
The Disk Space Usage filter displays the number of nodes with high disk space usage. Move the slider to adjust the disk usage filter. Hover your cursor over the Nodes value to see a list of what nodes exceed the acceptable range.
Click the nodes value to go to the Manage page, which displays the Storage Used KPI View.
-
The Cluster Clock Skew Rate module displays the number of nodes that exceed a clock skew threshold. Nodes in a cluster whose clocks are not in sync can interfere with time-related database functions, the accuracy of database queries, and Management Console's monitoring of cluster activity.
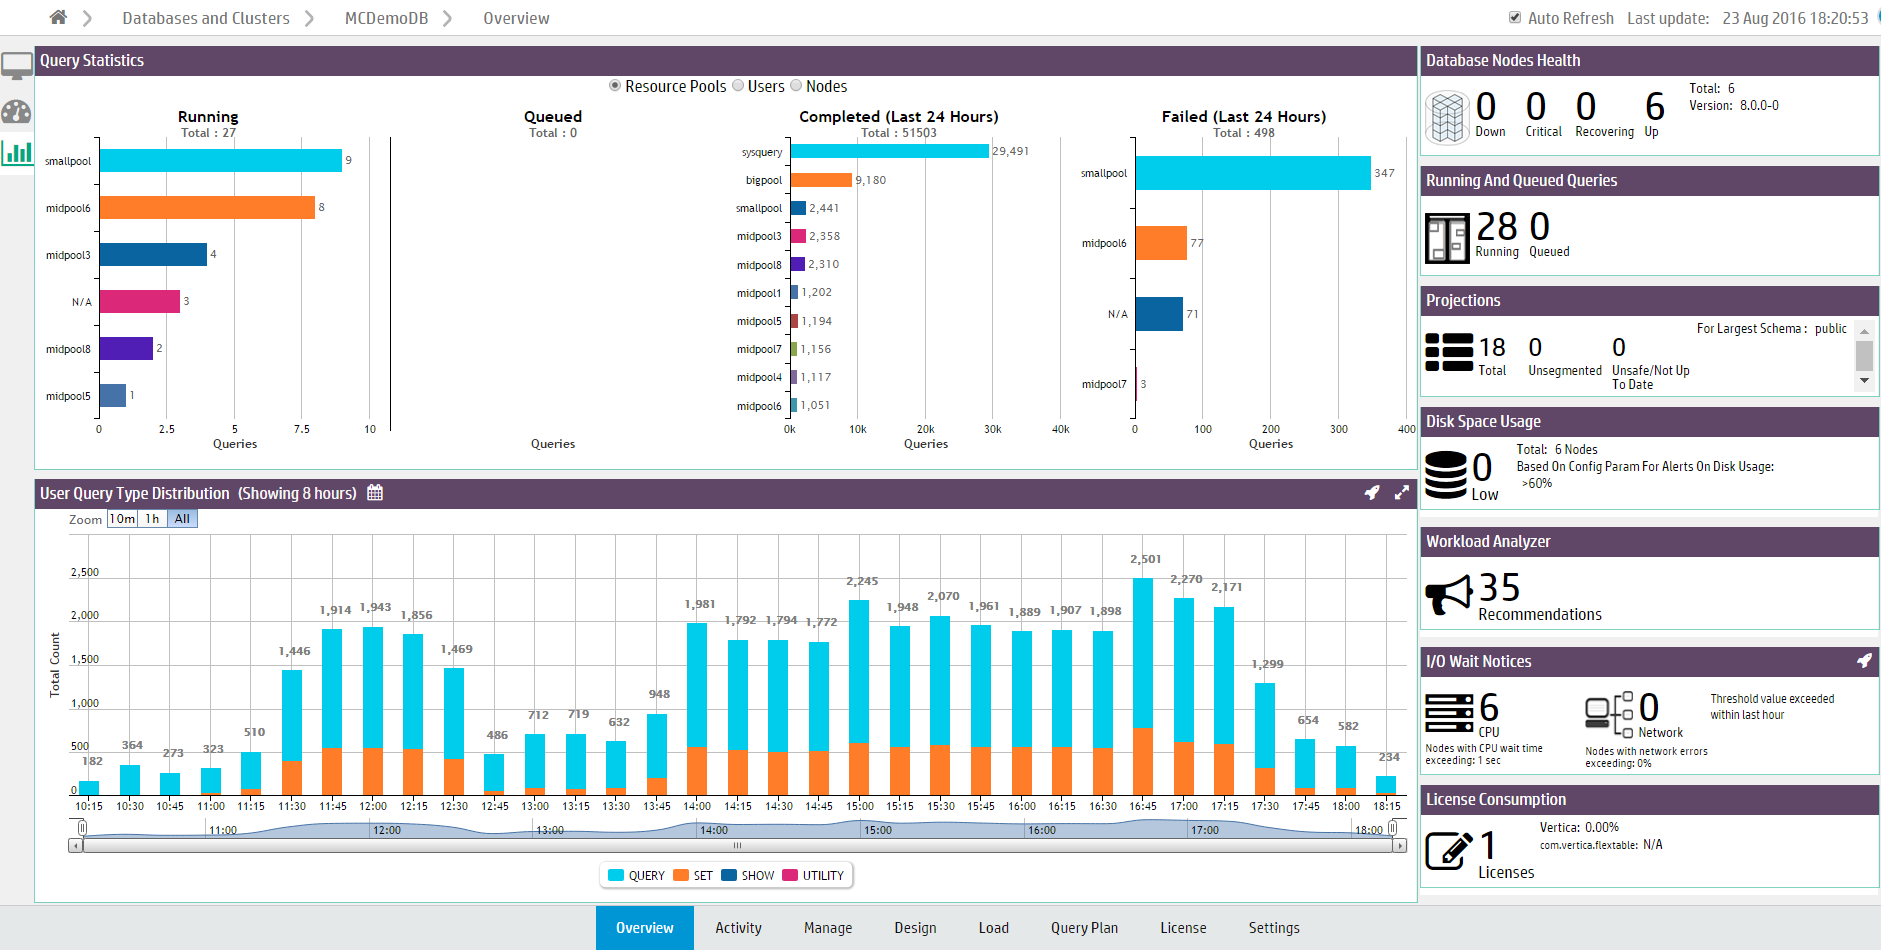
Query synopsis
The Query Synopsis page provides two modules that report system query activity and resource pool usage:
-
The Query Statistics module displays four bar charts that provide an overview of running, queued queries, failed, and completed queries in the past 24 hours.
-
Select one of the options at the top of the module to group the queries by Resource Pools, Users, Nodes, or Subclusters.
-
Click a bar on the chart to view details about those queries the Query Monitoring activity chart.
-
The User Query Type Distribution chart provides an overview of user and system query activity. The chart reports the types of operations that ran. The default is to display the types of operations that ran on all nodes in the database. Use the dropdown in the title bar to display the types of operations that ran on the nodes in a specific subcluster, or on the nodes not assigned to a subcluster.
-
Hover your cursor over chart points for more details.
-
Select a type of operation from the legend to remove or add it from the chart display.
-
To zoom to a certain time frame, you can adjust the sliders at the bottom of the chart.
-
Click a bar in the graph to open the Queries chart.
2 - Monitoring same-name databases with MC
If you are monitoring two databases with identical names on different clusters, you can determine which database is associated with which cluster by clicking the database icon on MC's Databases and Clusters page to view its dialog box.
If you are monitoring two databases with identical names on different clusters, you can determine which database is associated with which cluster by clicking the database icon on MC's Databases and Clusters page to view its dialog box. Information in the dialog displays the cluster on which the selected database is associated.
3 - Monitoring cluster nodes with MC
For a visual overview of all cluster nodes, click the running database on the Databases and Clusters page and click the Manage tab at the bottom of the page to open the cluster status page.
For a visual overview of all cluster nodes, click the running database on the Databases and Clusters page and click the Manage tab at the bottom of the page to open the cluster status page.
The cluster status page displays the nodes in your cluster.
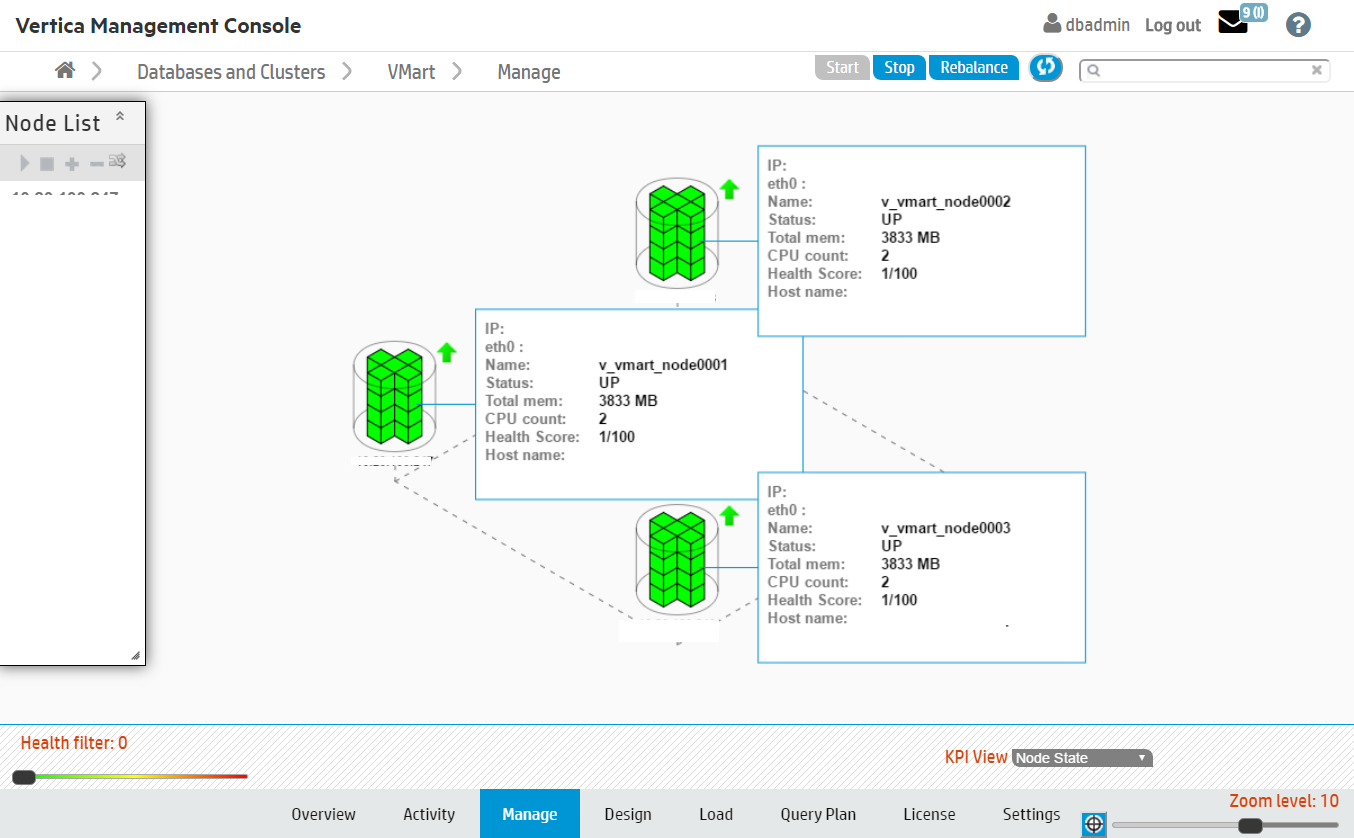
The appearance of the nodes indicate the following states:
-
Healthy: The nodes appear green.
-
Up: A small arrow to the right of the node points upward.
-
Critical: The node appears yellow and displays a warning icon to the right.
-
Down: The node appears red. To the right of the node, a red arrow points downwards.
-
Unplugged: An orange outlet and plug icon appears to the right. This is displayed when the MC cannot communicate with the agent running on the node.
You can get information about a particular node by clicking it, an action that opens the node details page.
Filtering what you see
If you have a large cluster, where it might be difficult to view dozens to hundreds of nodes on the MC interface, you can filter what you see. The Zoom filter shows more or less detail on the cluster overall, and the Health Filter lets you view specific node activity; for example, you can slide the bar all the way to the right to show only nodes that are down. A message next to the health filter indicates how many nodes in the cluster are hidden from view.
On this page, you can perform the following actions on your database cluster:
-
Add, remove and replace nodes
-
Rebalance data across all nodes
-
Stop or start (or restart) the database
-
Refresh the view from information MC gathers from the production database
-
View key performance indicators (KPI) on node state, CPU, memory, and storage utilization (see Monitoring cluster performance with MC for details)
Note
Starting, stopping, adding, and dropping nodes and rebalancing data across nodes works with the same functionality and restrictions as those same tasks performed through the
Administration tools.
If you don't see what you expect
If the cluster grid does not accurately reflect the current state of the database (for example if the MC interface shows a node in INITIALIZING state, but when you use the Administration Tools to View Database Cluster State, you see that all nodes are UP), click the Refresh button in the toolbar. Doing so forces MC to immediately synchronize with the agents and update MC with new data.
Don't press the F5 key, which redisplays the page using data from MC and ignores data from the agent. It can take several seconds for MC to enable all database action buttons.
4 - Monitoring node activity with MC
If a node fails on an MC-managed cluster or you notice one node is using higher resources than other cluster nodes—which you might observe when monitoring the Overview page—open the Manage page and click the node you want to investigate.
If a node fails on an MC-managed cluster or you notice one node is using higher resources than other cluster nodes—which you might observe when monitoring the Overview page—open the Manage page and click the node you want to investigate.
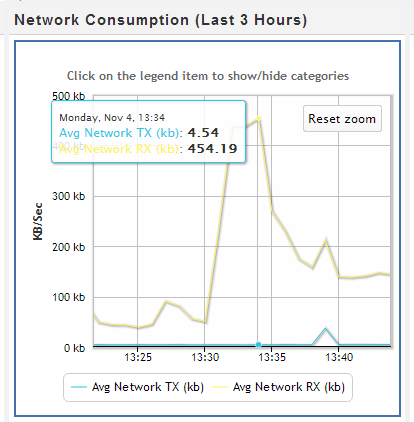
The Node Details page opens and provides summary information for the node (state, name, total memory, and so on), as well as resources the selected node has been consuming for the last three hours, such as average CPU, memory, disk I/O percent usage, network consumption in kilobytes, and the percentage of disk storage the running queries have been using. You can also browse and export log-level data from AgentTools and Vertica log files. MC retains a maximum of 2000 log records.
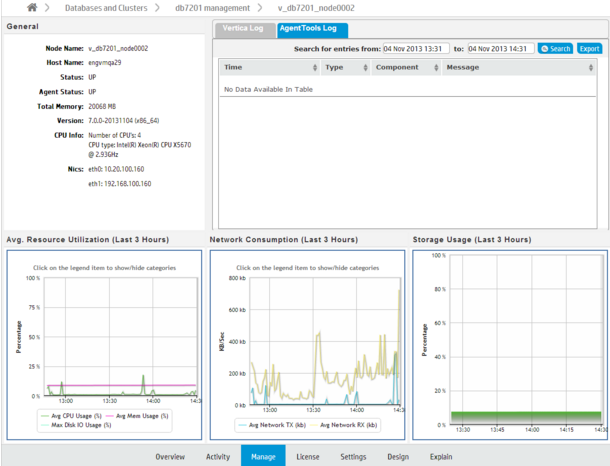
For a more detailed view of node activity, use the mouse to drag-select around a problem area in one of the graphs, such as the large spike in network traffic in the above image. Then hover over the high data point for a summary.
See also
5 - Monitoring cluster performance with MC
Key Performance Indicators (KPIs) are a type of performance measurement that let you quickly view the health of your database cluster through MC's Manage page.
Key Performance Indicators (KPIs) are a type of performance measurement that let you quickly view the health of your database cluster through MC's Manage page. These metrics, which determine a node's color, make it easy for you to quickly identify problem nodes.
Metrics on the database are computed and averaged over the latest 30 seconds of activity and dynamically updated on the cluster grid.
How to get metrics on your cluster
To view metrics for a particular state, click the menu next to the KPI View label at the bottom of the Manage page, and select a state.
MC reports KPI scores for:
-
Node state—(default view) shows node status (up, down, k-safety critical) by color; you can filter which nodes appear on the page by sliding the health filter from left to right
-
CPU Utilization—average CPU utilization
-
Memory Utilization—average percent RAM used
-
Storage Utilization—average percent storage used
After you make a selection, there is a brief delay while MC transmits information back to the requesting client. You can also click Sync in the toolbar to force synchronization between MC and the client.
Node colors and what they mean
Nodes in the database cluster appear in color. Green is the most healthy and red is the least healthy, with varying color values in between.
Each node has an attached information dialog box that summarizes its score. It is the score's position within a range of 0 (healthiest) to 100 (least healthy) that determines the node's color bias. Color bias means that, depending on the value of the health score, the final color could be slightly biased; for example, a node with score 0 will be more green than than a node with a score of 32, which is still within the green range but influenced by the next base color, which is yellow. Similarly, a node with a score of 80 appears as a dull shade of red, because it is influenced by orange.
MC computes scores for each node's color bias as follows:
-
0-33: green and shades of green
-
34-66: yellow and shades of yellow
-
67-100: red and shades of red shades
If the unhealthy node were to consume additional resources, its color would change from a dull orange-red to a brighter red.
Filtering nodes from the view
The health filter is the slider in the lower left area of page. You can slide it left to right to show or hide nodes; for example, you might want to hide nodes with a score smaller that a certain value so the UI displays only the unhealthy nodes that require immediate attention. Wherever you land on the health filter, an informational message appears to the right of the filter, indicating how many nodes are hidden from view.
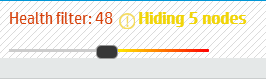
Filtering is useful if you have many nodes and want to see only the ones that need attention, so you can quickly resolve issues on them.
6 - Monitoring cluster CPU and Memory with MC
On the MC Overview page, the CPU/Memory subsection provides a graph-based overview of cluster resources during the last hour, which lets you quickly monitor resource distribution across nodes.
On the MC Overview page, the CPU/Memory subsection provides a graph-based overview of cluster resources during the last hour, which lets you quickly monitor resource distribution across nodes.
This chart plots average and per-node percentages for both CPU and memory with updates every minute—unless you clear Auto Refresh Charts in the toolbar. You can also filter what the chart displays by clicking components in the legend at the bottom of the subsection to show/hide those components. Yellow data points represent individual nodes in the cluster at that point in time.
Investigating areas of concern
While viewing cluster resources, you might wonder why resources among nodes become skewed. To zoom in, use your mouse to drag around the problem area surrounding the time block of interest.
After you release the mouse, the chart refreshes to display a more detailed view of the selected area. If you hover your cursor over the node that looks like it's consuming the most resources, a dialog box summarizes that node's percent usage.
For more information, click a data point (node) on the graph to open MC's node details page. To return to the previous view, click Reset zoom.
See also
7 - Monitoring database storage with MC
The Infrastructure page's Storage View provides a summary of the amount of data stored in your database, and the persistent location of that data.
The Infrastructure page's Storage View provides a summary of the amount of data stored in your database, and the persistent location of that data. Use this view to monitor how much of your storage capacity your databases are using.
For a database running in Eon Mode, MC also displays bar charts in the Storage View that illustrate shard subscription status. Use these charts to determine if your current subscription layout is optimal for querying your Eon Mode database. For information about using subscription status charts, see Monitoring subscription status in Eon Mode.

Monitor storage usage
The storage summary table lists all databases currently monitored by MC and information about their storage:
-
Database Size. Click Load Size to calculate the total size of the database.
-
Database Mode. Vertica databases run in Enterprise Mode, or Eon Mode.
-
Storage Type. Enterprise Mode databases list the OS of the local nodes where data is stored. Eon Mode databases list the type of communal storage location where it stores its data. Eon Mode currently supports only S3-compatible storage locations.
-
View. The options displayed in this column depend on the database mode and type of data on the database.
-
Vertica Tables Storage: For Enterprise Mode databases only. Click for a dialog listing the node and local directories where Vertica table data is stored.
-
Communal/Depot Storage: For Eon Mode databases only. Click for a dialog displaying location paths for your depot and communal storage.
-
Communal Storage Subscription: For Eon Mode databases only. Click to view bar charts at the bottom of the Storage View page, illustrating shard subscription status. For more about these charts, Monitoring subscription status in Eon Mode.
-
External Tables: Available when there are external tables in your database. Click for a dialog displaying details about all external tables. (Also see Monitoring table utilization and projections with MC.)
-
HCatalog Details: Available when your Vertica database has access to Hive tables. (See Using the HCatalog Connector.) Click for a dialog displaying details about HCatalog schemas. For any HCatalog schema, click View Tables for details about all tables accessible through that schema. (Also see Monitoring table utilization and projections with MC.)
In front of Eon Mode database names in the list, a plus icon displays. Click the icon to expand more details about the database's depot capacity and usage. The depot is cache-like storage where Eon Mode databases keep local copies of communal storage data for faster query access.
See also
8 - Monitoring subscription status in Eon Mode
To view subscription charts for any Eon Mode database you monitor, click View Your Infrastructure on the MC Home page.
To view subscription charts for any Eon Mode database you monitor, click View Your Infrastructure on the MC Home page. Then click the Storage View tab.
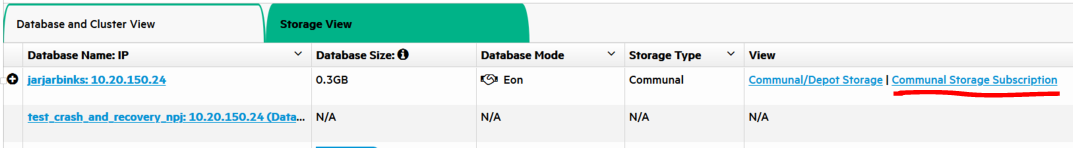
Click the Details action for that database in the storage summary list (highlighted in red in the image below).
When you click Details, two charts become available on the bottom half of the page: The Sharding Subscription chart, and the Node Subscription chart. You can switch between these two charts using the drop down menu to the right of the chart title.
Why monitor shard and node subscriptions?
Shards are segments of the data that is stored persistently in your Eon Mode database's communal storage location, for example Amazon S3 in the cloud or PureStorage if your cluster is on premises. Each node in the database subscribes to a subset of those shards. In this way, the node gets updated on when to populate its depot with new data from communal storage. (See Namespaces and shards.)
For K-safety in an Eon Mode database, shards should have multiple node subscribers to ensure that even if a node goes down or is being used by another query, the data on that shard is still available on other nodes. If a shard has no node subscribers, that could indicate that data loss is occurring.
Subscriptions go through several transitions, which are illustrated by colors in the subscription charts:
-
Pending (Yellow). The node is ready to subscribe to a certain shard. It cannot yet serve queries because it is not actively subscribed to the shard yet.
-
Passive (Blue/Teal). The node could potentially serve queries for a shard it is passively subscribed to, but its depot contents for that shard may not yet be up to date, which could negatively impact query performance. The passively subscribed node is waiting for an active node subscriber of the shard to send it the most recent data.
-
Active (Green). The node is actively subscribed to the shard, can load new data from communal storage, and can serve queries for data in that shard. The actively subscribed node sends data from that shard to other subscribed nodes.
-
Removing (Dark Red/Maroon). The node is unsubscribing from the shard. It may have the most recent data from that shard, but that state is temporary until data from that shard is cleaned up.
-
Inactive (Red). The subscribed node is down. It can no longer serve queries for that shard.
Operations such as adding or removing nodes or rebalancing shards can change which nodes subscribe to which shards. Shard subscription changes can prevent object-level restore from backups, though full restore is always possible. If shard subscriptions change, consider making a backup with the new configuration.
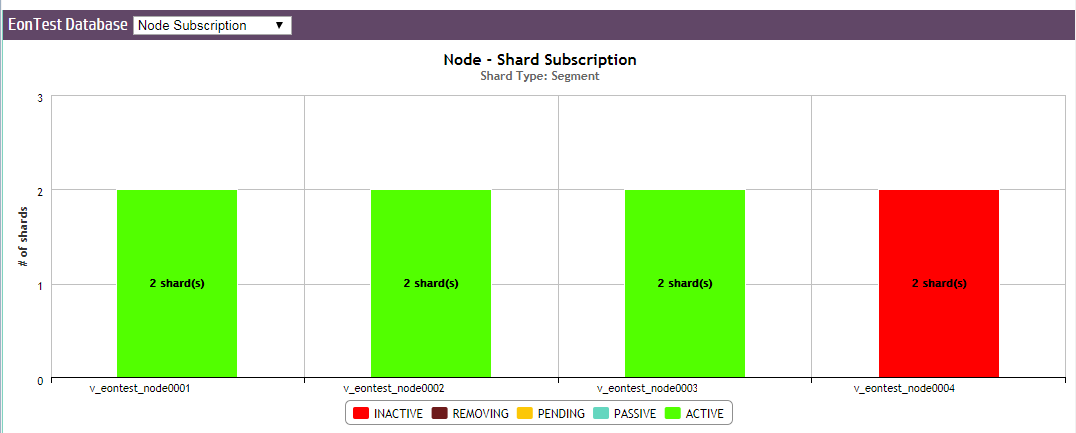
Monitor sharding subscription
The Sharding Subscription chart displays how many nodes are subscribed to each shard in your database, and what type of subscription it is.
You can hover over any bar in the chart to see which nodes are subscribed to the shard. Click on a subscription type in the legend to show or hide it in the chart display.
The example below shows the shard subscription status for a running Eon Mode database. The database has three nodes that are up, and one node (Node 4) that has been added to the cluster, but is down.
You can hover over any bar in the chart to see which nodes are subscribed to the shard. In this example, nodes 1 and 3 have active subscriptions to the first shard (green); nodes 1 and 2 to the second shard; and nodes 2 and 3 to the third shard.
The active subscriptions are evenly spread across the shards. This is a k-safe Eon Mode database.
Node 4 was subscribed to two shards; however, because it is down, its subscriptions to the shards are now inactive (red).
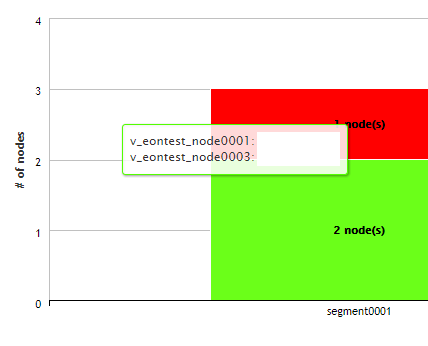
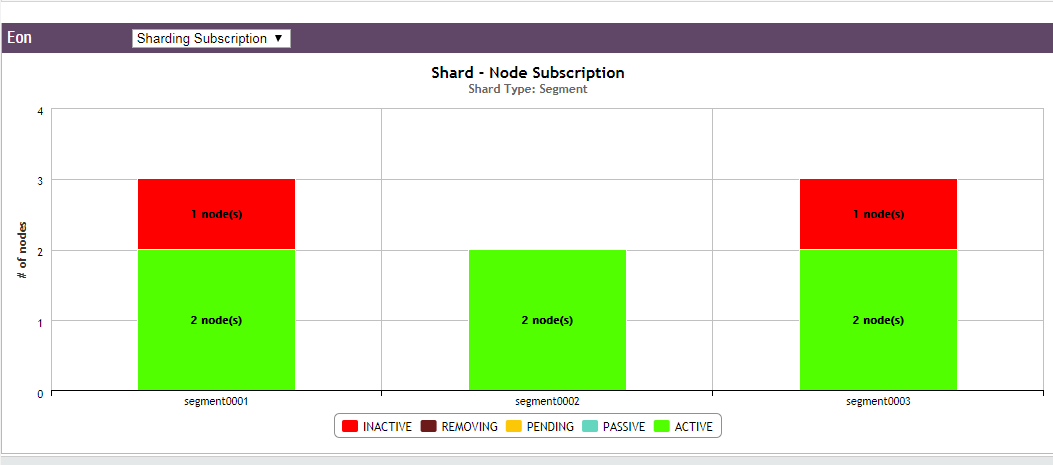
Monitor node subscriptions
Use this chart to view how many shards each node in your database is subscribed to, and the state of those subscriptions. The number of shards each node is subscribed to should be about the same to prevent overworking any given node.
Hover over any bar to see the shards it is subscribed to. The color of the bar indicates the state of each subscription. Click on a subscription type in the legend to show or hide it in the chart display.
The example below shows the same database from the Sharding Subscription example above. Nodes 1 through 3 are each actively subscribed to two shards (green). At least two nodes are subscribed to every shard in the database (which you can double check using the Sharding Subscription chart), ensuring that even if one of the nodes is down or being used in a query, another node is still actively subscribed and can access the data of that shard.
Since Node 4 is down, the chart shows that both its shard subscriptions are now inactive.
See also
9 - Monitoring system resources with MC
can be turned off by setting advanced.charts=false in the console.properties file, but don't document this.
MC's Activity page provides immediate visual insight into potential problem areas in your database's health by giving you graph-based views of query and user activity, hardware and memory impact, table and projection usage, system bottlenecks, and resource pool usage.
Select one of the following charts in the toolbar menu:
System-level activity charts automatically update every five minutes, unless you clear Auto Refresh in the toolbar. Depending on your system, it could take several moments for the charts to display when you first access the page or change the kind of resource you want to view.
Chart viewing options
You can specify time frames for some charts, which display a calendar icon in their title bars. Click the calendar icon to specify the time frame for that module.
If you have enabled extended monitoring on your database, MC can display longer ranges of data in certain charts. See Extended monitoring. If a chart is using extended monitoring data, the rocket ship icon appears in the title bar:
You can expand some charts to view them in larger windows. Click the expand icon in the title bar to do so:
9.1 - Monitoring query activity with MC
The Queries chart displays information about query concurrency and average resource usage for CPU/memory, network activity, and disk I/O percent based on maximum rated bandwidth.
The Queries chart displays information about query concurrency and average resource usage for CPU/memory, network activity, and disk I/O percent based on maximum rated bandwidth.
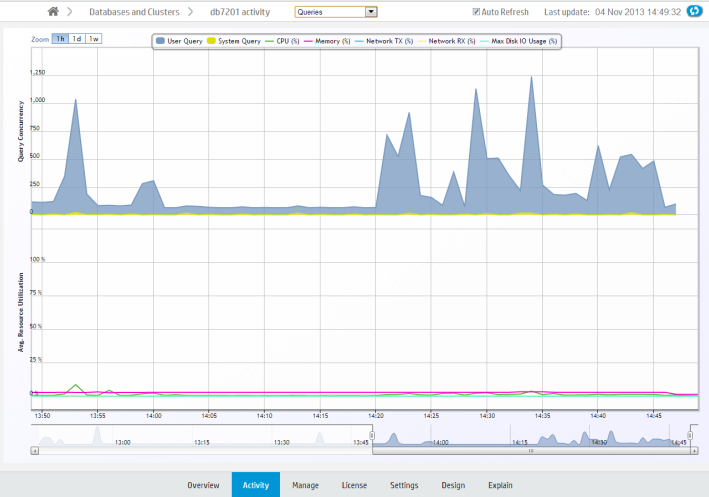
Hover over a data point for more information about percent usage for each of the resource types.
If you click a data point, MC opens a details page for that point in time, summarizing the number of user queries and system queries. This page can help you identify long-running queries, along with the query type. You can sort table columns and export the report to a file.
Monitoring key events
On the main Queries page, MC reports when a key event occurred, such as a Workload Analyzer or rebalance operation, by posting a Workload Analyzer (Workload Analyzer) and/or RBL (rebalance) label on the resource section of the chart.
Filtering chart results
The default query concurrency is over the last hour. The chart automatically refreshes every five minutes, unless you clear the Auto Refresh option in the toolbar. You can filter results for 1 hour, 1 day, or up to 1 week, along with corresponding average resource usage. You can also click different resources in the legend to show or hide those resources.
To return to the main Queries page, use the slider bar or click the 1h button.
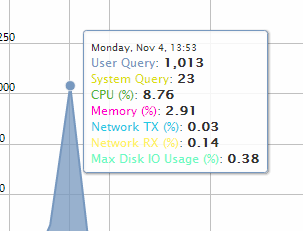
Viewing more detail
To zoom in for detail, click-drag the mouse around a section or use the sliding selector bar at the bottom of the chart. After the detailed area displays, hover your cursor over a data point to view the resources anchored to that point in time.
For more detail about user or system queries, click a data point on one of the peaks. A Detail page opens to provide information about the queries in tabular format, including the query type, session ID, node name, query type, date, time, and the actual query that ran.
The bottom of the page indicates the number of queries it is showing on the current page, with Previous and Next buttons to navigate through the pages. You can sort the columns and export contents of the table to a file.
To return to the main Queries page, click <database name> Activity in the navigation bar.
9.2 - Monitoring internal sessions with MC
The Internal Sessions chart provides information about Vertica system activities, such as Tuple Mover and rebalance cluster operations, along with their corresponding resources, such as CPU/memory, networking, and disk I/O percent used.
The Internal Sessions chart provides information about Vertica system activities, such as Tuple Mover and rebalance cluster operations, along with their corresponding resources, such as CPU/memory, networking, and disk I/O percent used.
Hover your cursor over a bar for more information. A dialog box appears and provides details.
Filtering chart results
You can filter what the chart displays by selecting options for the following components. As you filter, the Records Requested number changes:
-
Category: Filter which internal session types (mergeout, rebalance cluster) appear in the graph. The number in parentheses indicates how many sessions are running on that operation.
-
Session duration: Lists time, in milliseconds, for all sessions that appear on the graph. The minimum/maximum values on which you can filter (0 ms to n ms) represent the minimum/maximum elapsed times within all sessions currently displayed on the graph. After you choose a value, the chart refreshes to show only the internal sessions that were greater than or equal to the value you select.
-
Records requested: Represents the total combined sessions for the Category and Session Duration filters.
9.3 - Monitoring user sessions with MC
The User Sessions charts provide information about Vertica user activities for all user connections open to MC.
The User Sessions charts provide information about Vertica user activities for all user connections open to MC.
Choose User Sessions from the menu at the top of your database's Activity page to view these charts.
View open sessions
The Open Sessions tab displays a table of currently open sessions for each user. You can close a session or cancel a query on this tab by selecting that option from the Actions column.
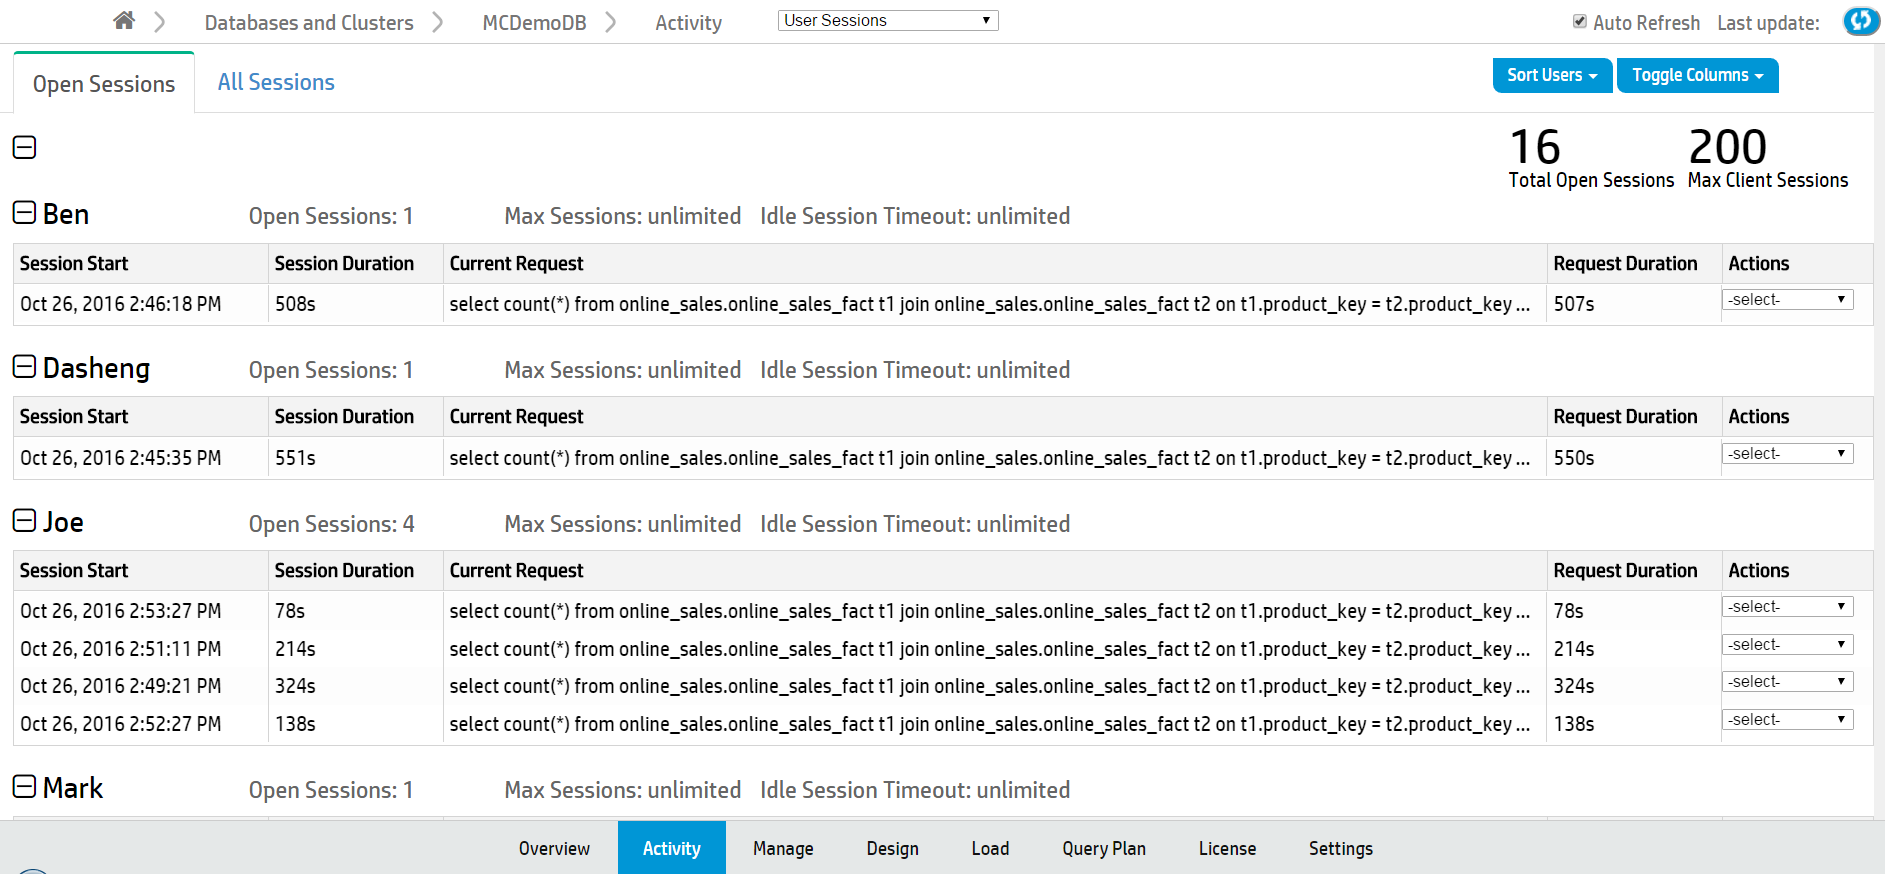
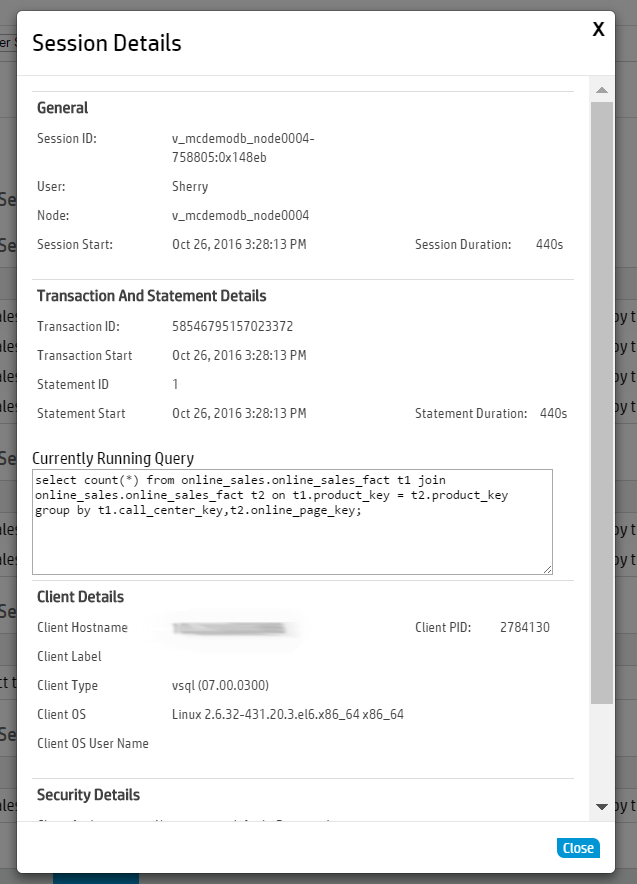
Click any row to open a Session Details dialog that shows more extensive information about that session.
To configure the Open Sessions page display:
-
Use the Sort Users button at the top right of the page to sort by user name or number of open sessions.
-
Use the Toggle Columns button at the top right of the page to select which columns to display. Each table displays session information by column, such as the session start time or the
View all user sessions
The All Sessions tab displays a history of all user sessions in a swim lane chart.
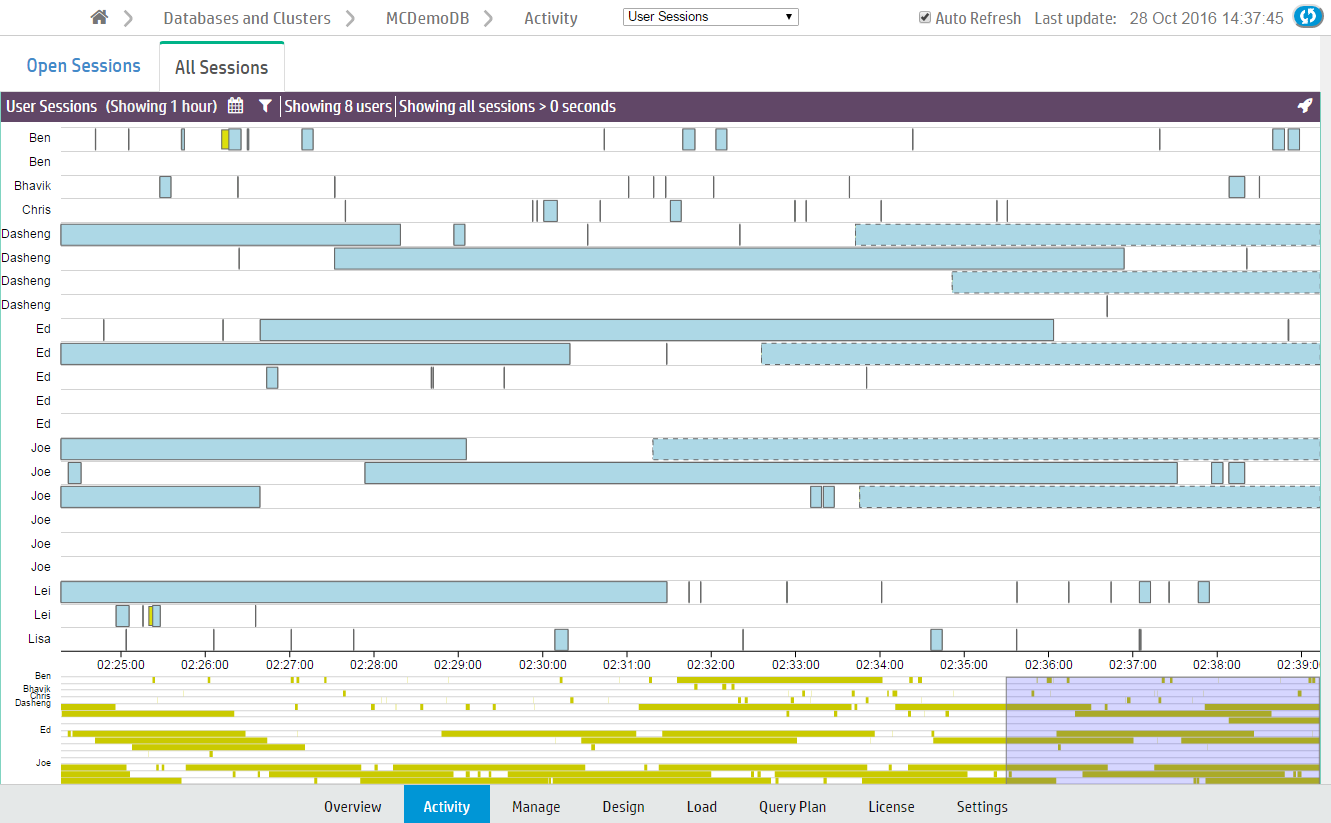
What chart colors mean
Bars outlined with a dotted line are currently running sessions.
Sessions are divided into two colors, yellow and blue.
-
Yellow bars represent user (system) sessions. If you click a yellow bar, MC opens a Detail page that shows all queries that ran or are still running within that session.
-
Blue bars represent user requests (transactions within the session). If you click a blue bar in the graph, MC opens a Detail page that includes information for that query request only.
When you hover your mouse over a transaction bar, a dialog box provides summary information about that request, such as which user ran the query, how long the transaction took to complete, or whether the transaction is still running.
Filter chart results
Extremely busy systems will show a lot of activity on the interface, perhaps more than you can interpret at a glance. You can filter chart results in several ways:
-
Zoom. The context chart at the bottom of the page highlights in blue which section of the All Sessions chart you are viewing. Click and drag the blue box left or right to view earlier or later user sessions. Click and drag the edges of the blue box to zoom in or out.
-
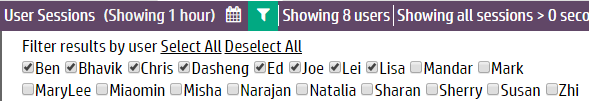
Select fewer users. Click the filter icon ( ) at the top of the page. A menu of a menu of all available users appears below. Deselect users to exclude from the chart.
-
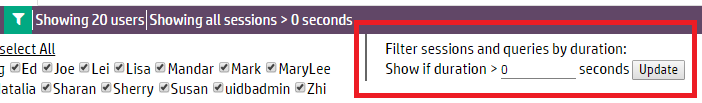
Change the session duration (how long a session took to run). Click the Filter icon () at the top of the page. The Filter sessions and queries by duration field appears below. Enter the minimum session length (in seconds) to display on the chart and click Update.
-
Specify a time frame. Click the Calendar icon ( ) at the top of the page to display the From and To fields. Using the fields, select the time frame to display in the chart and click Update.
9.4 - Monitoring system memory usage with MC
The Memory Usage chart shows how system memory is used on individual nodes over time.
The Memory Usage chart shows how system memory is used on individual nodes over time. Information the chart displays is stored based on Data collector retention policies, which a superuser can configure. See Configuring data retention policies.
The first time you access the Memory Usage chart, MC displays the first node in the cluster. MC remembers the node you last viewed and displays that node when you access the Activity page again. To choose a different node, select one from the Nodes drop-down list at the bottom of the chart. The chart automatically refreshes every five minutes unless you disable the Auto Refresh option.
Tip
On busy systems, the Node list might cover part of the graph you want to see. You can move the list out of the way by dragging it to another area on the page.
Types of system memory
The Memory Usage chart displays a stacking area for the following memory types:
-
swap
-
free
-
fcache (file cache)
-
buffer
-
other (memory in use by all other processes running on the system besides the main Vertica process, such as the MC process or agents)
-
Vertica
-
rcache (Vertica ROS cache)
-
catalog
When you hover over a data point, a dialog box displays percentage of memory used during that time period for the selected node.
9.5 - Monitoring system bottlenecks with MC
The System Bottlenecks chart helps you quickly locate performance bottlenecks on a particular node.
The System Bottlenecks chart helps you quickly locate performance bottlenecks on a particular node. The first time you access the Activity page, MC displays the first node in the cluster. To choose a different node, select one from the Nodes drop-down list at the bottom of the chart.
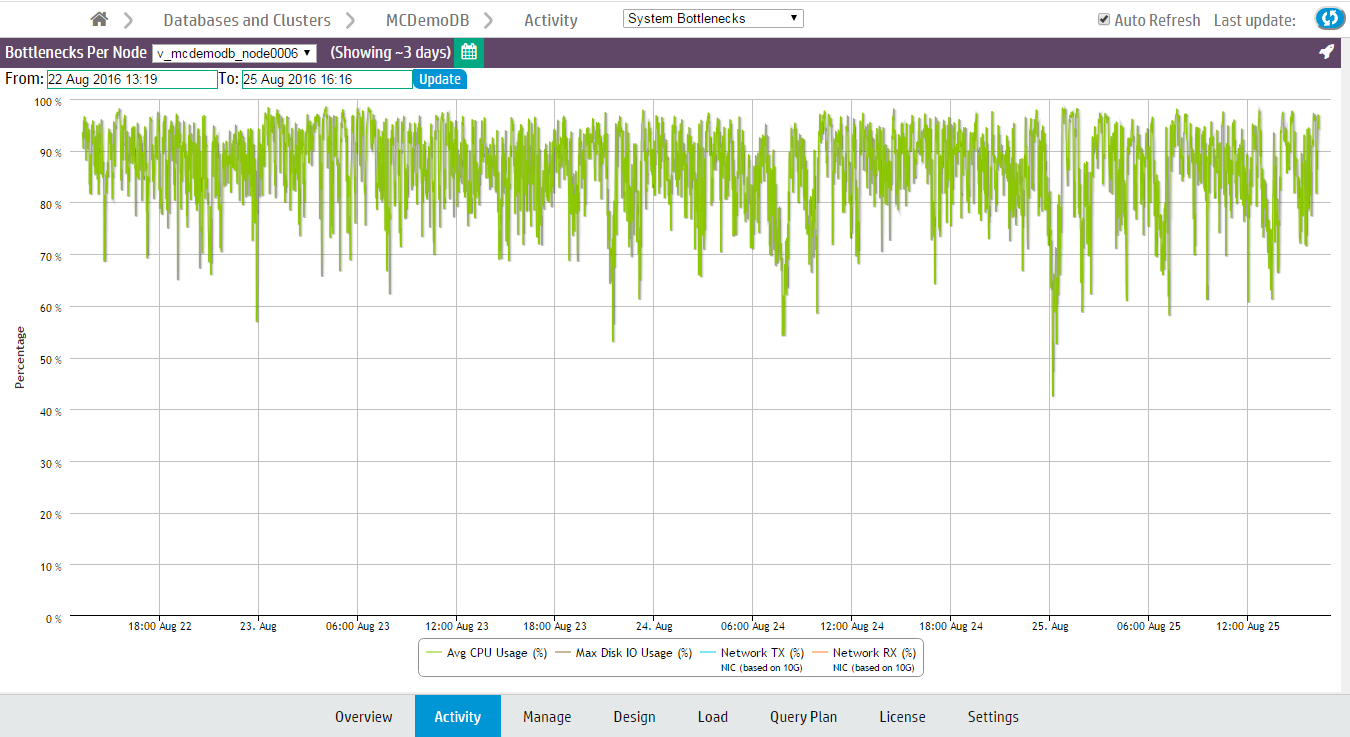
The System Bottlenecks chart reports what MC identifies as the most problematic resource during a given time interval. You can use this chart as a starting point for investigation.
How MC gathers system bottleneck data
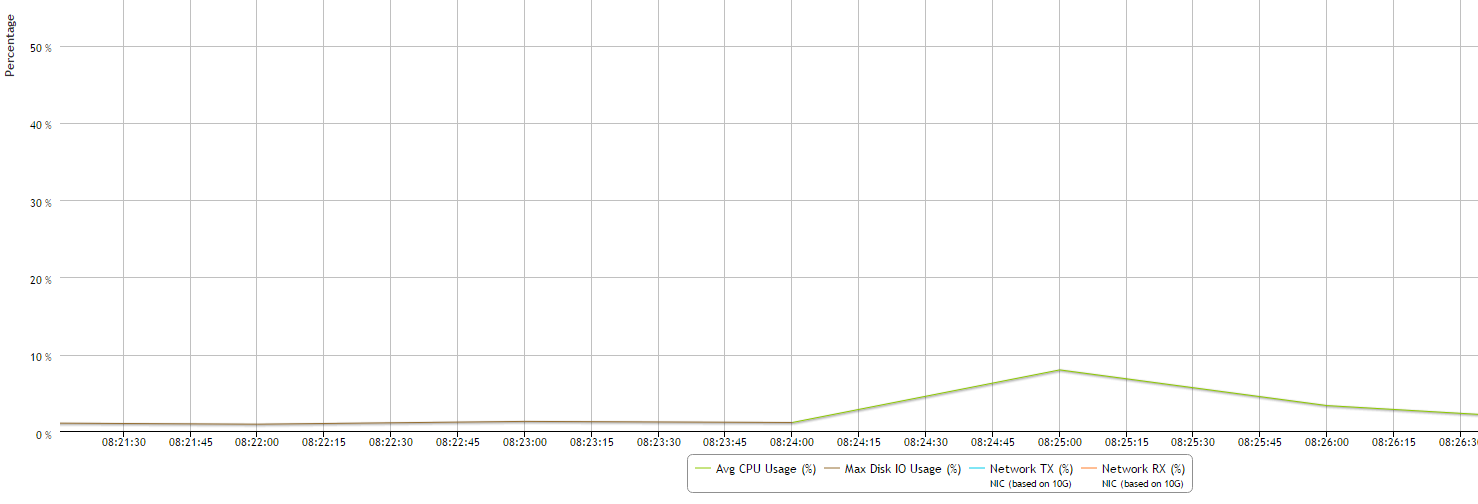
Every 15 minutes, MC takes the maximum percent values from various system resources and plots a single line with a data point for the component that used the highest resources at that point in time. When a different component uses the highest resources, MC displays a new data point and changes the line color to make the change in resources obvious. Very busy databases can cause frequent changes in the top resources consumed, so you might notice heavy chart activity.
In the following example, at 08:24 the maximum resources used changed from Disk I/O to CPU. The System Bottlenecks charts denotes this with a change in line color from brown to green.
The components MC reports on
MC reports maximum percent values for the following system components:
-
Average percent CPU usage
-
Average percent memory usage
-
Maximum percent disk I/O usage
-
Percent data sent over the network (TX)
-
Percent data received over the network (RX)
How MC handles conflicts in resources
If MC encounters two metrics with the same maximum percent value, it displays one at random. If two metrics are very close in value, MC displays the higher of the two.
9.6 - Monitoring user query phases with MC
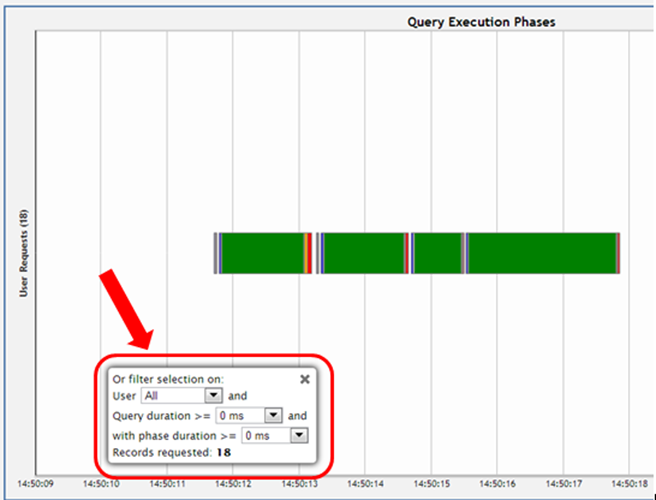
The User Query Phases chart provides information about the query execution phases that a query goes through before completion.
The User Query Phases chart provides information about the query execution phases that a query goes through before completion. Viewing this chart helps you identify at a glance queries possibly delayed because of resource contention.
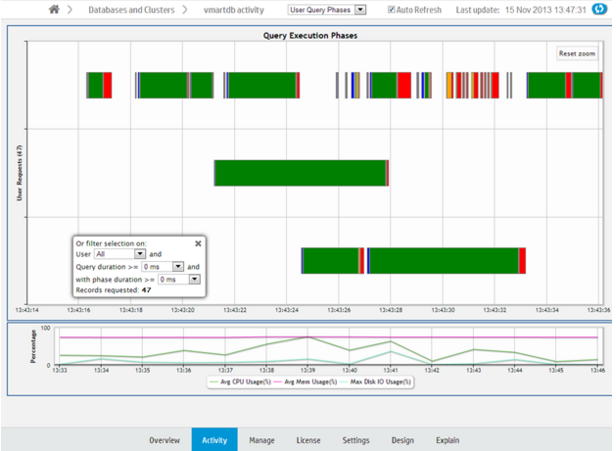
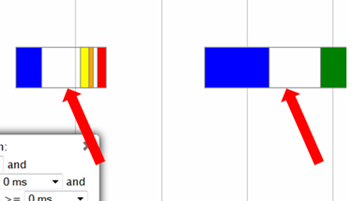
Each bar, bound by a gray box, represents an individual query. Within a query, a different color represents each query phase. The chart does not show phases for queries with durations of less than 4 seconds. Blank spaces within a query represent waiting times, as in the image below.
Hover over a phase in the query for information on the phase type and duration.
The chart shows queries run over the last 15 minutes. The chart automatically refreshes every five minutes, unless you clear the Auto Refresh option in the toolbar.
Filtering chart results
You can filter what the chart displays by selecting options for the user running the query, minimum query duration, and minimum phase duration.
Viewing more detail
To zoom in for detail, click-drag the mouse around a section of the chart. Click Reset Zoom, located at the top right corner of the chart, to restore the chart to its original view.
For more detail, click a query bar. The Detail page opens to provide information about the queries in tabular format, including the query type, session ID, node name, query type, date, time, the actual query that ran, and an option to run Explain Plan or profile the query. Click a table column header to sort the queries by that category.
To export the contents of the table to a file, click Export, located at the upper right of the page.
To return to the main Queries page, click Activity in the navigation bar.
9.7 - Monitoring table utilization and projections with MC
The Table Utilization activity page helps you monitor tables and projections in your database by schema.
The Table Utilization activity page helps you monitor tables and projections in your database by schema.
Use the Table Utilization charts for a listing of all the tables in a schema, which you can filter and sort; or view them by size and usage in a treemap visualization. These charts allow you to identify outliers among your tables, such as those that are large or overused.
The Projections Summary, located on the right side of the page, provides an overview of the projections in the schema. You can use this summary to help identify if projections are evenly distributed across nodes.
Visualize tables
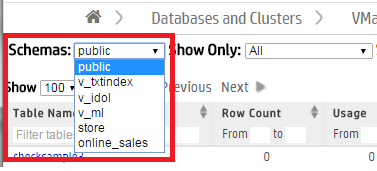
MC shows you the public schema by default. To specify which schema to view, choose one from the Schemas menu at the top of the activity page. The summary of tables and projections in that schema appear on the page.
MC visualizes your available tables by schema in a table chart or as a treemap chart. From the Show As menu, choose Table for a tabular chart or Map for a treemap chart. By default, MC displays the Table chart.

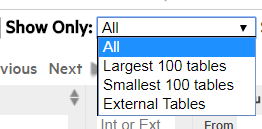
Depending on the number of tables in the schema, the chart may be crowded. To narrow it down, use the Show Only filter at the top of the page to display only the largest 100 tables, smallest 100 tables, or external tables.
View the table chart
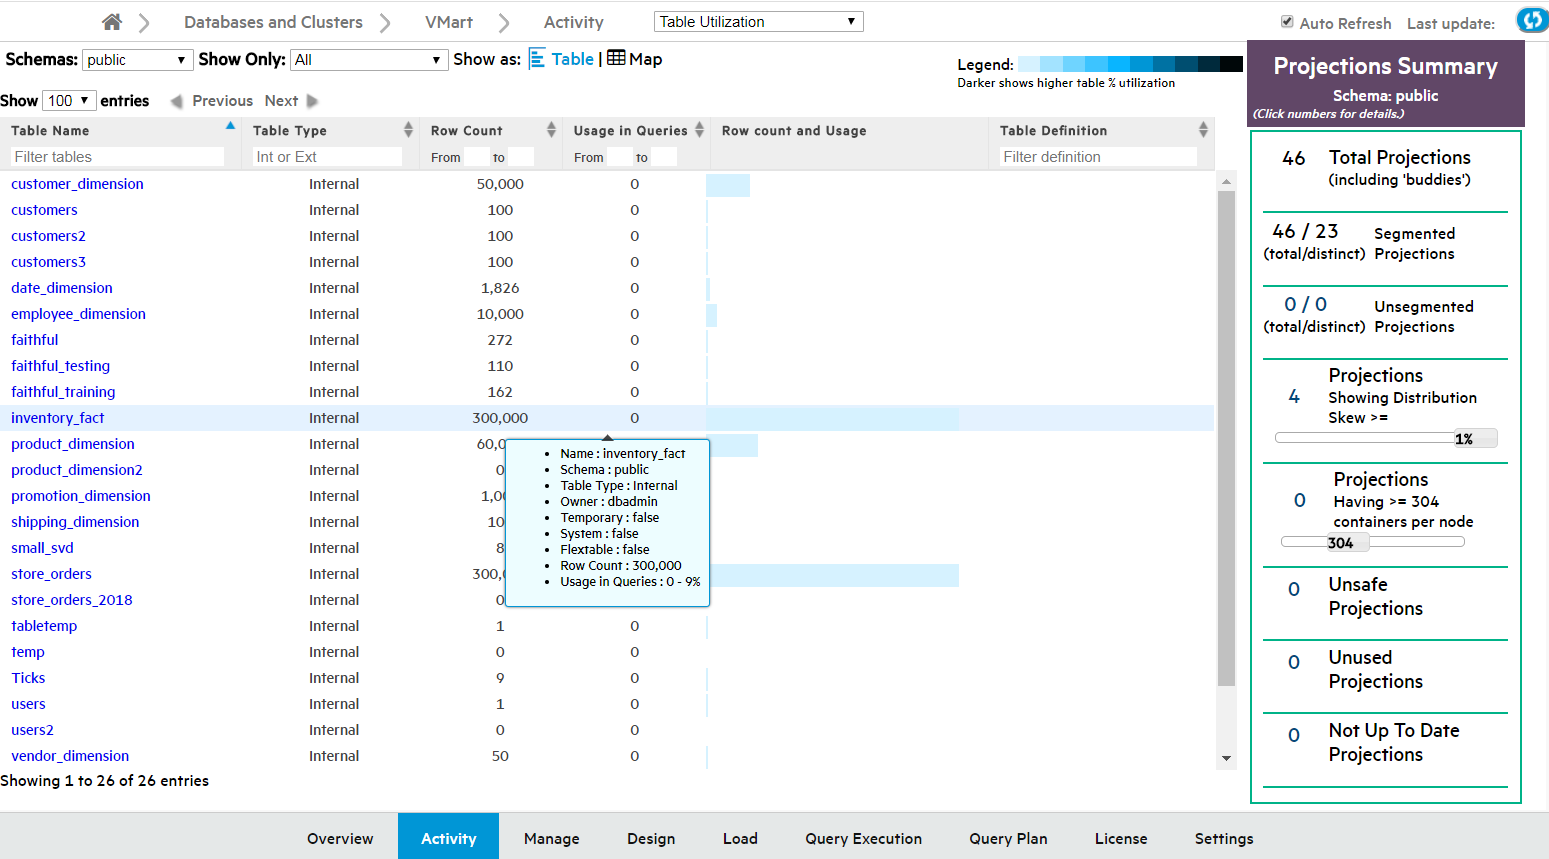
The Table chart is a tabular view of the schema's table data. Use the tabular view to filter or sort on any columns, and view the explicit values for row counts and utilization.
The columns display each table's:
-
Table Name. Click this name to see the Table Details page.
-
Table Type: Internal, Working with external data or HCatalog. (Details such as row count and usage are not available for external and HCatalog types.)
-
Row Count.
-
Usage in Queries, by percentage of time the table is queried.
-
Row count and Usage, visualized as a bar. The length of the bar indicates row count; a darker color indicates higher usage.
-
Table Definition. The COPY statement table definition, only applicable to external tables.
Hover over any row in the chart to view the table's properties (shown for inventory_fact in the screen capture below). Click the table name to view its more in-depth Table Details page.
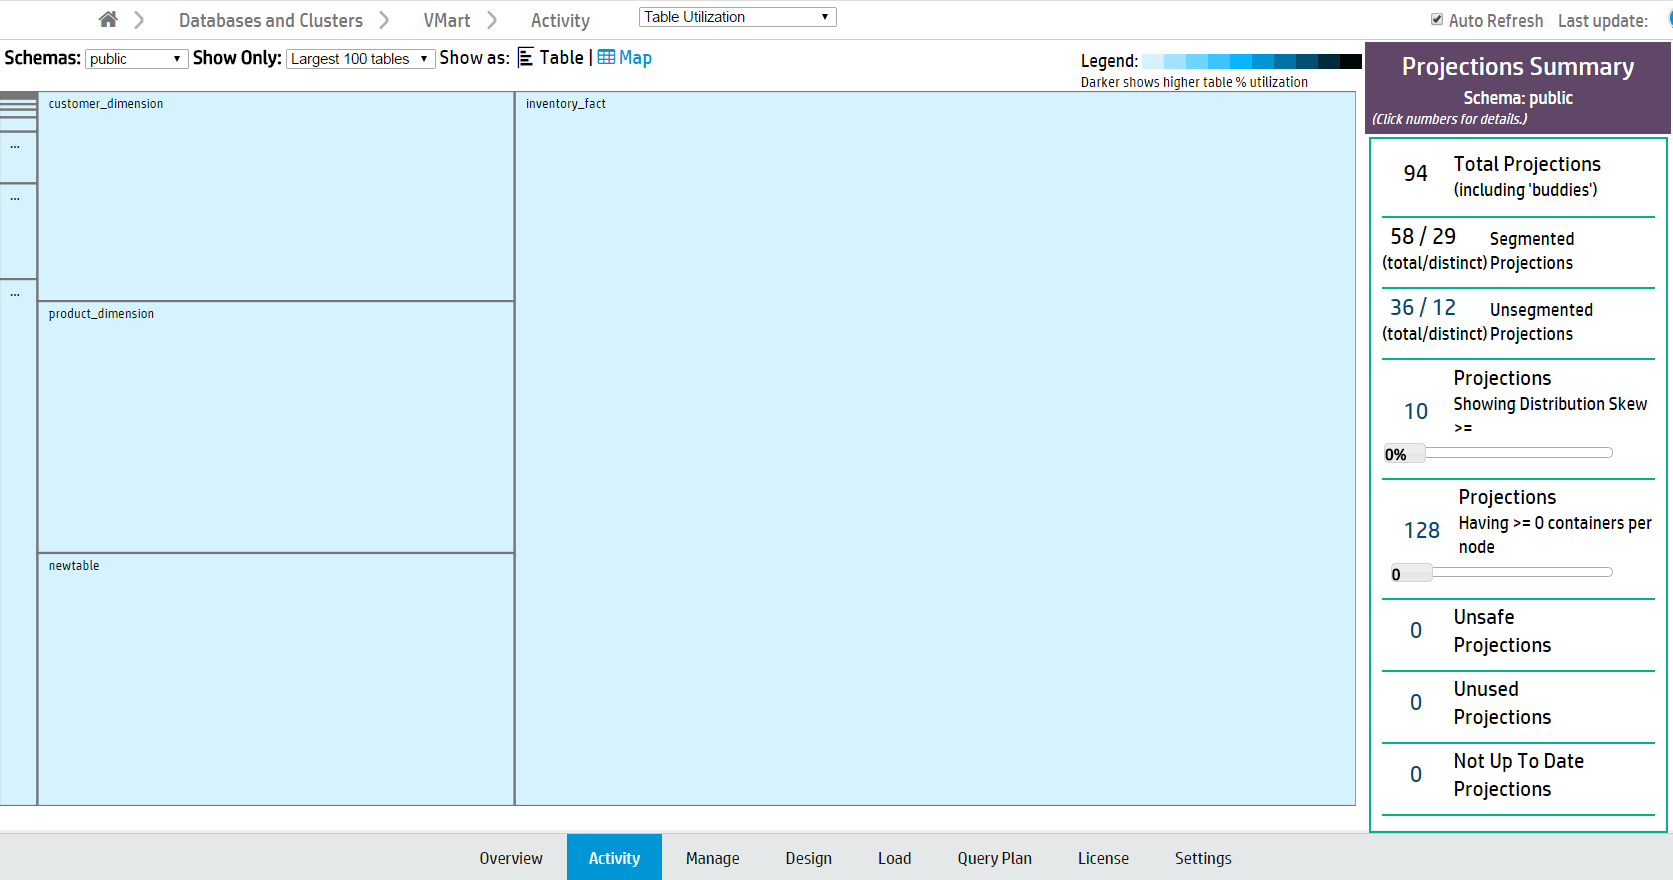
View the treemap chart
In the Treemap visualization, tables are represented by boxes, nested by size and colored by usage. Darker colors indicate higher table usage.
Hover over a table to view more details, or click to view its Table Details page.
View table details
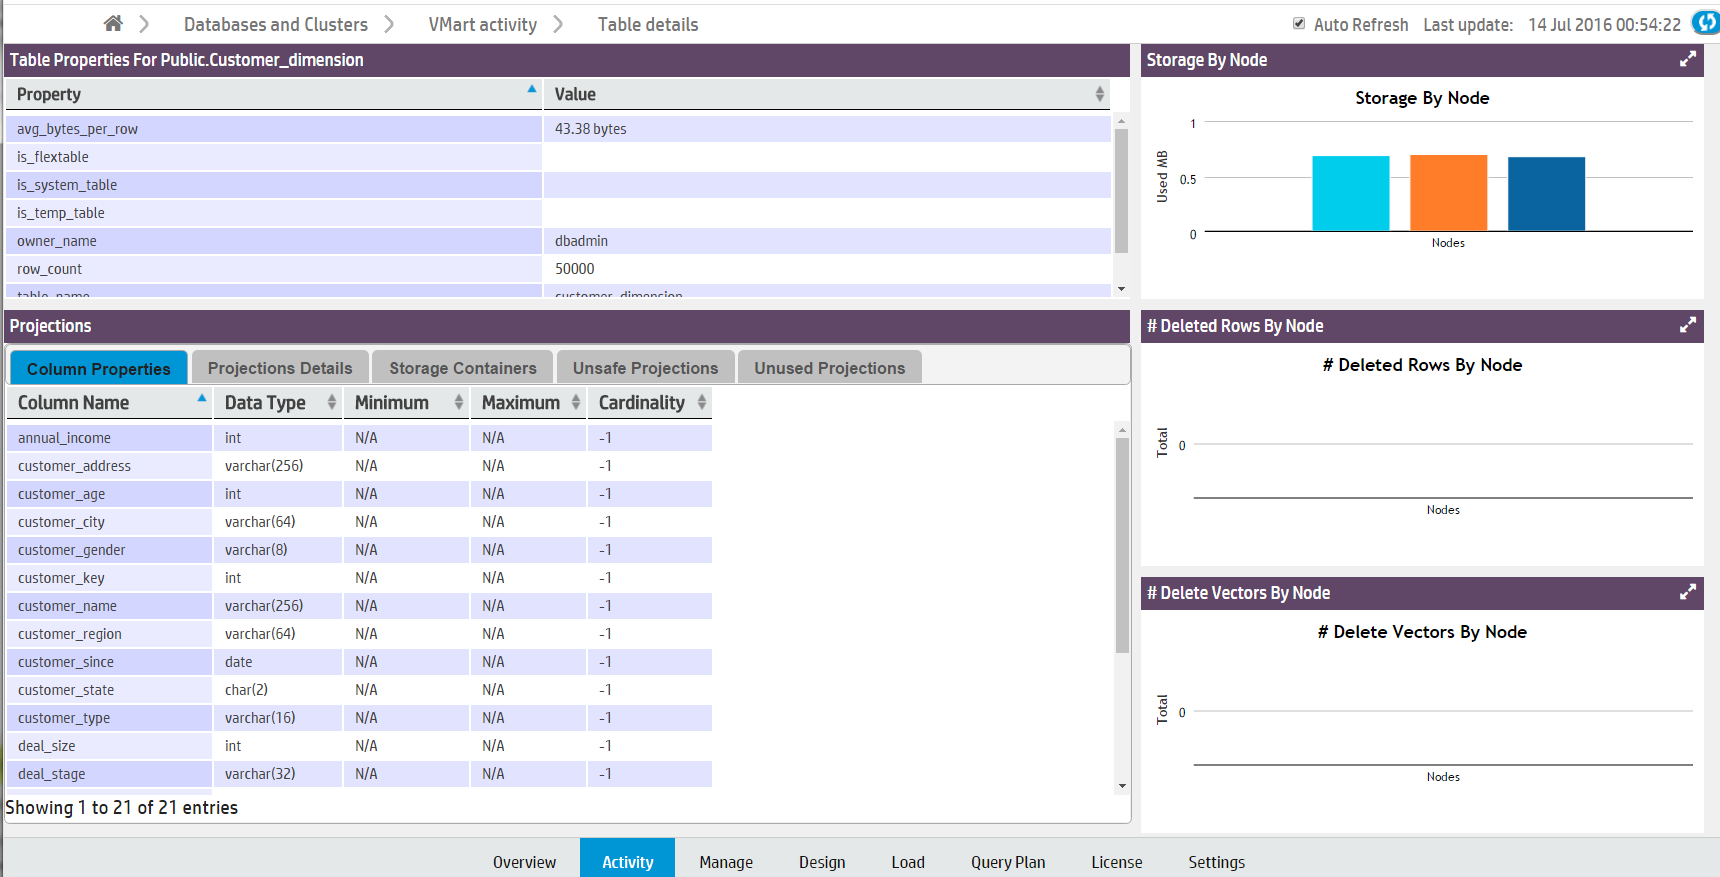
The Table Details page displays a detailed overview of internal Vertica tables. (This is not available for external and HCatalog tables.) Click a table name on the Table Utilization Activity page to open its Table Details page in a new window.
You can view the following details:
-
Table Properties. Table properties (such as row count and owner).
-
Projections. The properties of the table's columns and projections.
-
Storage by Node. The table's storage utilization per node, in MB.
-
# Deleted Rows by Node. Vertica allocates physical storage to deleted rows until they are purged by the Tuple Mover.
-
# Delete Vectors by Node. Vertica creates small containers called delete vectors when DELETE or UPDATE statements run on a table. A large number of delete vectors can adversely impact performance. (See Deletion marker mergeout.)
Note
Note: If you have deleted table rows recently, Management Console may not display the most recent row count. MC updates the row count when mergeout occurs. See
Mergeout.
Projections summary
The Projections Summary is located in a side bar on the right side of the Table Utilization page. It displays the following statistics of all projections in a schema:
-
Total projections.
-
Segmented projections, the number of projections segmented across multiple nodes.
-
Unsegmented projections, the number of projections that are not segmented across multiple nodes.
-
Projections Showing Distribution Skew, the number of projections unevenly distributed across nodes. Tables with fewer than 1000 rows are not counted. Move the slider to configure filter by distribution skew percentage.
-
Projections Having >= Containers Per Node. Move the slider to specify the minimum number of containers.
-
Unsafe Projections, the number of projections with a K-safety less than the database's K-safety.
-
Unused Projections.
-
Not Up to Date Projections.
Click a projections number to view a list of the specified projections and their properties. For more about projections, see Projections.
See also
9.8 - Monitoring running queries with MC
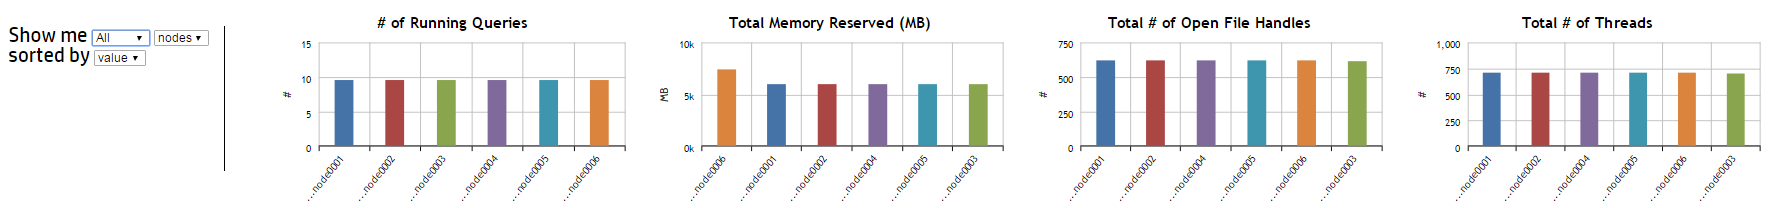
The Query Monitoring activity page displays the status of recent and currently running queries, and resource information by user and node.
The Query Monitoring activity page displays the status of recent and currently running queries, and resource information by user and node. For Eon Mode databases, you can also display the status of queries by subcluster. From this page, you can profile a query or cancel a running query.
Use this page to check the status of your queries, and to quickly cancel running or queued queries to free up system resources. This page can help you identify where resources are being used, and which queries, users, nodes, or subclusters are using the most resources.
The Query Monitoring page includes four tables, displayed as tabs:
-
Running queries
-
Queued queries
-
Completed queries
-
Failed queries
From the Actions column you can:
-
Cancel. Cancel a running or queued query.
-
Close session. Close a session for a running or queued query.
-
Explain. Open the Query Plan page for any query.
-
Profile. Profile any query on the Query Plan page.
The four bar charts at the bottom of the page display aggregate query usage by node or user. Hover over a bar with your cursor to see its value. When sorted by value, the left-most bar in each chart represents the node or user with the highest value.
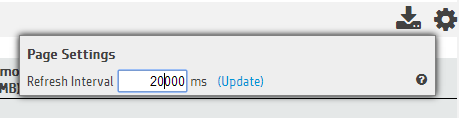
The Query Monitoring page refreshes every 20 seconds by default. To change the refresh interval, click the Page Settings button in the upper-right corner of the page. A dialog appears. Type the new refresh interval, in milliseconds, in the text box.
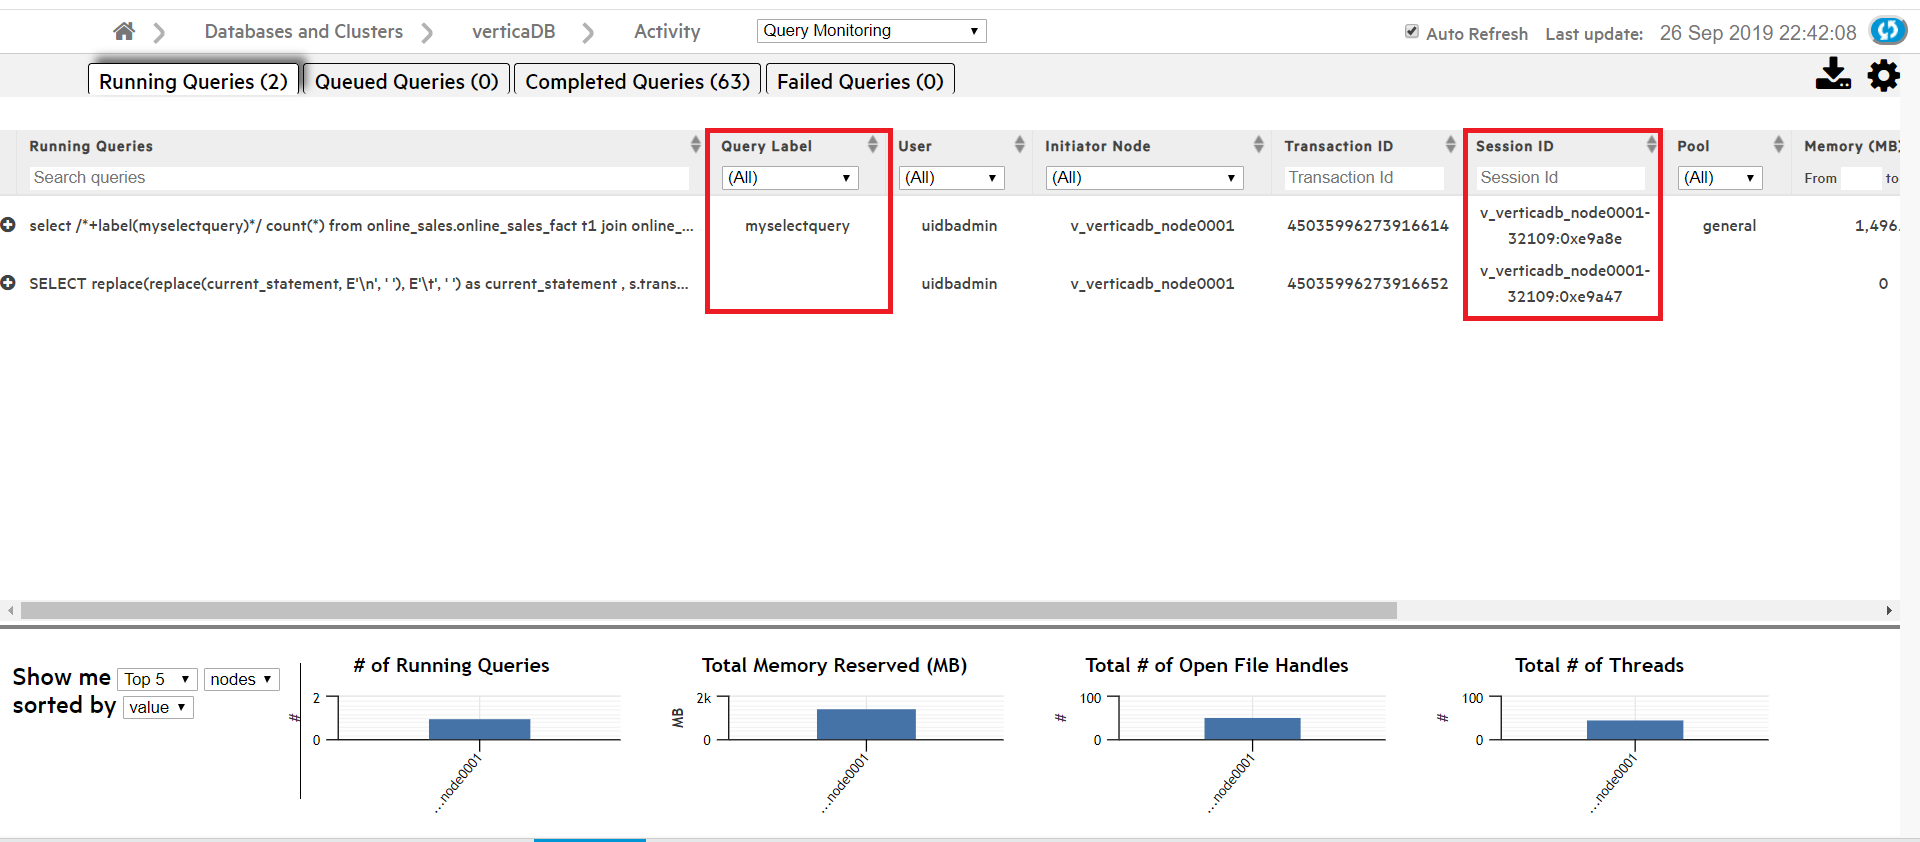
Sorting or searching queries by session ID or client label
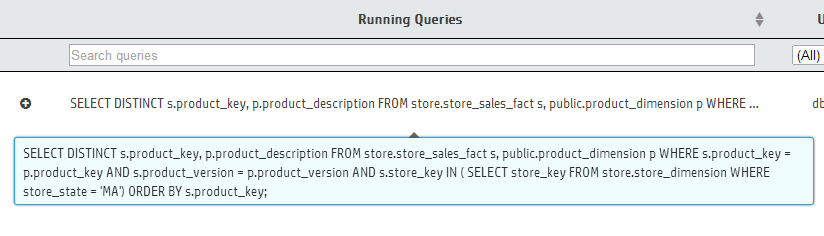
The Query Monitoring Activity > Running Queries page includes columns that display the Session ID and Client Label for each query. You can sort the queries by Session ID or Client Label, or use the search field below either column to search for queries with a specific Session ID or Client Label.
Filtering chart results
Use the search field below each column title to narrow down your chart results. (For example, if you enter the text SELECT product_description in the Search Queries field and select a specific node in the Initiator Node column, the chart returns only queries which both contain that text and were initiated on the node you specified.)
Click a column title to sort the order of the queries by that category.
There may be a large number of results for Completed and Failed Queries. Use the Customize section at the top of these two tabs to further filter your chart results. For either tab, you can select a custom date and time range for your results.
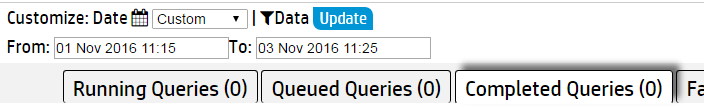
In the Completed Queries tab, click Data to enter additional query information to filter based on any of the following fields:
-
User
-
Request
-
Request Duration
-
Node
-
Request label
Viewing more details
Click a query to view the entire query.
In the Failed Queries chart, click the plus (+) icon next to a failed query to see the failure details for each node involved in the query's execution.
To export the data in one of the Query Monitoring tables, click the table's tab, then click the Export ( ) button in the upper-right corner of the page. The browser downloads the data for that chart in a .dat file. The data exported includes columns that may not be visible in the MC, including the minimum and maximum values for Memory, Thread Count, and Open File Handles.
9.9 - Monitoring catalog memory with MC
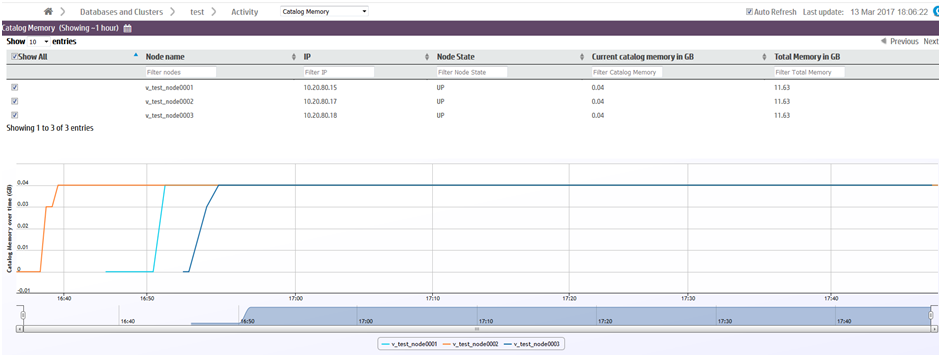
The Catalog Memory activity page displays the catalog memory for each node.
The Catalog Memory activity page displays the catalog memory for each node. Use this page to check for sudden changes in catalog memory, or discrepancies in memory distribution across your nodes.
The Catalog Memory page displays:
-
A node details table. The table lists the details of each node in the database, including their current catalog memory and total memory usage.
-
A catalog memory chart. A line graph visualization of each node's catalog memory usage over time. Each line represents a node. The color legend at the bottom of the chart indicates the color of each node's line.
In the image below, catalog memory begins at 0GB for all three nodes. Over the next twenty minutes, catalog memory increases to 0.04GB in the second node (orange), then the first node (cyan), and finally in the third node (dark blue). Starting at 16:55, note that the three overlapping node lines appear as one line when all three nodes have the same catalog memory.
Filtering chart results
If you have many nodes in your database, you may want to display only certain nodes in the catalog memory chart. You can remove nodes from the chart in two ways:
Viewing more details
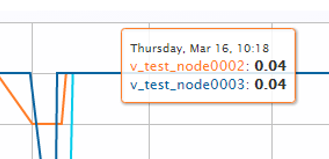
Hover over any line in the chart to view the time, node name, and catalog size.
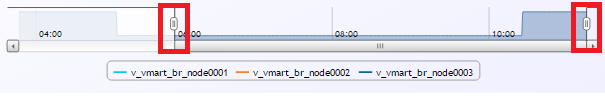
At the bottom of the chart is a summary bar that shows a quick overview of the catalog memory over time. Move the sliders on either side of the chart to zoom in on a specific time frame in the chart. When zoomed in, you can use the scrollbar to move forward or backward in time.
10 - Monitoring resource pools with MC
Management Console allows database administrators to monitor and configure resource pools through the Activity and Configuration pages.
Management Console allows database administrators to monitor and configure resource pools through the Activity and Configuration pages. These pages help you manage workloads by providing visual representations of resource usage as well as resource pool configuration options.
Monitoring resource pools charts
You can monitor your resource pools using the Resource Pools Monitoring charts, accessible through the Management Console Activity page.
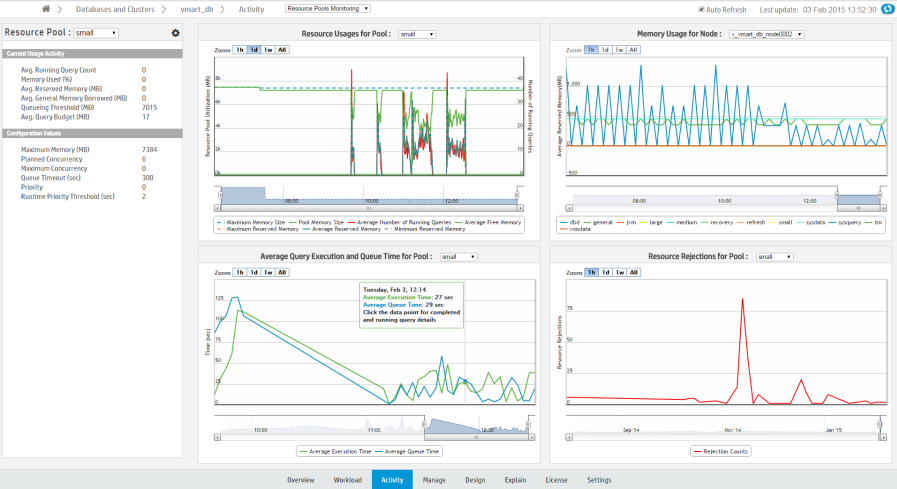
Select a resource pool to view using the Resource Pool menu, located in the leftmost sidebar. In the sidebar, Current Usage Activity displays the pool's real-time statistics.
Monitor the selected resource pool using the following charts, which display the pool's historic data:
-
Resource Usages for Pool: Shows the historically averaged acquired memory usage by each pool across all nodes. The graph uses two y-axes, one that shows memory size, and a second that shows the total number of running queries. Data is collected every hour. Hover over a data point for a summary of the memory usage at that specific point.
-
Memory Usage in Node: Shows the historically acquired memory usages by all pools across all nodes. Data is collected every hour. Hover over a data point for a summary of the memory usage at that specific point. Use the title bar dropdown to display the memory usage for a specific node. For Eon mode databases, you can also display the memory usage for a specific subcluster, all subclusters, or nodes not assigned to a subcluster. An Eon mode database has one default subcluster, and may have additional user-defined subclusters.
-
Average Query Execution and Query Time in Pool: Shows the averaged query queue time plotted against the query execution time by each pool across all nodes. Data is collected every minute. Hover over data to get the average query execution and queue time in the specified pool. Click a data point to show detailed individual query information.
-
Resource Rejections in Pool: Shows the historical total number of resource requests that were rejected in each pool across all nodes. Data is collected every hour. Click a data point to show rejection details and reasons in a pop-up window.
Configuring resource pools in MC
Database administrators can view information about resource pool parameters and make changes to existing parameters through the Management Console Configuration page. You can also create and remove new resource pools, assign resource pool users, and assign cascading pools.
See Configuring Resource Pools in Management Console
Permissions
Only the database administrator can monitor and configure resource pools in Management Console.
See also
10.1 - Configuring resource pools with MC
Database administrators can view information about resource pool parameters and make changes to existing parameters in MC through the Resource Pools Configuration page.
Database administrators can view information about resource pool parameters and make changes to existing parameters in MC through the Resource Pools Configuration page. You can also create and remove new resource pools, assign resource pool users, and assign cascading pools.
Access the Resource Pools Configuration page from the Settings page by selecting the Resource Pools tab.
You can also access the Configuration page from the Resource Pools Monitoring chart, accessible through the Management Console Activity page. Click the tools icon on the top of the leftmost sidebar.
Permissions for monitoring and configuring resource pools
Only the database administrator can monitor and configure resource pools in Management Console.
Modify resource pool parameters
-
On the Resource Pools Configuration page, choose a resource pool from the Resource Pools field. Parameter fields for that resource pool appear.
-
Use the parameter fields to view and modify parameters for the resource pool. Hover your cursor in the parameter field to display information about that parameter.
-
Click Apply to save your changes. A success message appears
Modify resource pool users
To add or remove resource pool users:
-
On the Resource Pools Configuration page, select a resource pool from the Resource Pools field.
-
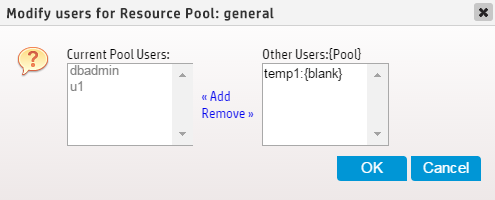
Next to the Pool Users field, click Add/Remove Pool Users. The Modify Users for Resource Pool dialog appears.
-
The dialog displays users assigned to the resource pool in the Current Pool Users list. The Other Users list displays all other resource pool users are displayed, along with the pool to which they are currently assigned.
-
To add users to the resource pool: Select the desired users from Other Users list and click Add.
-
To remove users from the resource pool: Select the users to be removed from the Current Pool Users list and click Remove.
-
Click Apply to save your changes. A success message appears.
Create and remove resource pools
Database administrators can use MC to create resource pools and assign resource pool users, and remove user-generated resource pools.
To create a resource pool:
-
On the Resource Pools Configuration page, click Create Pool. Fields pre-populated with pool parameter default values appear.
-
Enter the new resource pool's parameters in the fields.
-
Click Create Pool. A success message appears.
To remove a resource pool:
-
First, remove all users from the resource pool to be deleted. This can be done on the Resource Pool Configuration Page.
-
When all users have been removed from the resource pool, choose the resource pool from the Resource Pools field on the Resource Pool Configuration Page. Parameter fields for that resource pool appear.
-
Click Remove Pool. A Confirm dialog appears.
-
Click OK in the Confirm dialog. A success message appears.
See also
11 - Monitoring database messages and alerts with MC
Management Console periodically checks system health and performance.
Management Console periodically checks system health and performance. When an important event occurs or system performance fluctuates beyond user- or system-defined limits, the Management Console generates a message to alert you about the state of your system. View and manage alerts in the Message Center.
Message alert notifications
Management Console uses multiple methods to communicate alert notifications to ensure that you are immediately aware of any changes to your database that might require attention. You receive message notifications by email, and you can view notifications using the following components:
-
Message envelope icon: This icon is located by the MC Help icon, in the top-right of any database-specific page. Select this icon display the Message Center quick view, and perform archive, read, and delete message actions. For details about message actions and alerts, see Message center.
-
Unread Messages (This Week) widget: On the database Overview tab, this widget is located in the quick stats sidebar. It displays unread, high-priority messages. Select the number (including 0) in the widget to go to the Message Center.
Management Console provides pre-configured alerts to provide system monitoring capabilities without manual setup. Each alert has a pre-configured threshold that defines the acceptable performance limit, and MC sends a message notification when the database exceeds that threshold.
By default, pre-configured alerts are not active and require minimal initial setup. For details on how to set pre-configured alert properties, see Alert configuration.
Node health
Vertica provides the following pre-configured alerts to monitor node health:
-
Node CPU
-
Node Memory
-
Node Disk Usage
-
Node Disk I/O
-
Node CPU I/O Wait
-
Node Reboot Rate
-
Node State Change
-
Node Catalog Memory
Network health
Vertica provides the Network I/O Error pre-configured alert to monitor network health.
Query
Vertica provides the following pre-configured alerts to monitor queries:
-
Queued Query
-
NumberFailed
-
Query Number
-
Spilled Query Number
-
Retried Query Number
-
Query Running Time
License status
Vertica provides the License Usage pre-configured alert to monitor the status of your Vertica license.
Resource pool
MC can send alerts when an individual resource pool reaches a specified state or usage level. For details about resource pool configuration parameters, see Built-in resource pools configuration.
Important
Default settings for resource pool alerts apply to the GENERAL pool only.
You can configure the MC to send the following resource pool alerts:
-
Queries Reaching the Max Allowed Execution Time: Triggers an alert when the specified number of queries reach the RUNTIMECAP execution threshold for the resource pool. You cannot set this alert if the resource pool does not have a RUNTIMECAP threshold set, or if the resource pool has a secondary resource pool.
-
Queries With Resource Rejections: Triggers an alert when the specified number of queries exceed a specified number of resource rejections within a set period of time.
-
Minimum Starting Resource Value: Triggers an alert when the resource pool reaches the minimum amount of resources allocated for the MEMORYSIZE value.
Note
By default, you cannot set MEMORYSIZE for the GENERAL pool. The GENERAL pool must have at least 1GB of memory and it cannot be smaller than 25% of the entire system memory.
-
Maximum Allowed Resource Value: Triggers an alert when the resource pool reaches the MAXMEMORYSIZE value.
-
Ended Query With Queue Time Exceeding Limit: Triggers an alert when the specified number of completed queries were queued for a specified length of time within a timeframe.
-
Ended Query With Run Time Exceeding Limit: Triggers an alert when the specified number of completed queries ran for a specified length of time within a timeframe.
Custom alerts
Create custom alerts to measure system performance metrics that are not monitored by the pre-configured alerts. Create a dynamic SQL query that triggers an alert when it returns any results. You can configure how often an alert is generated, the alert priority, and who receives email alerts. For example, you can create custom alerts that monitor the following:
For details about creating and managing custom alerts, including a tutorial on how to create a custom alert that monitors failed logins, see Custom alerts.
Default notifications
Management Console generates the following messages about the database that appear only in the Message Center:
-
Low disk space
-
Read-only file system
-
Loss of K-safety
-
Current fault tolerance at critical level
-
Too many ROS containers
-
Change in node state
-
Recovery error
-
Recovery failure
-
Recovery lock error
-
Recovery projection retrieval error
-
Refresh error
-
Refresh lock error
-
Workload analyzer operations
-
Tuple Mover error
-
Timer service task error
-
Last Good Epoch (LGE) lag
-
License size compliance
-
License term compliance
Disk space check and cleanup
When the Management Console checks alerts, it generates a result set and saves it to disk. If you use aggressive alert configurations, the result set might use a large amount of disk space. By default, Vertica reserves 500MB of disk space to save result sets.
Vertica checks the free disk space 2 times each day and cleans alerts that are older than 7 days. If the available disk space is low, custom alerts are disabled. Notifications and emails are generated when an alert is disabled due to insufficient disk space.
The /opt/console/vconsole/config/console.properties file contains these settings. Edit the following values to configure the how the MC manages your disk space:
|
Property |
Description |
console.diskspace.threshold |
The amount of disk space Vertica reserves to save result sets.
Default: 500MB
|
customthreshold.alerts.toKeepInDays |
The number of days that alerts are retained on disk.
Default: 7
|
11.1 - Message center
The Message Center organizes system performance alerts to help you effectively monitor the state of your database.
The Message Center organizes system performance alerts to help you effectively monitor the state of your database. Pre-configured and custom alerts generate messages when the component they measure exceeds the specified threshold.
Access the Message Center in the following ways:
-
On the MC Home page, select Message Center in the MC Tools section.
-
Select the message envelope icon in the top-right of any database-specific page, then select Message Center in the quick view.
-
On the database Overview tab, select the number (including 0) in the Unread Messages (This Week) widget.
The Message Center can retrieve up to 10,000 of the most recent messages generated for a database. By default, it lists up to 600 messages generated in the previous week. For details on how to retrieve messages that predate the previous week, see Date Filtering.
Note
To adjust the maximum number of messages listed in the Message Center, edit the messageCenter.maxEntries value in the /opt/vconsole/config/console.properties file from the command line. For example, the following value increases the number of alerts listed in the Message Center to 5000:
messageCenter.maxEntries=5000
Filter the messages grid
The Management Console provides options that filter the messages that populate the messages grid by database, keyword, message type, and date. Use one or more of these options to view only the messages that you want to manage.
Database filtering
Select Showing to list the databases that are associated with the logged in user account. Choose a specific database to view only messages for that database, or select (All DBs) to view and manage messages across all of your databases.
Keyword filtering
Use the search bar at the top-right of the screen to list messages that contain the entered text. For example, if you enter 29, the grid lists any messages that contain those characters within the message title or message details available when you click the plus (+) icon to expand the message row.
Message type filtering
After you select a value for Showing, the number of messages for that value are totaled and grouped by type near the top-right corner of the screen, below the search bar. These message types use the syslog standard to define severity levels. The MC message types are defined as follows:
-
All Messages: Messages that are not archived or deleted, and are within messageCenter.maxEntries for the previous week.
-
High Priority: Messages that you assigned a High Priority alert priority on the Alerts tab. These messages correspond to syslog levels 0 and 1.
-
Need Attention: Critical or error messages that indicate that correspond to syslog levels 2 and 3.
-
Informational: Warning, notice, informational, or debugging messages that correspond to syslog levels 4, 5, 6, and 7.
To populate the grid with only a single message type, select the number or message type description.
Date filtering
Select Retrieve Older Messages to enter From and To dates to list messages that were generated before the previous week. Vertica stores 10,000 of the most recent database messages so that you can retrieve older messages when necessary.
Message groups
The Message Center groups messages and notifications as Recent Messages, Threshold Messages, and Archived Messages. All message groups use the following priority levels and color codes:
-
Critical (Red)
-
Warning (Orange)
-
Notice (Green)
-
Info (Blue)
Recent messages and threshold messages
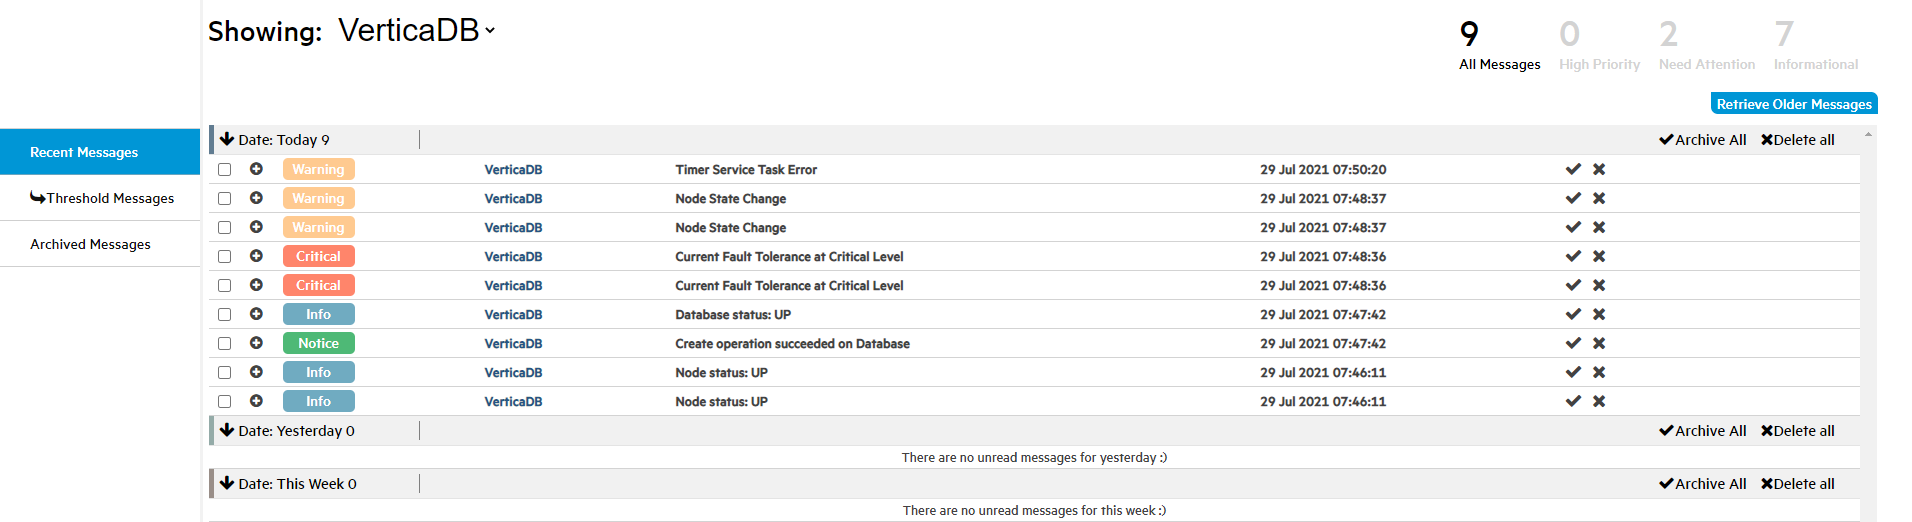
Recent Messages include the most recent messages generated within the previous week within the messageCenter.maxEntries value. Threshold messages include messages that are generated when the database exceeds a pre-configured, custom, or default alert threshold.
Recent Messages and Threshold Messages are listed using the message type, database name, a description of the message, and the date and time that the message was generated. Additionally, there are collapsible grid headings that group the alerts by Today, Yesterday, and This Week.
Archived messages
Archived messages are messages that you manually saved for later. When you select the check icon for an individual message or select Archive All, MC marks the message as read and archives it. Archived messages do not have the same date or messageCenter.maxEntries restrictions as Recent Messages or Threshold Messages.
The Archived Messages tab contains the following tools to refine search result filters:
-
Use the From and To boxes above the grid to define a time frame for the archived message search. To combine multiple time frames, select the Do not clear existing search results checkbox.
-
Sort or filter messages even further using the Type, Database Name, Description, and Date columns.
Message actions
Perform actions on all, multiple, or individual messages. To execute actions on all messages at the same time, use the Select All or Select None buttons near the top-right of the screen by the search bar.
Each message row has a checkbox so that you can perform actions on one or more messages simultaneously. Select the plus (+) icon to expand the message row and display the following message details:
For additional information about each message, query EVENT_CONFIGURATIONS.
When you select the X icon or select multiple messages and click the Delete Msgs or Delete all buttons, the message is permanently deleted.
11.2 - Alert configuration
Enable and customize settings for pre-configured or custom alerts for each database.
Enable and customize settings for pre-configured or custom alerts for each database. For example, you can set the Threshold Value for Node Disk Usage to a 20% minimum or 80% maximum. If any node exceeds either of those thresholds, the MC generates a message and you receive a notification. Take action on alerts in the Message center.
To access the Alerts tab, log in to the Management Console, then select Go to database > Settings > Alerts.
Configurable settings
To configure any alert, you must toggle the switch on the left of the row to the on position. Node State Change is the only pre-configured alert turned on by default. By default, custom alerts are toggled off.
Pre-configued and custom alerts have the following settings:
-
Query variables: Custom alerts only. Query variables are the variables that you added when you created the alert. You must provide a value for each variable. The query variable is not validated after you create the alert. If you update the variable to a value that results in an invalid query, the alert is silently disabled during the next execution.
To view the original SQL query, hover the mouse over the alert name to display the alert in a tooltip.
-
Threshold Value: Pre-configured alerts only. You can add a lower and upper limit on acceptable operating values for the component.
-
Check Interval: This value determines how often Vertica executes the underlying SQL for the alert.
-
Alert Priority: You can assign one of the following priority labels to determine how the alert is distributed:
-
Alert and Critical: Displays the message using the message alert notification mechanisms on the Overview page and creates a message in the Message Center.
-
Warning: Creates a message in the Message center.
-
Alert Email Recipients: Configure email notifications for any alert priority when the alert is triggered. You must have SMPT configured. For details about adding email recipients to alerts, see Custom alerts.
-
Vertical ellipses: For custom alerts and new resource pool alerts, click the vertical ellipses to delete the alert. You must have MC ADMIN role privileges to delete an alert.
Configuring resource pool alerts
Resource pool alerts use the same configurable settings as the other alerts, but you can set alerts per resource pool. By default, pre-configured alerts are set for the GENERAL pool only.
Note
Only users with
MC ADMIN role privileges can add alerts for resource pools other than the GENERAL pool.
-
Log in to the Management Console and select Databases > Settings > Alerts.
-
In the top row labeled Resource Pool, select the blue box with a plus (+) symbol on the far right of the row. When you hover over the button, the button expands and displays Add Resource Pool Alert +.
The New Resource Pool Alert window opens.
-
In Alert Name, choose the alert that you want to add to a resource pool.
-
In Resource Pool, choose the resource pool that you want to add this alert to.
-
When you are finished configuring the remaining settings, select Create Alert.
Edit Check Interval, Alert Priority, and Alert Email Recipients as you would other alerts. For guidance, see Configurable Settings or Custom alerts.
To delete the alert, select the vertical ellipses at the right of the row, and select Delete. You must have MC ADMIN role privileges to delete an alert.
11.3 - Setting up SMTP for email alerts
Management Console can generate email notifications when your database exceeds high-priority alert thresholds.
Management Console can generate email notifications when your database exceeds high-priority alert thresholds. To receive email alerts, you must configure your SMTP settings in MC.
You must be an administrator to provide SMTP settings. To set up MC to send email:
-
Select the Email Gateway tab on the MC Settings page.
-
Provide the following information about your SMTP server:
-
Email Server (Hostname): the hostname or IP of the SMTP server
-
Port: the port of the SMTP server
-
Session Type: the type of connection to use (e.g. SSL)
-
SMTP Username (optional): the username credential for connecting to the server
-
SMTP Password (optional): the password credential for connecting to the server
-
Sender Address: The sender address for your server when it sends email alerts
-
Trust SSL Certificate: Whether to automatically trust the SMTP server's certificate
-
Click Test at the top of the page. MC validates your SMTP settings and sends a test email to the inbox of the email alias you provided.
-
Verify that you successfully received the test email.
-
Click Apply at the top-right of the page to save the settings.
After you set up SMTP for email, you can configure MC to send high-priority threshold alerts through email. For details, seeAlert configuration or Custom alerts.
11.4 - Custom alerts
Create custom events-based alerts to track abnormalities and performance fluctuations for node health, queries, and resource pools using your own database schemas and tables.
Create custom events-based alerts to track abnormalities and performance fluctuations for node health, queries, and resource pools using your own database schemas and tables. When the database triggers an active alert, you receive notifications according to the alert priority, and can take action in the Message center.
Creating a custom alert
You must have MC ADMIN role privileges to create a custom alert.
The following steps create a custom alert named Failed logins within a X time period to track the number of failed logins in the previous two hours, per user. This alert might indicate a possible distributed denial-of-service (DDoS) attack, or an application behaving inappropriately. The underlying SQL query uses a variable to create a dynamic threshold value that you can fine-tune after you create the alert.
-
Log in to the Management Console, then select Go to database > Settings > Alerts.
-
In the Custom Alerts row at the top of the page, click the blue box with a plus (+) symbol on the far right of the row. When you hover over the button, the button expands and displays Create Custom Alert +.
The Create custom alert window displays.
-
In Alert Name, enter Failed logins within X time period.
-
In SQL Query, enter the following SQL query:
SELECT
  login_timestamp,
  user_name,
  node_name,
  client_hostname,
  reason
FROM
  login_failures
WHERE
  reason in ('INVALID USER', 'FAILED', 'INVALID DATABASE')
  AND login_timestamp > sysdate - INTERVAL '{{Time_Interval}}'
The AND clause of the preceding query encloses the variable of type String named Time_Interval in double curly braces to represent a valid SQL syntax element.
A variable is a dynamic value that is evaluated at runtime that you can configure after you save the alert. You can add up to 6 variables per custom alert. Variable names may consist of a maximum of 14 alpha-numeric characters, including underscores. Verify that the variable uses the correct data type and format. Variables of type String require single quotes around the curly braces.
A SQL query triggers an alert if it returns one or more rows. Use the formatting or full screen buttons above and to the right of the SQL Query box as needed.
-
A box displays below the SQL Query box containing placeholder text that corresponds to each variable name. To test the alert, enter 2 Hours in this box.
-
Select Run Query. The Query Results section displays any rows returned from your query. Alternatively, you might encounter one of the following issues:
-
If you use invalid SQL syntax, you receive an error.
-
If the query returns more than 5 columns or 100 rows, you receive a warning. Because every query result set is saved to disk, it is important to be aware of the size of your result set. For more information, see Monitoring database messages and alerts with MC.
A long-running query runs until it succeeds or returns a Query Error that indicates that there are insufficient resources to continue. To stop a long-running query, select Cancel Query.
-
When you are satisfied with the query results, select Create Alert.
The Create custom alert window closes and the alert you just created is listed in the Custom Alerts section on the Alerts page. When you point the mouse on the query name, the query is displayed in a tooltip. Under the query name, there are editable boxes that correspond to the variables you added when creating the alert.
-
In the Time_Interval variable box, enter 2 Hours.
-
Select a value for Check Interval. The default setting is 10 minutes. This value determines how often the query is executed.
Important
To prevent the scheduled query from impacting system performance, each query has a default runtime threshold of 30 seconds. If the query runtime exceeds this threshold once, the alert is automatically disabled.
To adjust the timeout threshold, edit the threshold_query.disable_time_out setting in the /opt/vconsole/config/console.properties file.
-
Select a value for Alert Priority. By default, the alert is assigned the Critical value priority.
-
Optionally, select the Manage Emails icon under Alert Email Recipients to send an email alert to specific users when the alert is triggered. To register a user to receive email alerts, complete the steps in Setting up SMTP for email alerts.
-
Complete the following steps in the Manage Email Recipient window:
-
To add an existing user to an alert, click the checkbox beside the existing MC user, or select the box at the top to add all. For non-existing MC users, enter their email address at the bottom of the window.
-
In Email Interval, select how often the email is sent:
For example, if you select One hour, an email is sent every hour, even if the alert is triggered multiple times within the hour.
-
Click Save.
After you create the alert, toggle it on or off using switch at the far left of the alert row.
Editing a custom alert
You must have MC ADMIN role privileges to edit a custom alert.
-
Log in to the Management Console, then select Go to database > Settings > Alerts.
-
In the Custom Alerts row at the top of the page, locate the custom alert that you want to edit.
-
Select the vertical ellipses, and select Edit.
The Edit custom alert window opens and displays the previously saved values for the custom alert.
-
Edit the alert. You can edit any of the following alert properties:
-
Alert Name
-
SQL Query
-
Any variable values
-
Select Run Query. The Query Results section displays any rows returned from your query. Alternatively, you might encounter one of the following issues:
-
If you use invalid SQL syntax, you receive an error.
-
If the query returns more than 5 columns or 100 rows, you receive a warning. Because every query result set is saved to disk, it is important to be aware of the size of your result set. For more information, see Monitoring database messages and alerts with MC.
A long-running query runs until it succeeds or returns a Query Error that indicates that there are insufficient resources to continue. To stop a long-running query, select Cancel Query.
-
When you are satisfied with the query results, select Update Alert.
Deleting an alert
To delete a custom alert, select the vertical ellipses at the right of the row, and select Delete. You must have MC ADMIN role privileges to delete an alert.
11.5 - Exporting MC-managed database messages and logs
You can export the contents of database messages, log details, query details, and MC user activity to a file.
You can export the contents of database messages, log details, query details, and MC user activity to a file.
Information comes directly from the MC interface. This means that if the last five minutes of vertica.log information displays on the interface, you can save that five minutes of data to a file, not the entire log. When you filter messages or logs, MC exports only the filtered results.
Depending on how you set your browser preferences, when you export messages you can view the output immediately or specify a location to save the file. System-generated file names include a timestamp for uniqueness.
The following table shows, by record type, the MC pages that contain content you can export, the name of the system-generated file, and what that file's output contains:
|
Message type |
Where you can export on MC |
System-generated filename |
Contents of exported file |
|
All db-related message types |
Message Center page |
vertica-alerts-<timestamp>sv |
Exports messages in the Message Center to a .csv file. Message contents are saved under the following headings:
|
|
MC log files |
Diagnostics page |
mconsole-<timestamp>.log |
Exports MC log search results from MC to a ** .log file under the following headings:
|
|
Vertica logs |
Manage page
Double-click any node to get to the details and then click the VerticaLog tab
|
vertica-vertica-<db>-<timestamp>.log |
Exports vertica log search results from MC to a .log file under the following headings:
|
|
Agent logs |
Manage page
Click any node to get to the details and then click the AgentTools Log tab.
|
vertica-agent-<db>-<timestamp>.log |
Exports agent log search results from MC to a .log file under the following headings:
|
|
Query details |
Activity page
Click any query spike in the Queries graph to get to the Detail page.
|
vertica-querydetails-<db>-<timestamp>.dat |
Exports query details for the database between <timestamp> and <timestamp> as a tab-delimited .dat file. Content is saved under the following headings:
-
Query type
-
Session ID
-
Node name
-
Started
-
Elapsed
-
User name
-
Request/Query
|
|
MC user activity |
Diagnostics page
Click the Audit Log task
|
vertica_audit<timestamp>.csv |
Exports MC user-activity results to a .csv file. Content is saved under the following headings:
-
Time
-
MC User
-
Resource
-
Target User
-
Client IP
-
Activity
|
12 - Monitoring MC user activity using audit log
When an MC user makes changes on the MC interface, whether to an MC-managed database or to the MC itself, their action generates a log entry that records a timestamp, the MC user name, the database and client host (if applicable), and the operation the user performed.
When an MC user makes changes on the MC interface, whether to an MC-managed database or to the MC itself, their action generates a log entry that records a timestamp, the MC user name, the database and client host (if applicable), and the operation the user performed. You monitor user activity on the Diagnostics > Audit Log page.
MC records the following types of user operations:
-
User log-on/log-off activities
-
Database creation
-
Database connection through the console interface
-
Start/stop a database
-
Remove a database from the console view
-
Drop a database
-
Database rebalance across the cluster
-
License activity views on a database, as well as new license uploads
-
Workload analyzer views on a database
-
Database password changes
-
Database settings changes (individual settings are tracked in the audit record)
-
Syncing the database with the cluster (who clicked Sync on grid view)
-
Query detail viewings of a database
-
Closing sessions
-
Node changes (add, start, stop, replace)
-
User management (add, edit, enable, disable, delete)
-
LDAP authentication (enable/disable)
-
Management Console setting changes (individual settings are tracked in the audit record)
-
SSL certificate uploads
-
Message deletion and number deleted
-
Console restart from the browser interface
-
Factory reset from the browser interface
-
Upgrade MC from the browser interface
Background cleanup of audit records
An internal MC job starts every day and, if required, clears audit records that exceed a specified timeframe and size. The default is 90 days and 2K in log size. MC clears whichever limit is first reached.
You can adjust the time and size limits by editing the following lines in the /opt/vconsole/config/console.properties file:
vertica.audit.maxDays=90vertica.audit.maxRecords=2000
Filter and export results
You can manipulate the output of the audit log by sorting column headings, scrolling through the log, refining your search to a specific date/time and you can export audit contents to a file.
If you want to export the log, see Exporting the user audit log.
If you perform a factory reset on MC's Diagnostics page (restore it to its pre-configured state), MC prompts you to export audit records before the reset occurs.
13 - Monitoring external data sources with MC
By default, Management Console monitors a database using information from that database's Data Collector (DC) tables.
By default, Management Console monitors a database using information from that database's Data Collector (DC) tables. MC can also monitor DC tables you have copied into Vertica tables, locally or remotely.
MC administrators provide mappings to local schemas or to an external database containing the corresponding DC data. MC can then render its charts and graphs from the new repository instead of from local DC tables. This offers the benefit of loading larger sets of data faster in MC, and retaining historical data long term.
Note
Note: MC also offers
External Monitoring, which allows you to set up a Vertica storage database through the MC interface, then use Kafka to stream your data to the storage database. You can use the Data Source mapping process below if you prefer to set up your own alternative data source, or do not plan to use Kafka streaming.
Map an alternative data source
-
On the MC Settings page, navigate to the Data Source tab.
-
Select the database for which you are creating the data source mapping.
-
Choose the database user for which you want to create the mapping.
-
Set Repository Location to Local or Remote.
-
If Remote is selected, provide JDBC connection parameters for the remote database repository. Click Validate Connection Properties to confirm a successful connection.
-
Enter the schema mappings for v_internal and v_catalog. MC does not support mapping the v_monitor schema.
-
Input your table mappings in one of the following ways:
-
Click Auto Discover. MC retrieves the table mappings based on the database and schema mappings you provided.
-
Click Manual Entry. Manually input table mappings.
-
Click Load Configurations. If you previously saved a data source configuration for the database in a file, import the file to use that configuration for the currently selected user.
-
Optionally, click Save Configurations to export this configuration file. You can create a mapping for another database user with this configuration file later.
-
Click Apply to save and apply your configuration settings.
Reports using unmapped schemas
If a report in MC needs to access a locally stored schema or table that is unmapped, MC includes information from the local DC tables for that schema to complete the report.
For remote configurations, if a report depends on an unmapped schema or table, the entire report is run against the local DC tables. If the remote database is down when MC attempts to run a report against it, MC reruns the report against the local database.
When the MC runs a report, it records missing mappings in the MC log under the INFO severity level.
14 - Monitoring depot activity with MC
The depot is a cache-like component on each node that downloads and stores local copies of table data.
The depot is a cache-like component on each node that downloads and stores local copies of table data. Queries that can access the data that they need on the depot, instead of fetching it from communal storage, generally execute much faster. If your database is in Eon Mode, you can use the Depot Activity page to view depot settings and evaluate how efficiently it handles queries and load activity.
To view depot settings and activity, navigate to Database > Activity > Depot Activity Monitoring. The Depot Activity page has the following tabs:
14.1 - Why monitor the depot?
If you run an Eon Mode database on a cloud platform such as AWS, monitoring your depot in MC can help you tune performance and reduce expenses.
If you run an Eon Mode database on a cloud platform such as AWS, monitoring your depot in MC can help you tune performance and reduce expenses. MC can help address the following questions:
To access depot monitoring capabilities: from the MC home page, navigate to Database > Activity > Depot Activity Monitoring. See Monitoring depot activity with MC.
How often do queries hit the depot versus the S3 bucket?
Queries run faster when they access node-based depot data rather than fetch it from communal storage. For details, see Query Depot Hits and Misses
Is the depot optimally sized?
To optimize your queries for speed, you might want to resize the depot to fit your query workload. This ensures that queries do not need to spend extra time fetching data from the communal repository on S3. The Eon meta-function ALTER_LOCATION_SIZE lets you change depot size on one node, all nodes in a subcluster, or all nodes in the database. The following statement resizes all depots in the database to 80MB:
=> SELECT alter_location_size('depot', '','80%');
 alter_location_size
---------------------
 depotSize changed.
(1 row)
On the Depot Activity Monitoring screen, in the Communal Storage Access Calls chart, MC displays how many of each type of API call your queries executed in a given timespan. To see details on which queries were running, click on any point on the chart.
What is the current depot usage on each node?
The Depot Content tab of the Depot Activity Monitoring page provides detailed information about how each table is using the depot space on the cluster nodes.
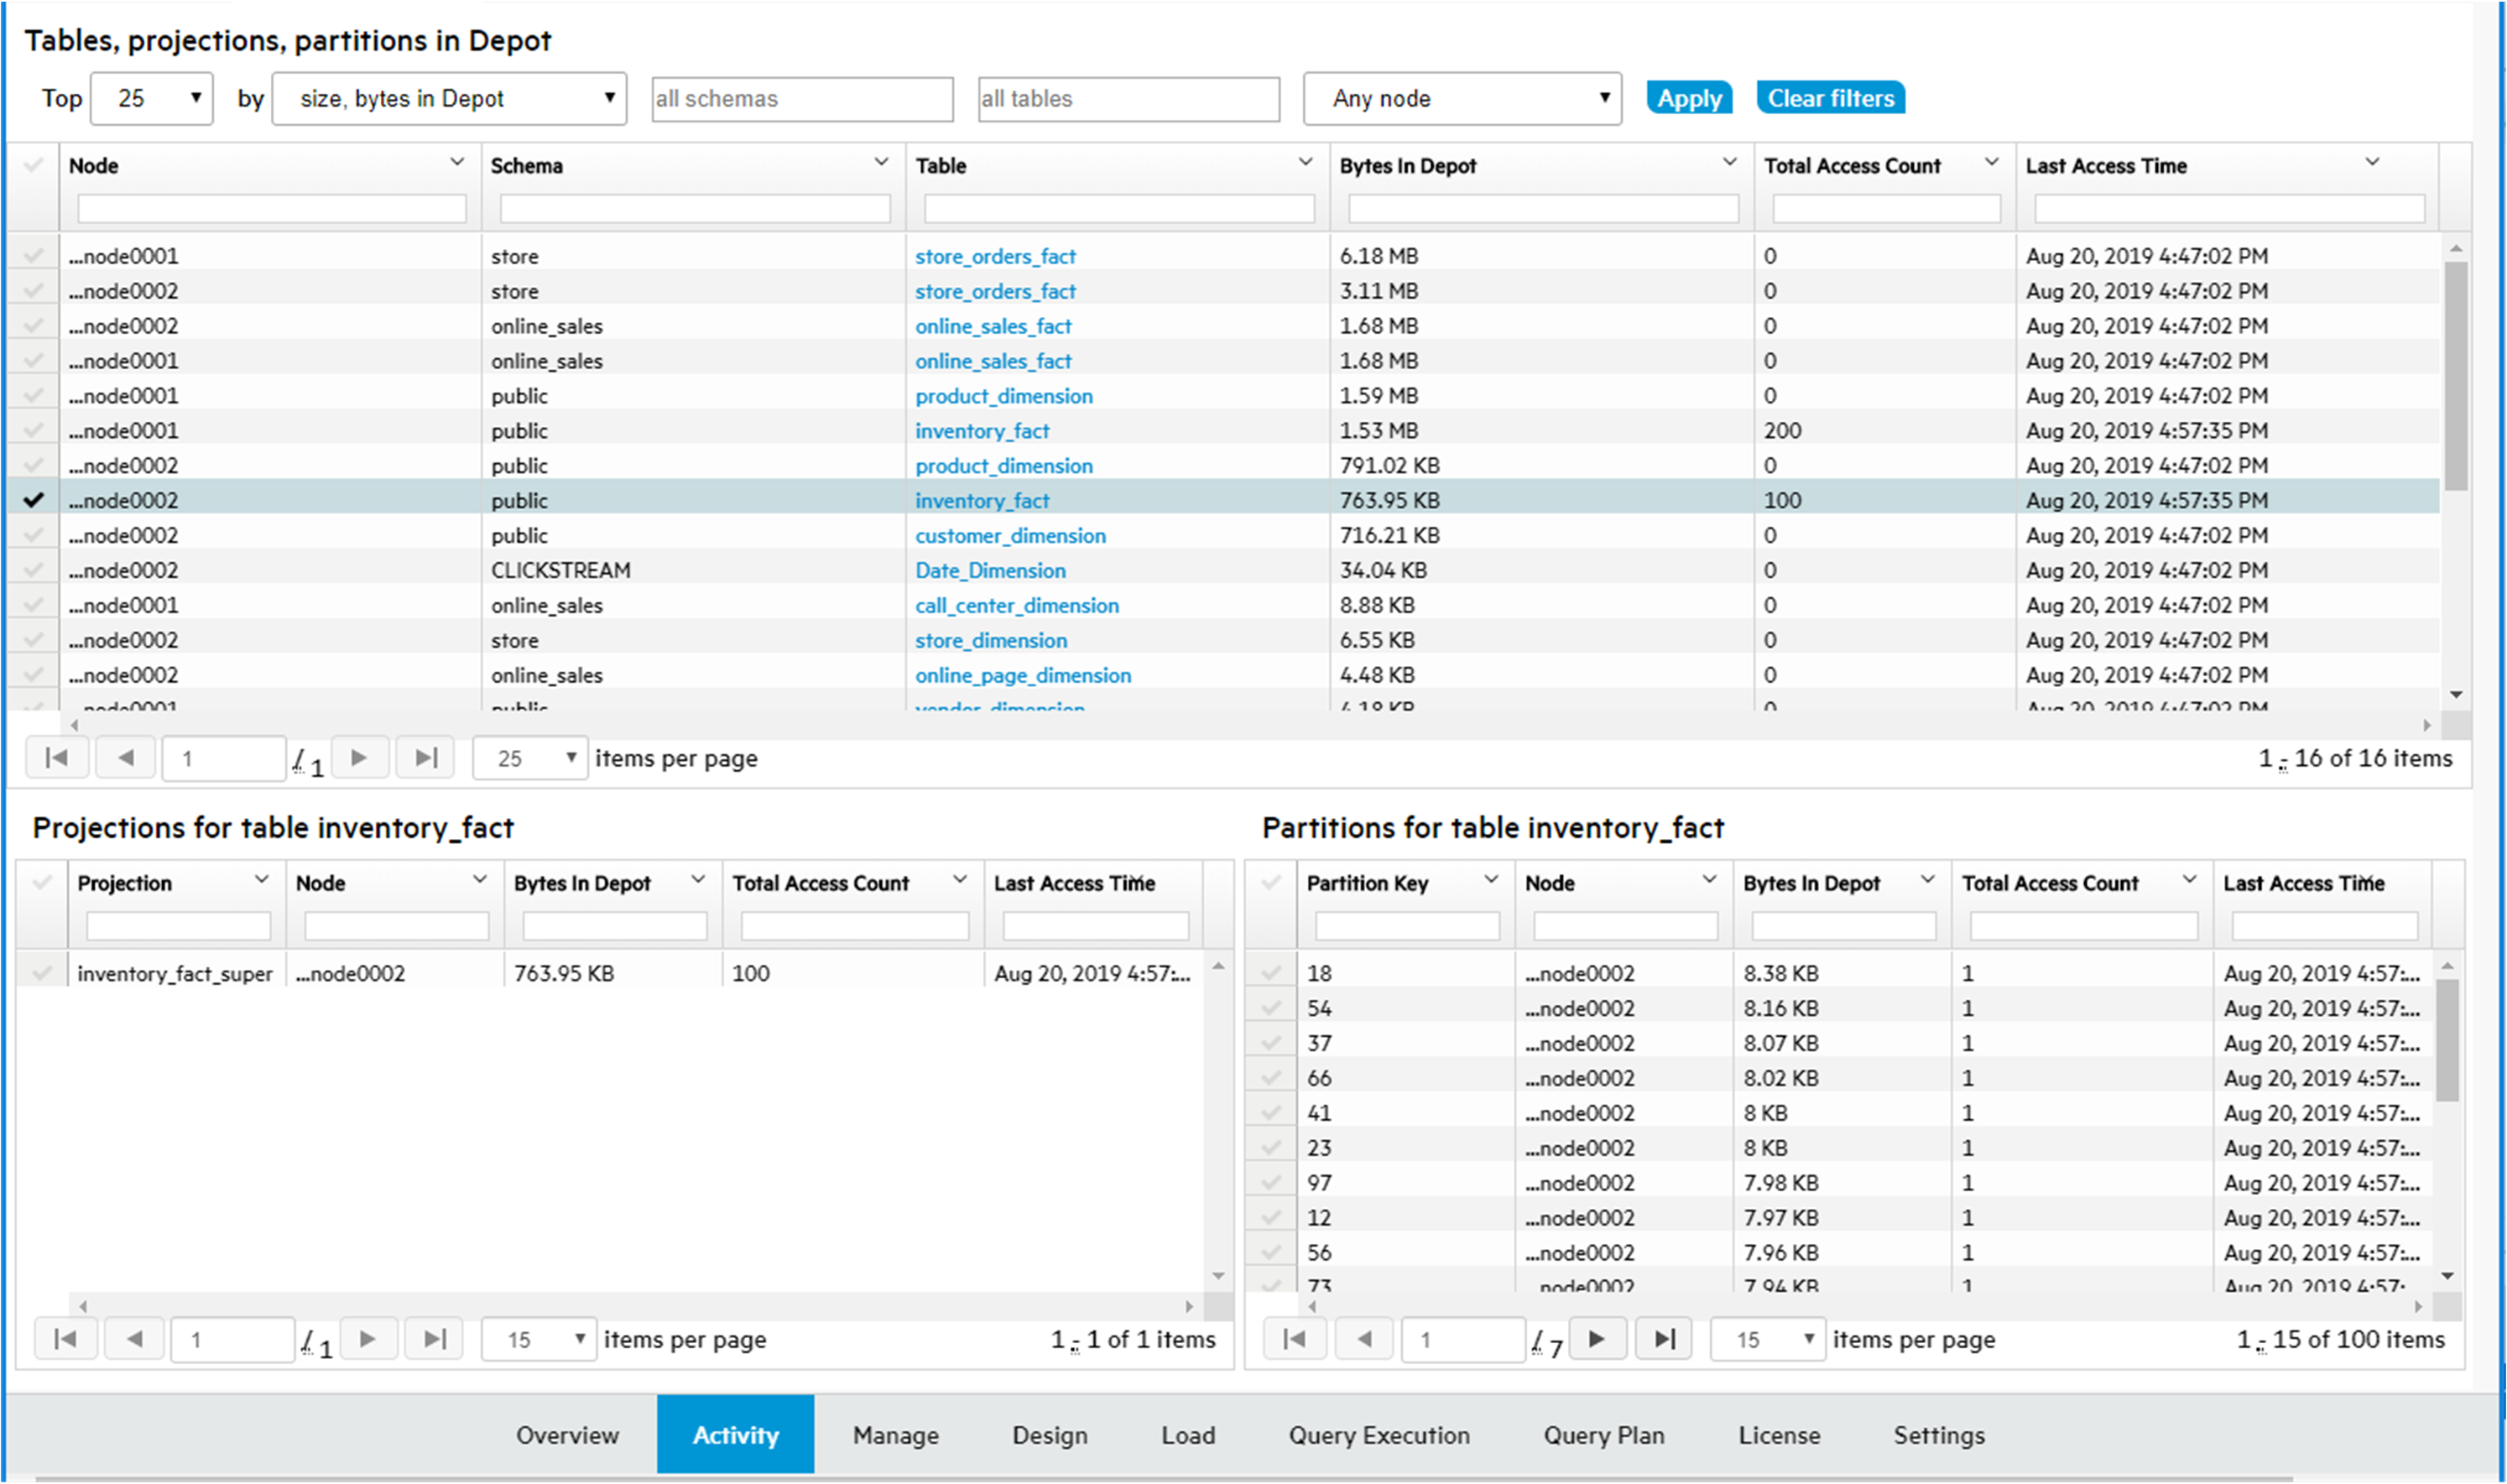
On the Depot Content tab, when you select a row, you are selecting the table depot content on a node. MC loads the details for that table for that node in the bottom section of the page, to show depot content for the selected table, broken down by either projections or partitions on a given node.
14.2 - Viewing depot activity
The At A Glance screen provides a high level view of depot activity.
The At A Glance screen provides a high level view of depot activity. The screen is divided into several sections:
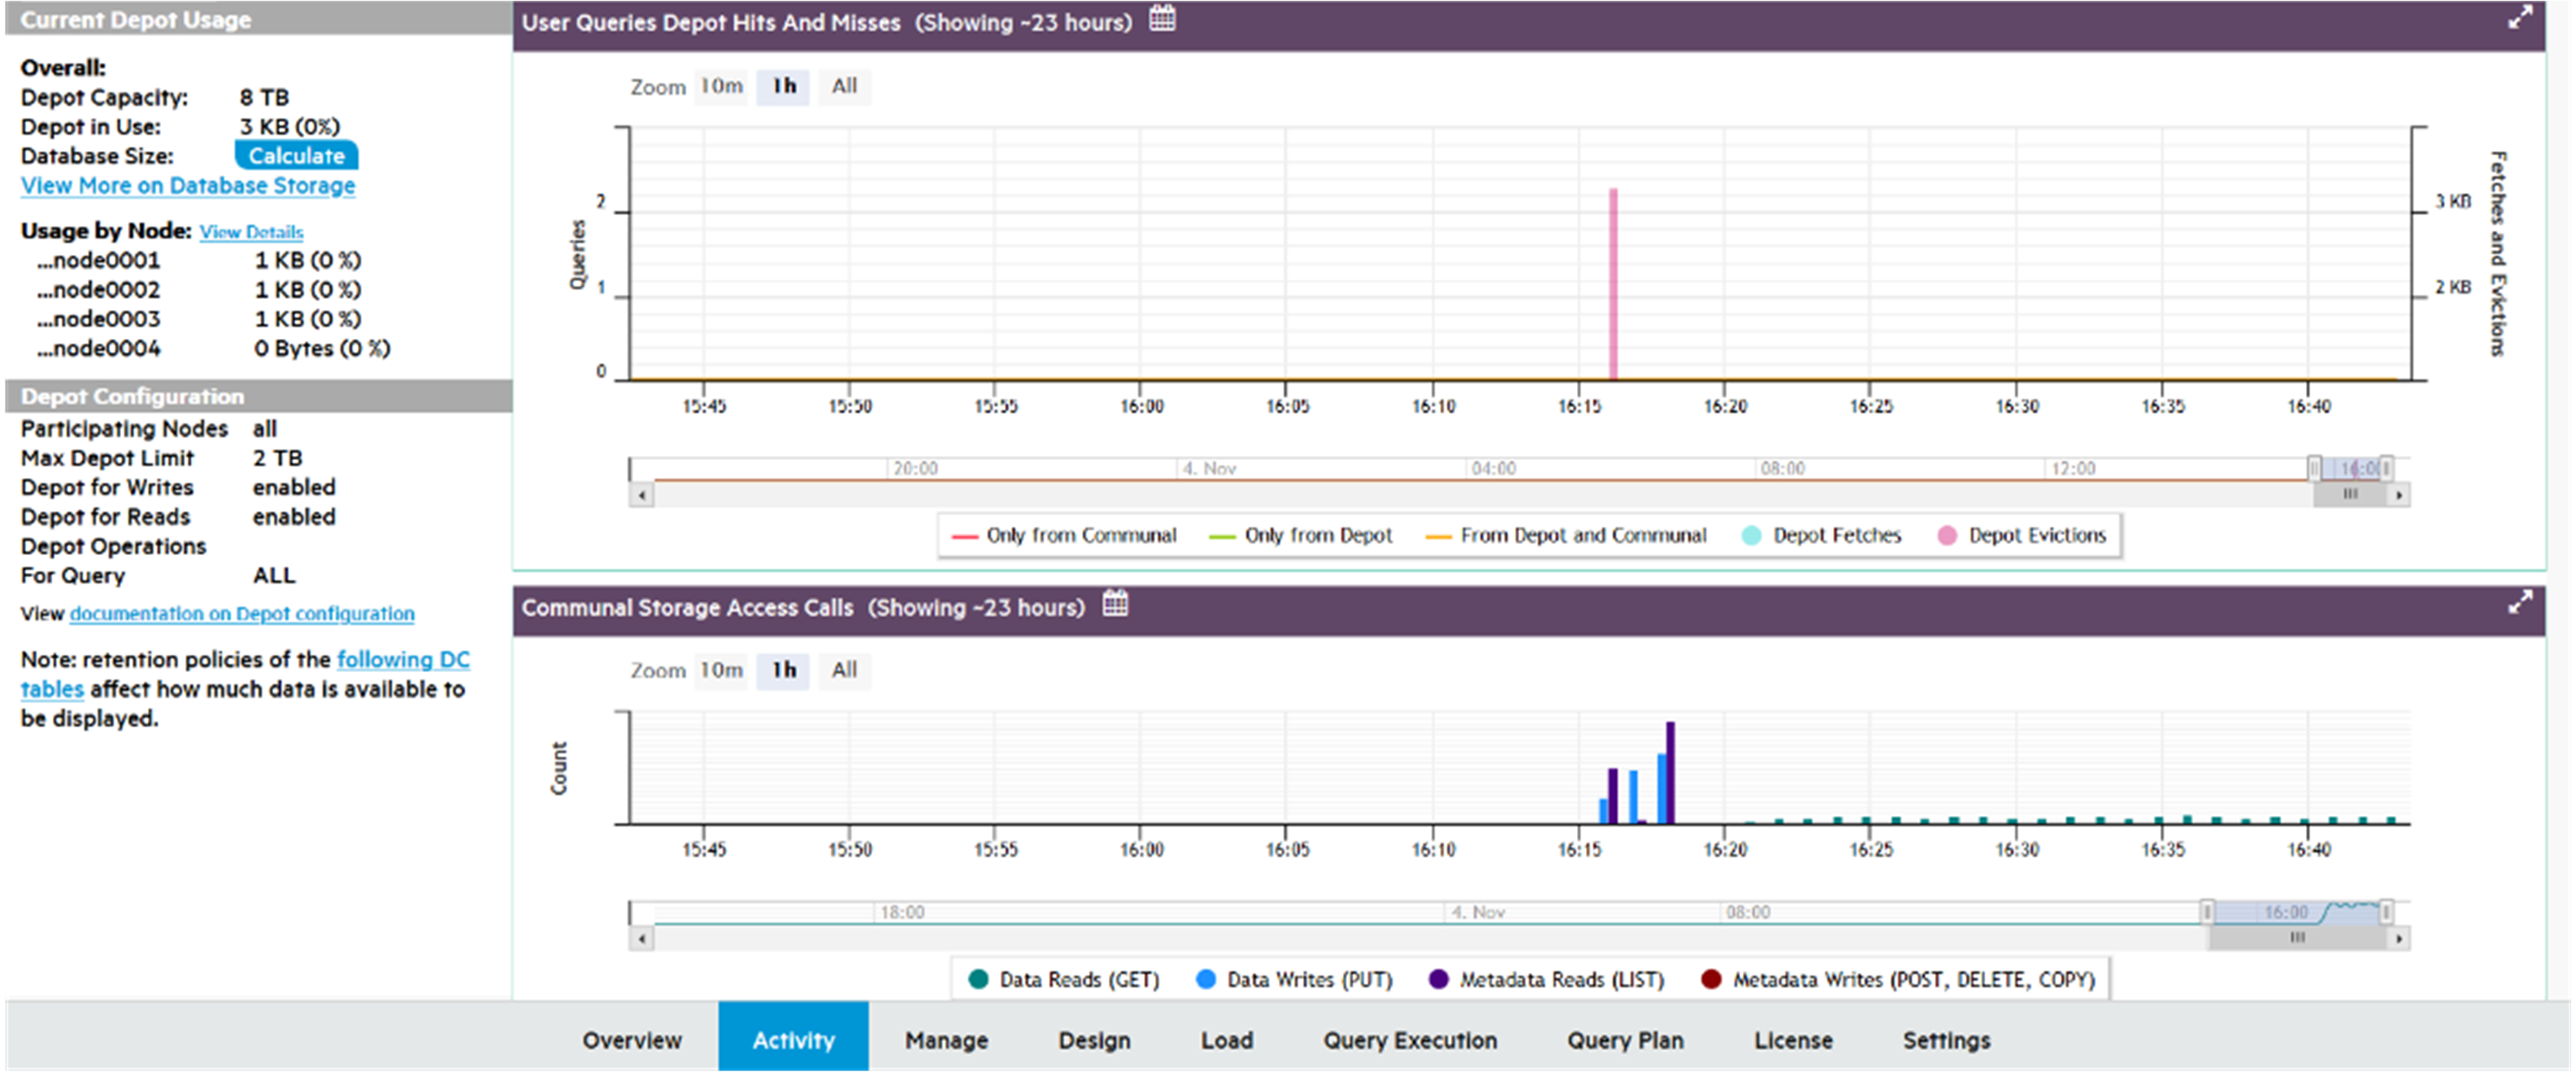
Current depot usage
Displays a summary of depot attributes and usage statistics:
Overall
-
Depot Capacity: Total depot capacity for all nodes in the database, added together.
-
Depot in Use: Total depot space currently in use, on all nodes in the database added together.
-
Database Size: Select Calculate to show the total size of the database, in GB.
-
View More on Database Storage: Click to see the Storage View tab, with details on the storage for this database.
Usage by node
-
Lists the number of bytes in the depot and percentage used, for each node in the database.
-
View More: Click to display depot usage for individual nodes.
Depot configuration
Provides information about how the depot is configured:
-
Participating Nodes: Number of nodes covered by these statistics.
-
Max Depot Limit: Total amount of depot space on all participating nodes.
-
Depot for Writes: Specifies whether the depot is Enabled or Disabled for write operations.
-
Depot for Reads: Specifies whether the depot is Enabled or Disabled for read operations.
-
Depot Operations for Query: Displays how system parameter DepotOperationsForQuery is set. This parameter specifies behavior when the depot does not contain queried file data, one of the following:
-
ALL (default): Fetch file data from communal storage, if necessary displace existing files by evicting them from the depot.
-
FETCHES: Fetch file data from communal storage only if space is available; otherwise, read the queried data directly from communal storage.
-
NONE: Do not fetch file data to the depot, read the queried data directly from communal storage.
-
A link for querying internal DC tables, to obtain retention limits on depot activity such as Depot Reads.
User queries depot hits and misses
For optimal performance, the majority of queries should access data that is locally stored on the depot. To maximize depot access, make sure that your depot is large enough to accommodate frequently accessed data. Otherwise, Vertica must access communal storage more often to retrieve required data, which can significantly affect query performance.
User Queries Depot Hits and Misses helps you evaluate how queries have interacted with the depot over time.
-
Color-coded graph lines show how many queries were accessing the depot or communal storage, or both, at any given time.
-
The left y-axis indicates the number of queries.
Depot fetches and evictions
When a query fetches data from communal storage to a depot that lacks enough space for the new data, Vertica attempts to evict older data. The User Queries Depot Hits and Misses chart can help you monitor churn—that is, how many files are evicted from the depot, and how often:
-
Colored bars show the moments of depot fetches and evictions, as measured in megabytes.
-
The right y-axis shows how much data was fetched or evicted.
If you observe that queries are consistently slower due to accessing communal storage, and notice the depot keeps experiencing frequent churn, it's likely that you need to increase depot size.
Depot query details
-
Hover over a point on the query line to see details about the number of queries that ran.
-
Hover over a Fetches or Evictions bar graph to see details about the number of bytes fetched or evicted.
-
Click the line or bar to view the Query Details page, which provides information about every query that ran in the selected timespan.
The following example shows a depot size sufficient to run all queries in the depot:
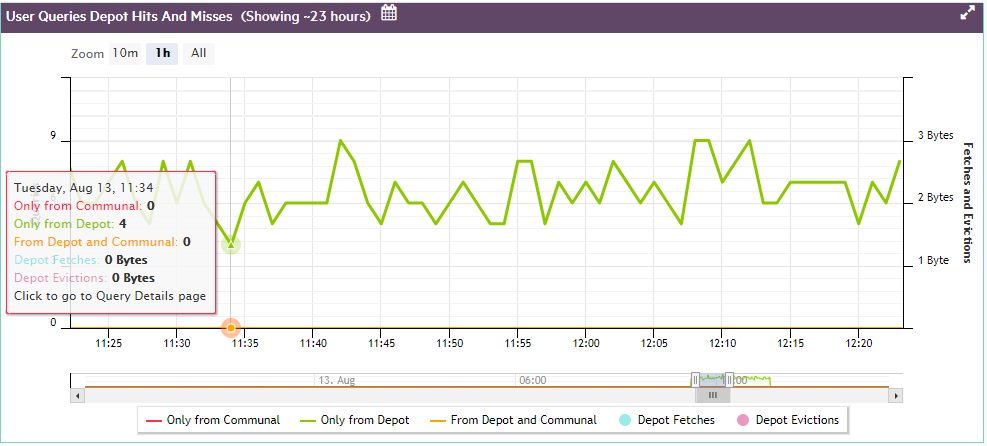
The next example shows what happens when the depot is too small for ongoing query activity, so a number of queries are forced to fetch their data from communal storage.
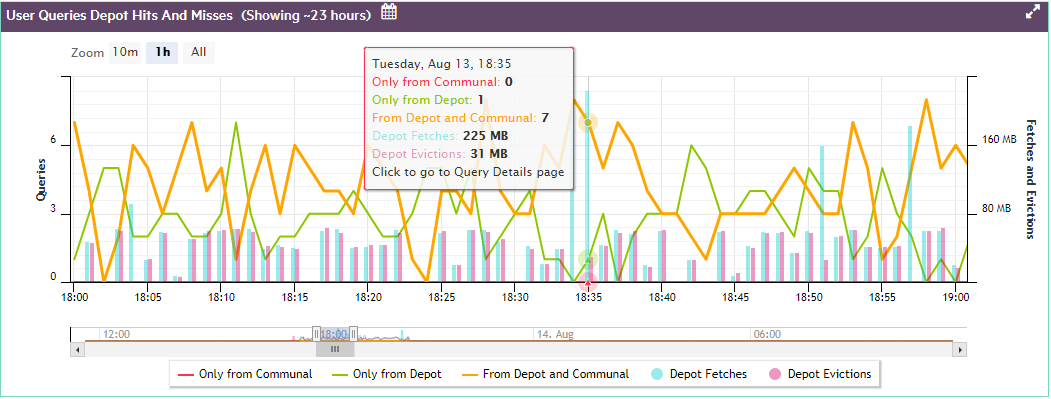
If you click on any point on the line, MC opens a Query Detail window that shows:
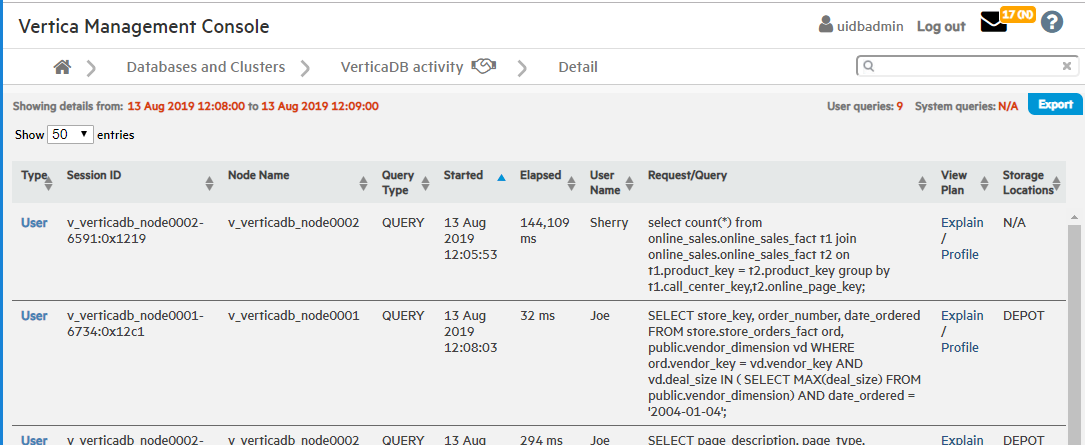
Communal storage access calls
Shows how many communal storage access calls (for example, AWS S3 API calls) of each type your database has executed over a given time span, one of the following:
Hover over any point on the Communal Storage Access Calls chart, to view a summary of data about that point. For example, if your cluster is on AWS, the summary lists how many of each AWS S3 API call type were executed in the selected timespan.
Click on any point on the bar graph to view details on:
For example:
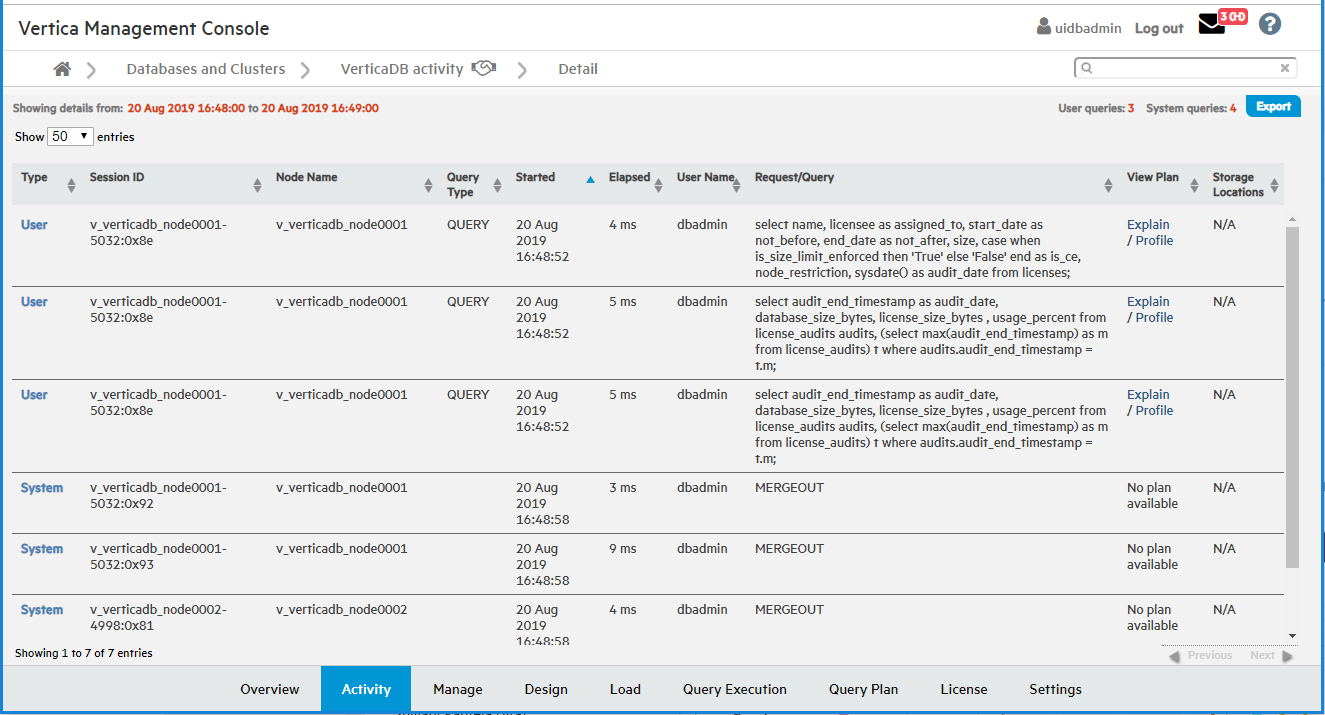
14.3 - Viewing depot efficiency
The Depot Efficiency tab provides several graphics that can help users quickly determine whether the depot is properly tuned.
The Depot Efficiency tab provides several graphics that can help users quickly determine whether the depot is properly tuned.
File reads by location
Shows the percentage of reads from depot and communal storage over the specified time span. In general, you want the majority of queries and other read operations to obtain their data from the depot rather than communal storage, as verified by the chart below.If communal storage shows a large percentage of file reads, it's likely that you need to increase the depot size.
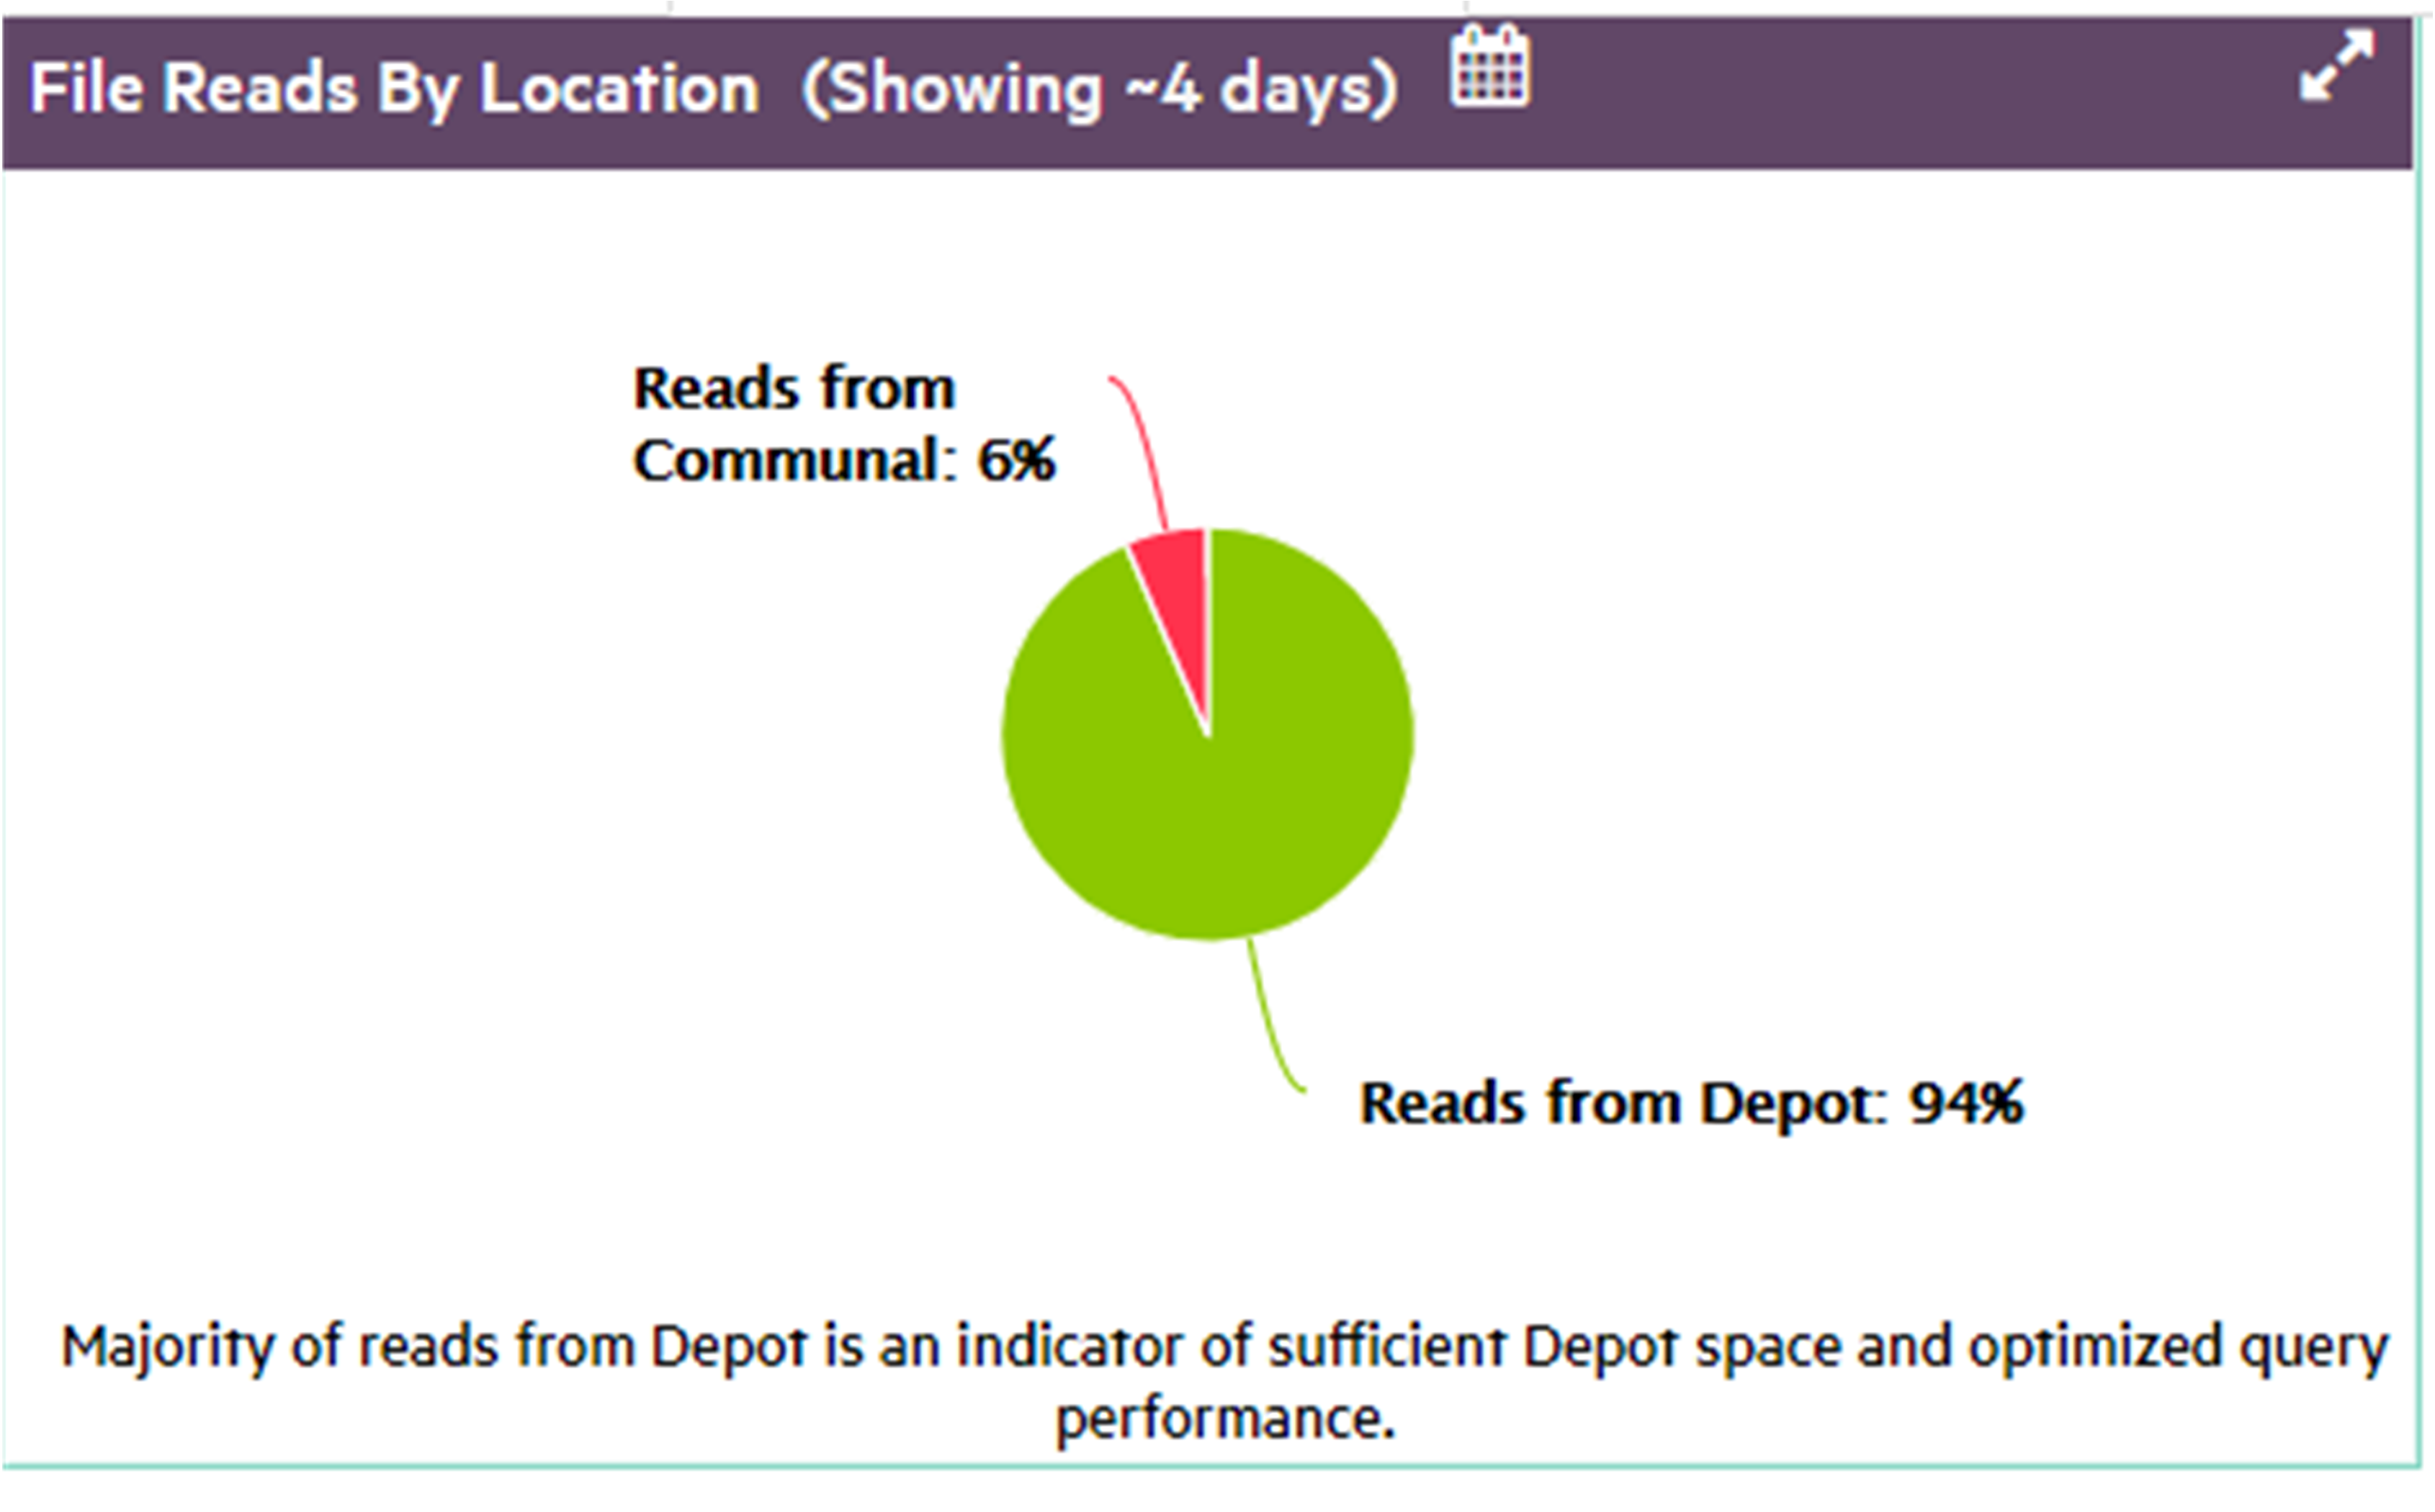
Top 10 re-fetches in depot
Vertica evicts data from the depot as needed to provide room for new data, and expedite request processing. Depot fetches and evictions are expected in a busy database. However, you generally want to avoid repeated evictions and fetches of the same table data. If this happens, consider increasing the depot size, or pinning the table or frequently accessed partitions to the depot.
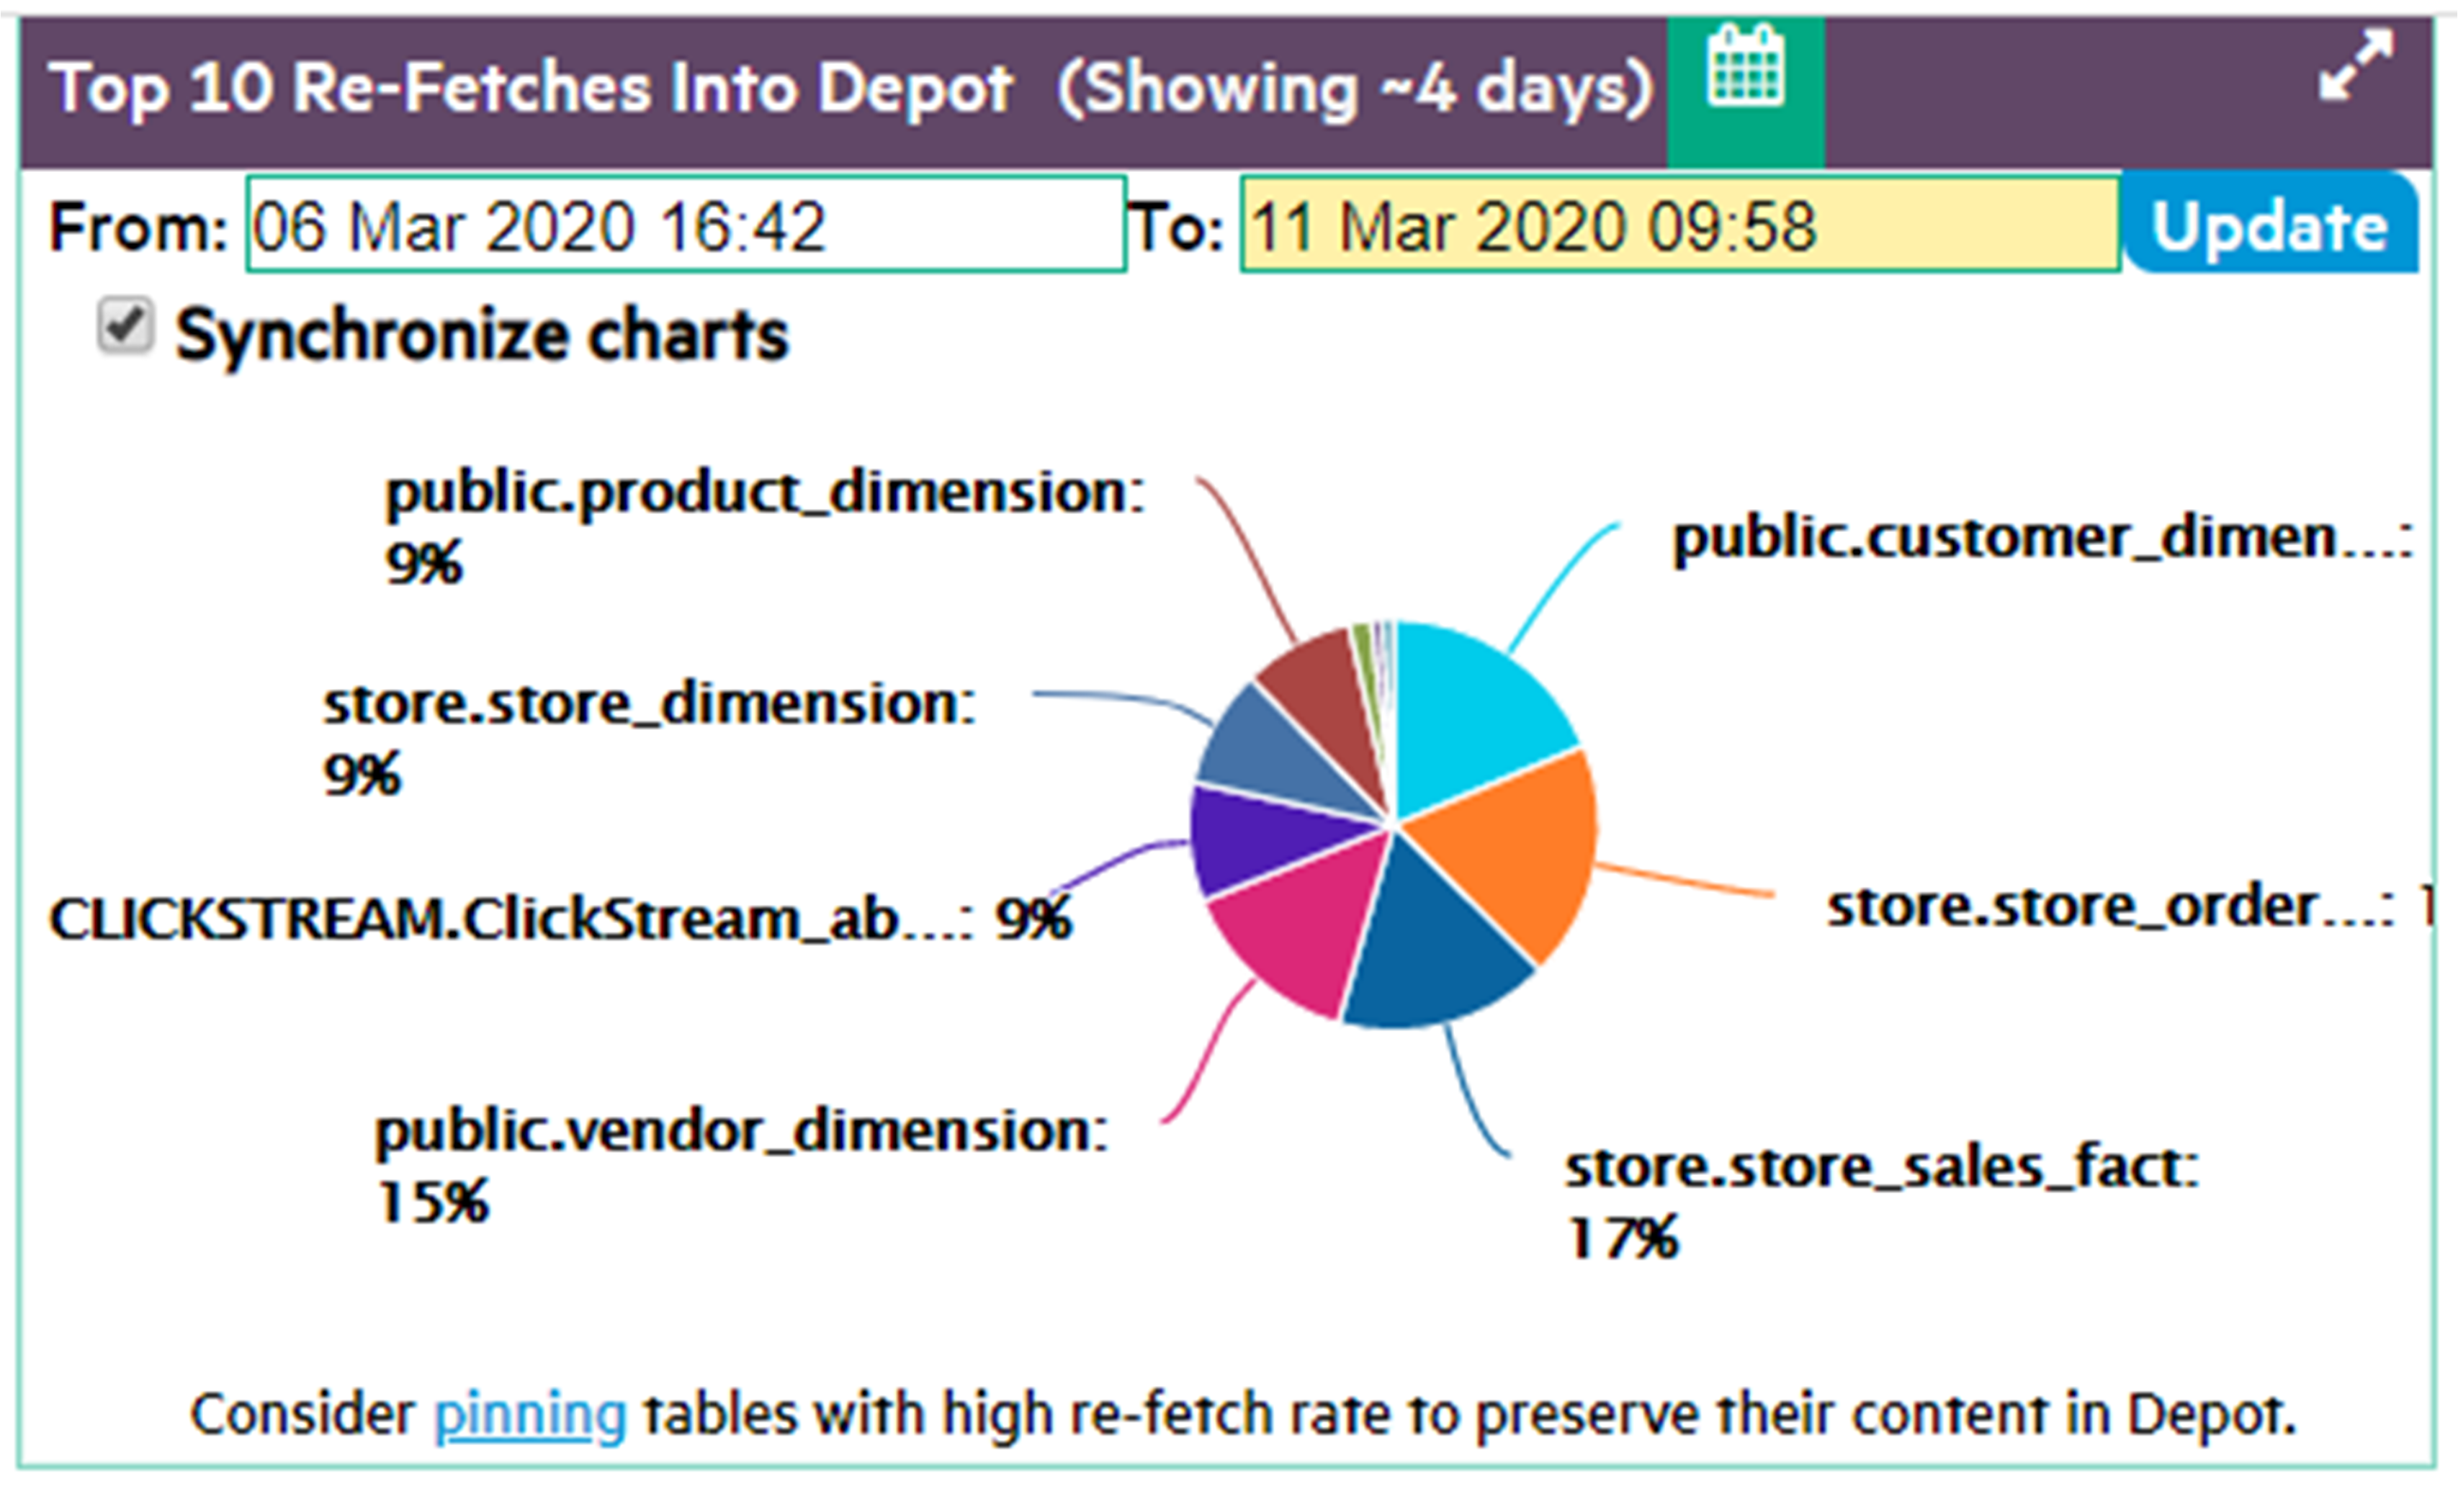
Depot pinning
It's often advisable to pin a table or table partitions whose data is frequently queried. Doing so reduces their exposure to eviction from the depot. However, you should also be careful not to use up too much depot storage with pinned data. If too much depot space is claimed by pinned objects (as shown below), the depot might be unable to handle load operations on unpinned objects.
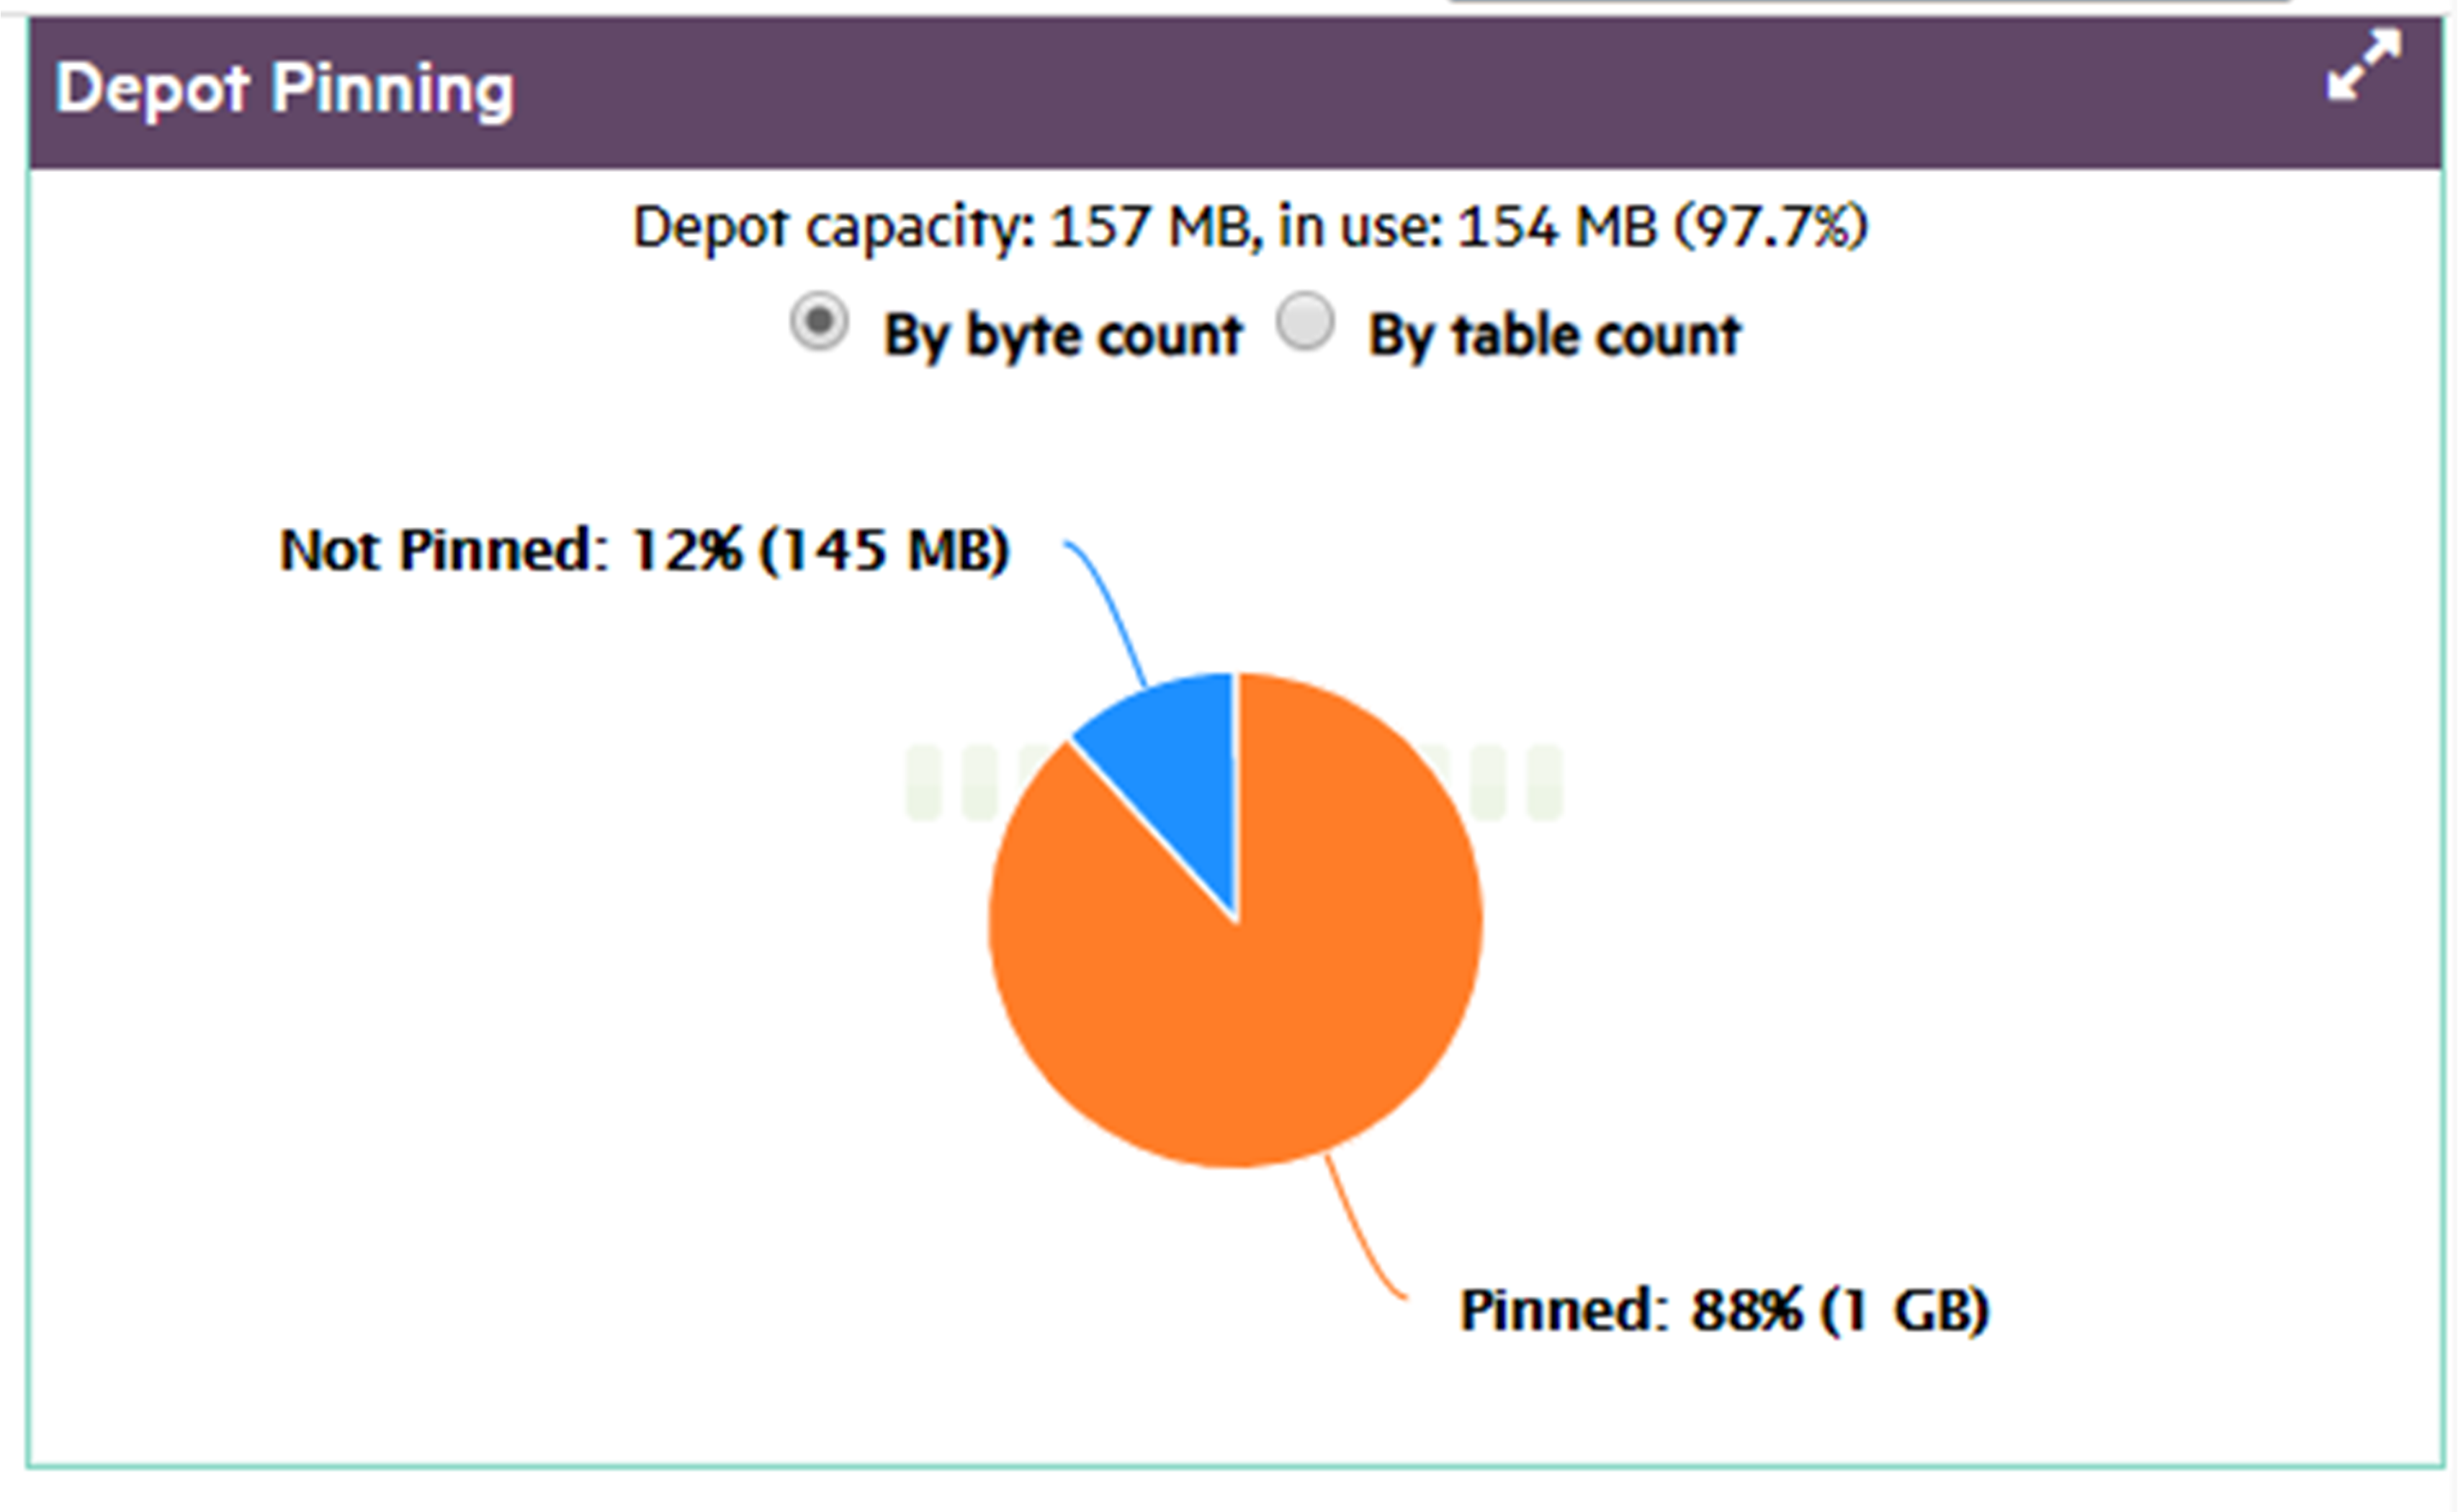
Number of tables in depot by age
Tables should typically reside in the depot for as long as their data are required. A short average lifespan of table residency might indicate frequent depot eviction, which can adversely impact overall performance. If this happens, consider increasing the depot size, or pinning frequently accessed table data.
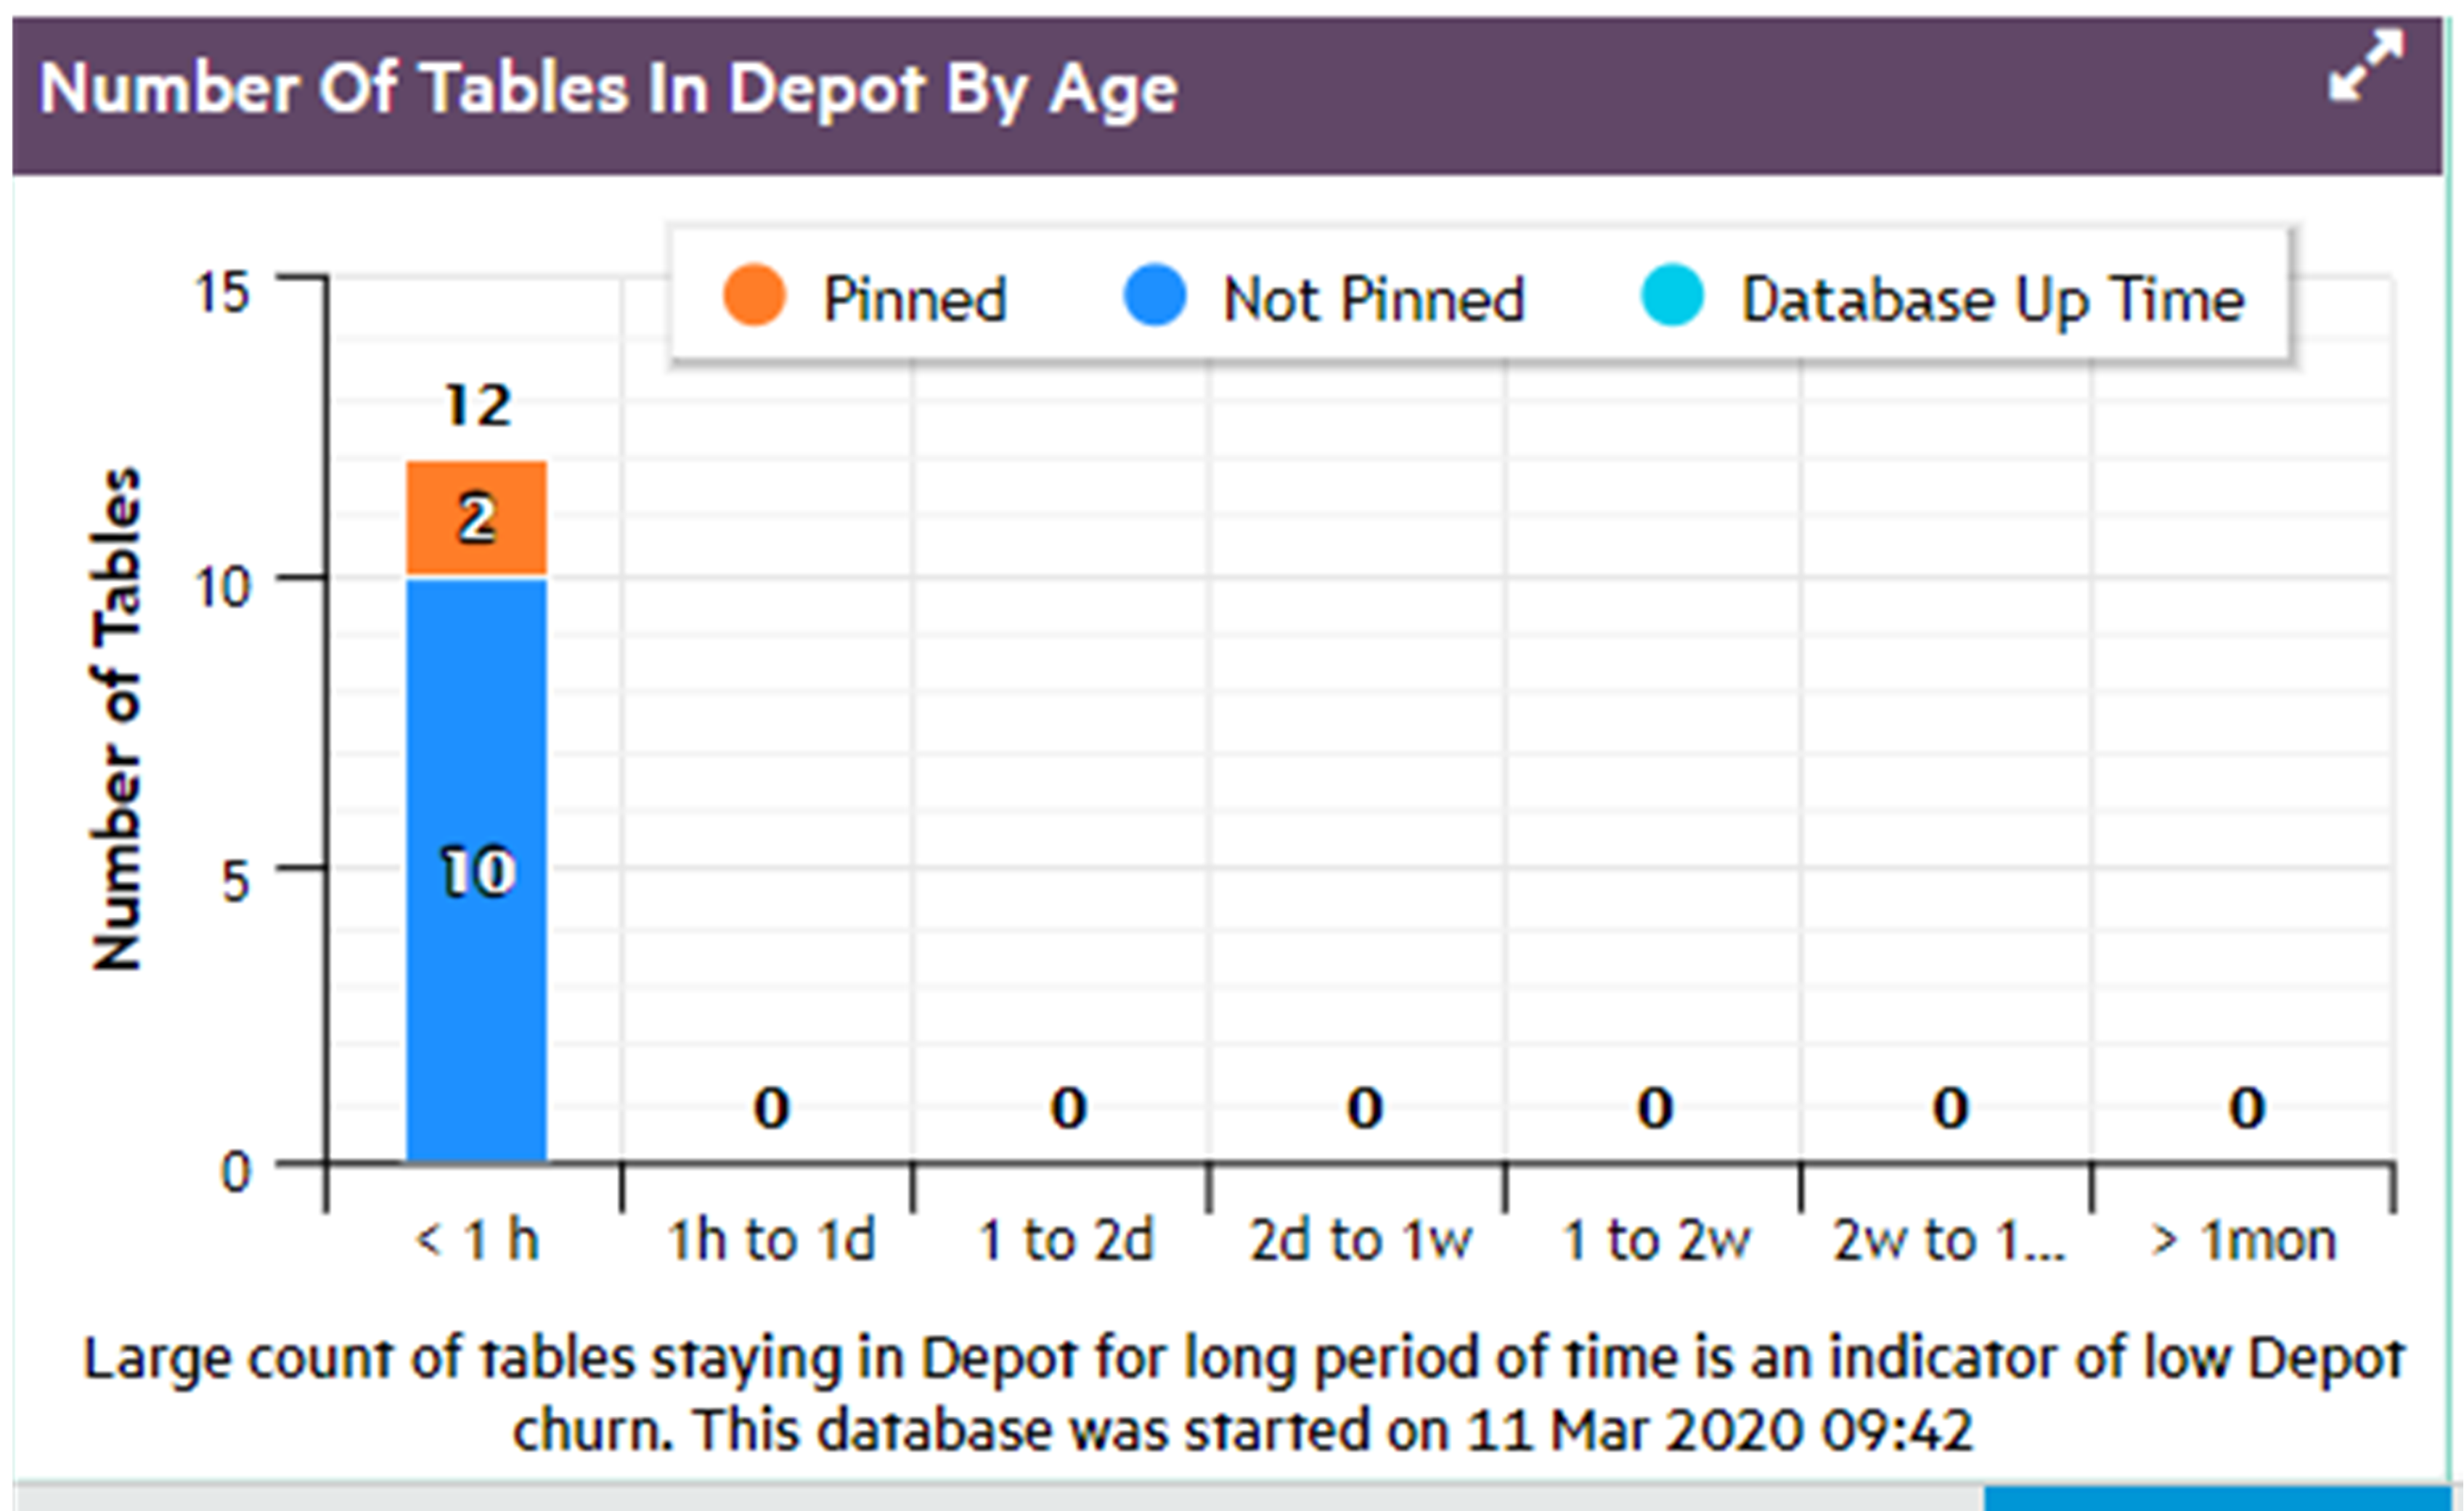
Number of tables in depot by access count
In general, the depot should largely be populated by tables that are frequently accessed, both pinned and unpinned.
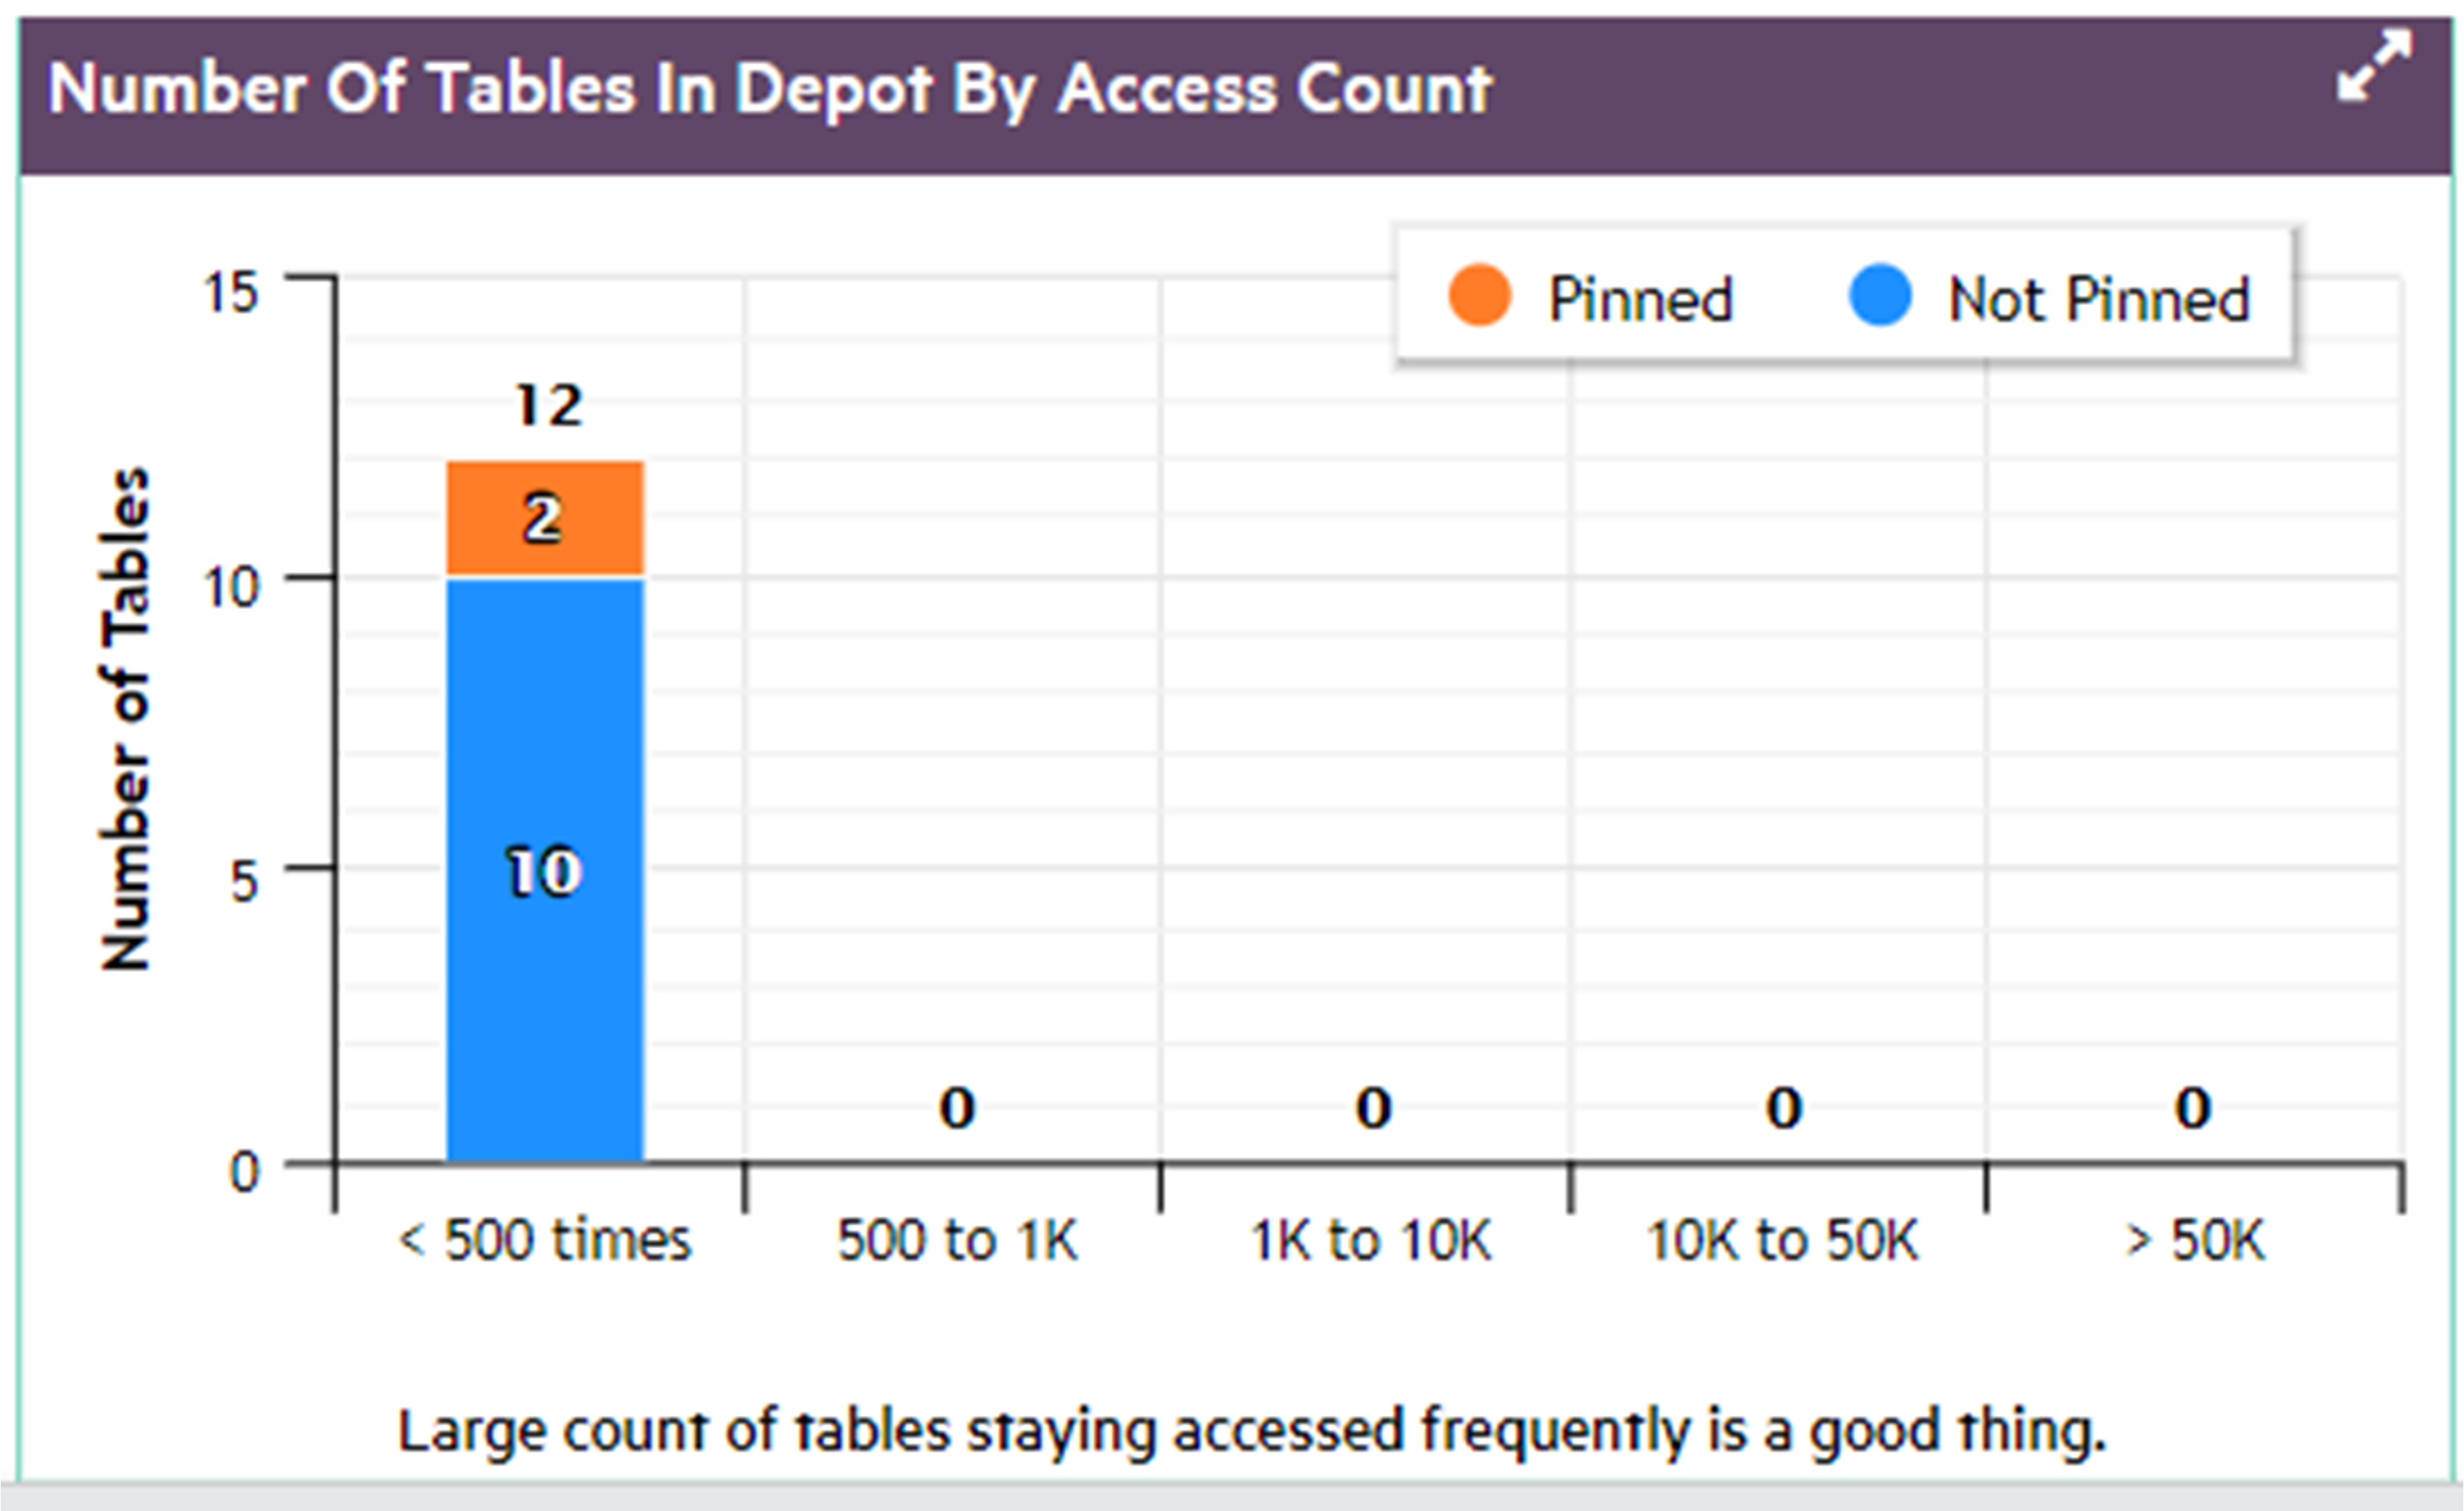
Number of tables in depot by size
It can be helpful to know the distribution of table sizes in the depot.
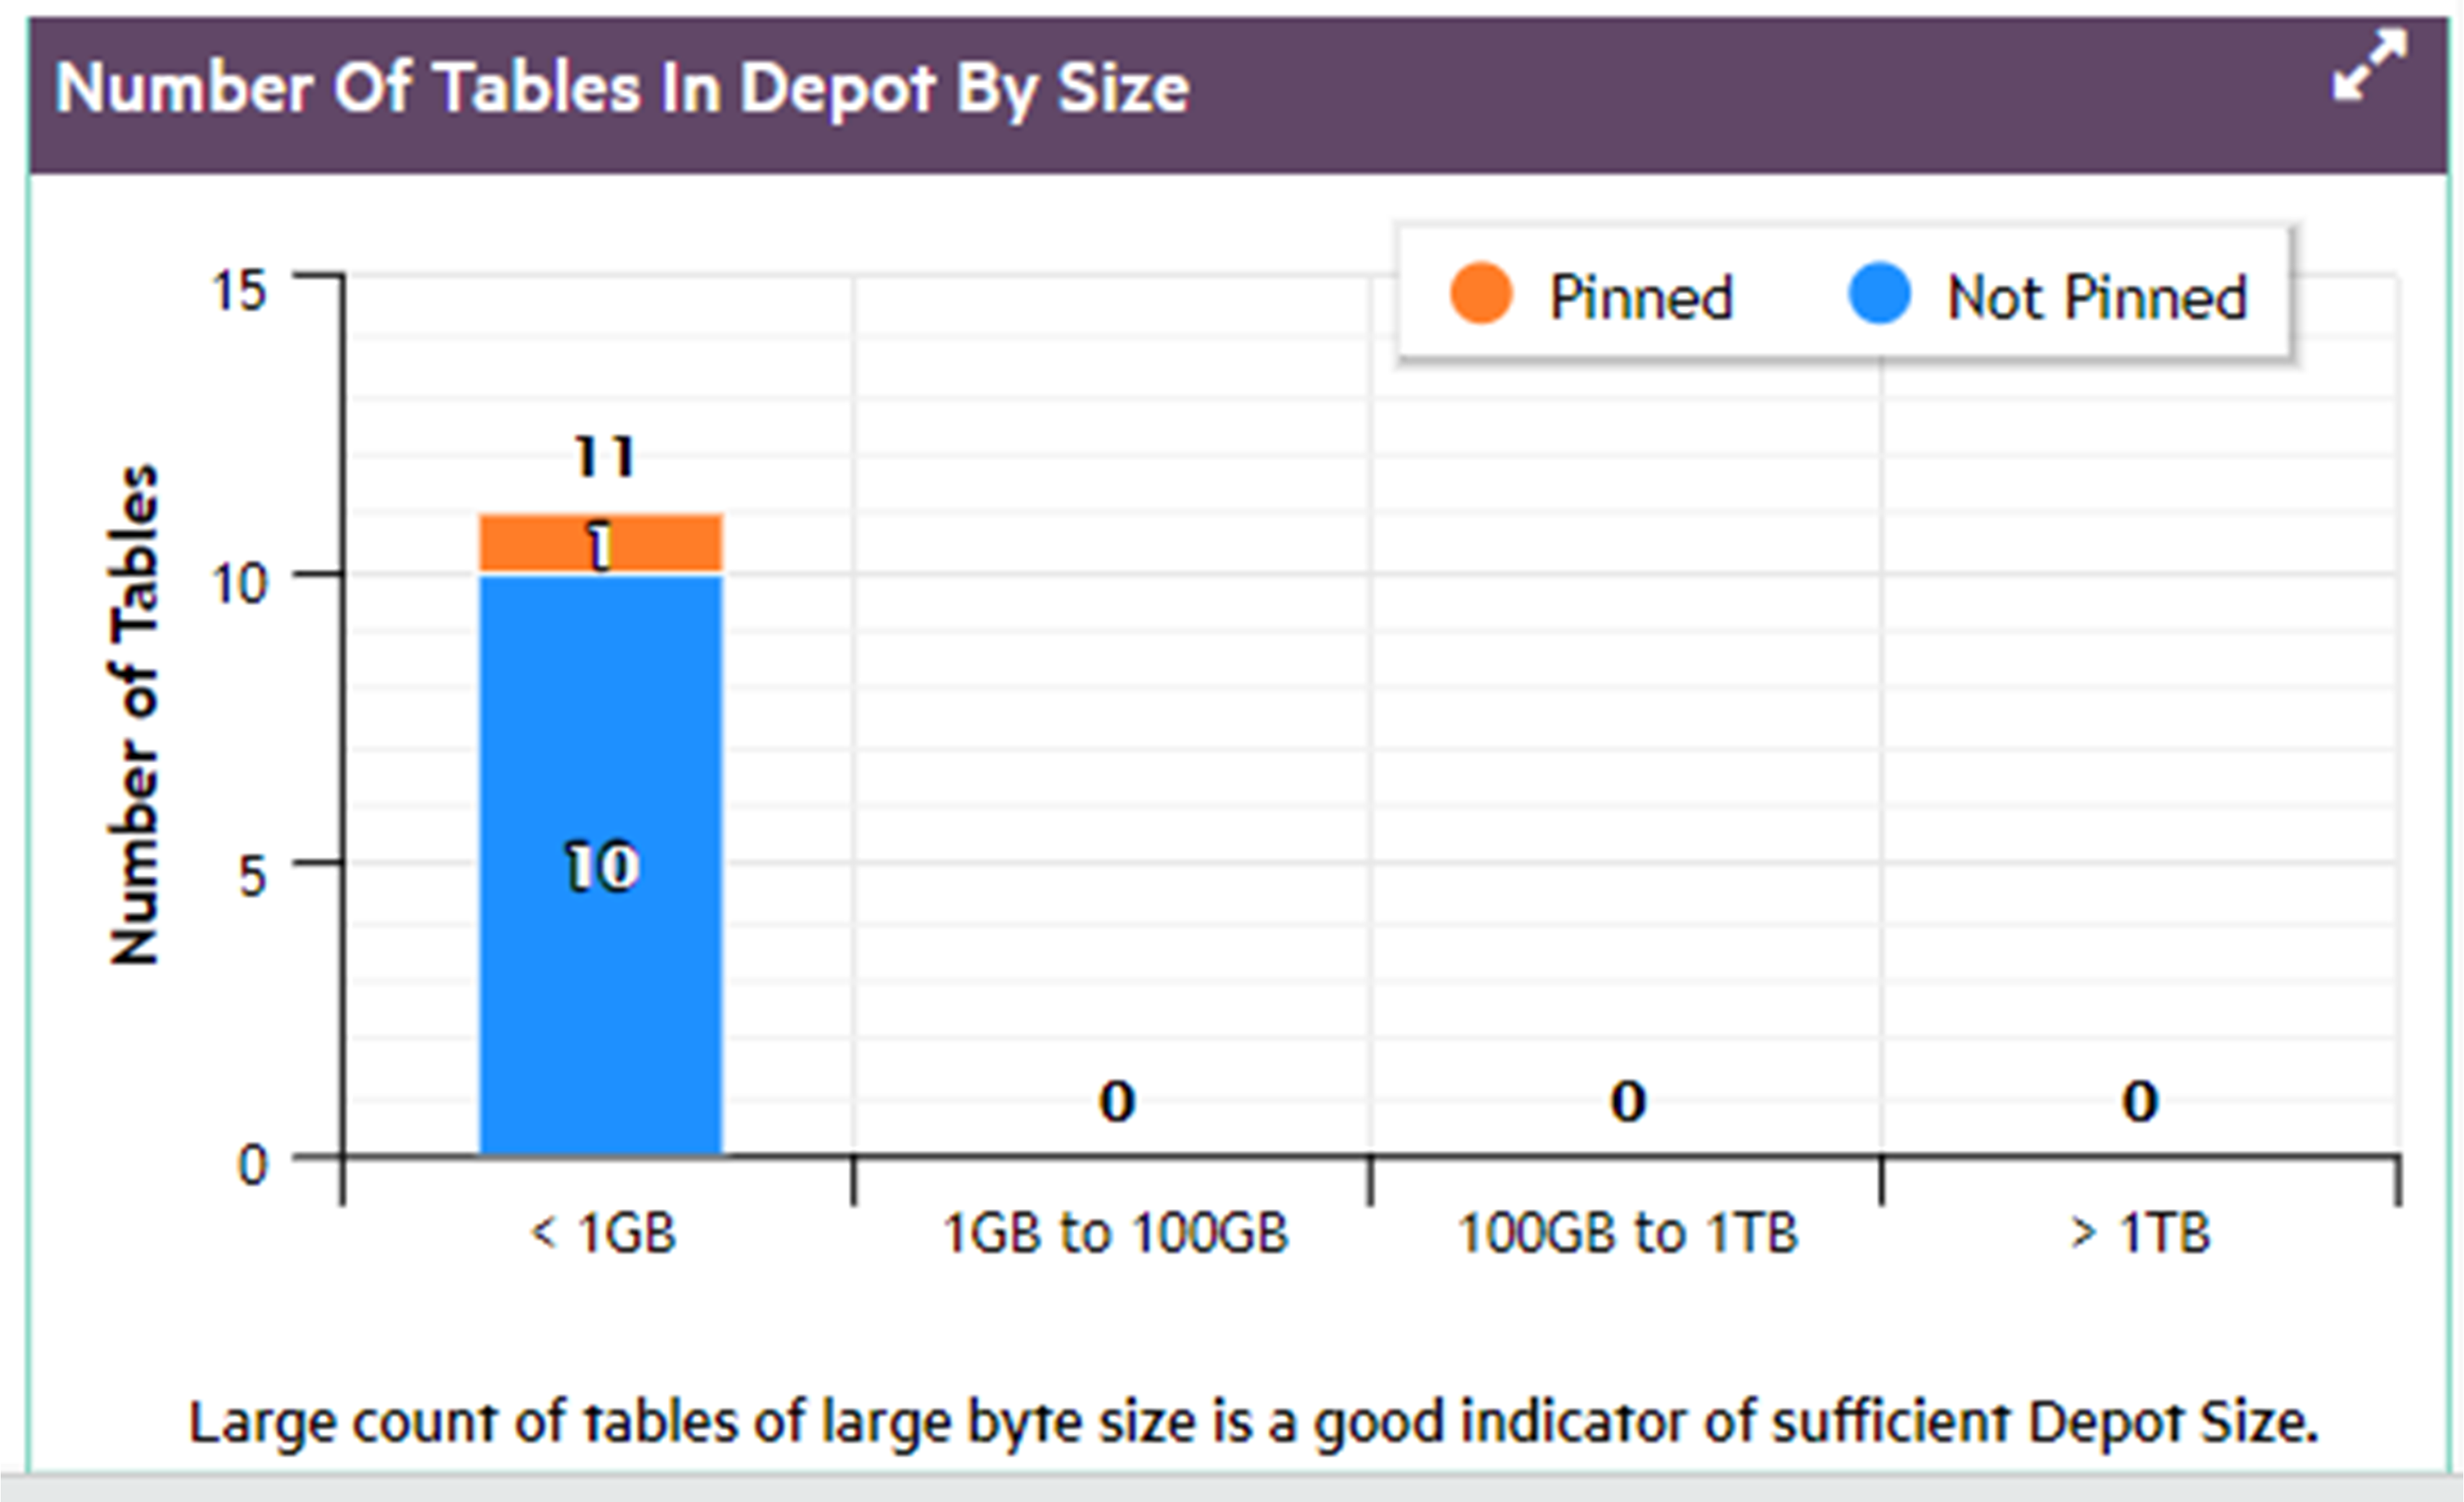
14.4 - Viewing depot content in MC
You can view in detail how the nodes in your Eon database are using the depot:.
You can view in detail how the nodes in your Eon database are using the depot:
-
Display a list of tables with the largest amount of data in the depot.
-
Use the filter fields to list the tables most frequently or most recently accessed in the depot.
-
Display details about how frequently the projections and partitions for a specific table access the depot, and the last time the depot was accessed.
The Depot Activity Monitoring > Depot Content tab opens showing a default list of the top 25 tables in the database, as ranked by each table's total bytes in the depot. The list shows all the nodes for each of those top tables. The nodes are sorted solely based on most bytes in depot, so the nodes for a given table do not necessarily appear together.
Filter the list
You can use the filter fields above the table to focus the list more narrowly. The filters let you select:
-
The number of top tables
-
Whether the tables are selected by most bytes in depot, the highest number of times their depot was accessed, or the most recent last access time
-
Tables in all schemas, or only in a specific schema
-
All tables, or only a specific table
-
All nodes, or only a specific node
In the Schema, Table, and Node filter fields, you can enter a text string to select all items whose names include that text string.
Select a node to see the breakdown of depot data in projections and partitions
Select a row in the top table. MC then loads the details to show how that table's depot content is distributed across the projections and the partitions for that table, that are on that node. The Projection and Partition panes show these details for the selected node:
-
Projection: Number of bytes of data for the selected table that each projection has in the depot on the selected node.
-
Partition: If the table is partitioned, this pane shows the number of bytes of data for the selected table that each partition has in the depot on the selected node.
For each projection and each partition, MC also displays the total number of times, that the projection or partition has accessed the depot on that node, and the last access time.
For more information about projections, see Projections.
For more information about partitions, see Partitioning tables.
Steps to monitor depot content
-
From the MC home page, open a database, select the Activity tab from the bottom menu, select Depot Activity Monitoring in the top selection box, and select the Depot Content tab. MC displays the top N tables (25 by default), ranked by the number of bytes of data each table has in the depot on all its nodes.
-
To narrow the list, use the filters at the top of the tab. You can show only the nodes in a certain schema and/or database, or display all the activity on a specific subgroup of nodes. Change the filters, then click Apply.
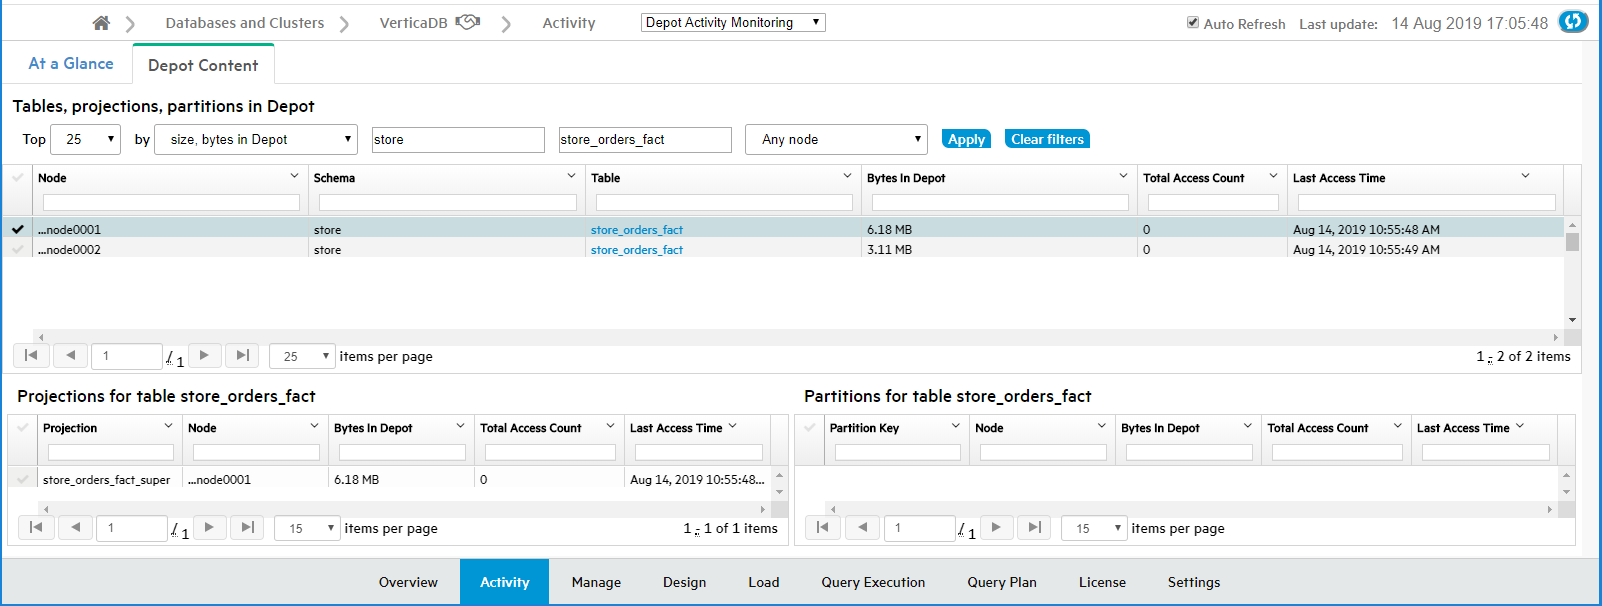
-
To select all items whose names contain a certain text string, enter that text string in a filter field. This example selects the nodes for the tables whose names contain the string "fact".
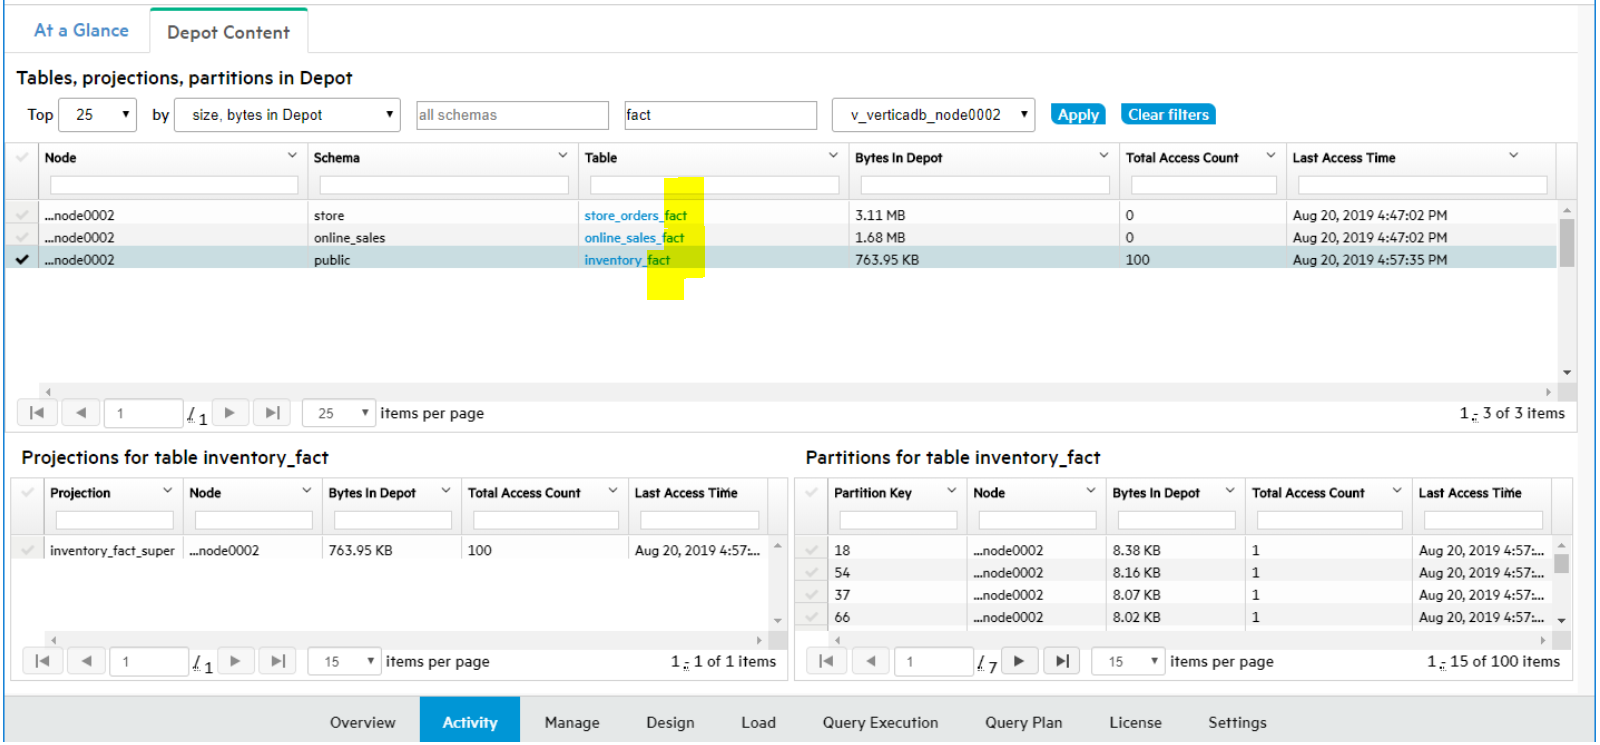
-
To display details on the projections and partitions for a specific table that are accessing the depot, select a row in the top pane of the Depot Content tab.
See also
Monitoring depot activity with MC
14.5 - Managing depot pinning policies
Vertica evicts data from depots as needed to provide room for new data, and expedite request processing.
Vertica evicts data from depots as needed to provide room for new data, and expedite request processing. You can pin database objects to reduce the risk of depot eviction. Three object types can be pinned: tables, projections, and table partitions.
The Depot Pinning tab lets you perform the following tasks:
For details on pinning policies, see Managing depot caching.
Listing pinning policies
To list existing depot pinning policies:
-
Select Display Existing Pinning Policies.
-
Click Search. Vertica lists all tables that are currently pinned to the depot, under Existing Pinning Policies:
-
If desired, filter and sort the list of policies by setting the following fields:
Filter on:
- Schema: Full or partial name of the desired schema
- Table: Full or partial name of the desired table
- Policy Type: Table or Partition
- Policy Scope: Database Level or subcluster name
- Partitioned Table: Y (yes) or N (no)
Sort on (in ascending/descending order):
- Size in Depot: Absolute size (in MB) of cached data
-% of Depot: Percentage of depot storage used by the cached data
- Total Access Count: Number of times that cached data from this table has been queried or otherwise accessed
- Last Access Time: Last time cached data of this table or partition was queried or otherwise accessed
Removing existing policies
You can also use the result set under Existing Pinning Policies to remove one or more policies.
To remove one or more table policies:
- From the policy list, select the check boxes of policies to remove.
Note
Policy Type of all selected policies must be set to Table.
- Click Bulk Remove Table Policies.
To remove a table's partition policies:
-
On the policy to remove, click Modify Policy.
-
In the Modify Pinning Policy dialog, perform one of the following actions:
- Click Remove Policy on the desired policy.
- Select the check boxes of one or more policies, then click Remove Selected Policies.
-
Click Close.
Creating pinning policies
You can create a policy that pins table data to a subcluster depot or to all database depots. You can specify the following policy types:
Find candidates for pinning
-
Select Create or Modify Pinning Policies.
-
Optionally filter the search by specifying a schema and the full or (for wildcard searches) partial name of a table.
-
Click Search.
You can use the filtered data to determine which tables or partitions are good candidates for depot pinning. For example, a high total access count relative to other tables (Total Access Count) might argue in favor of pinning. This can be evaluated against data storage requirements (% of Depot) and age of the cached data. For example, if pinned objects claim too much storage, a depot might be required to:
-
Route large load operations directly to communal storage for processing.
-
Increase frequency of evictions.
-
Increase frequency of fetches from communal storage to handle queries on non-pinned objects.
All these cases can adversely affect overall database performance.
Tip
To minimize contention over depot usage, consider the following guidelines:
-
Pin only those objects that are most active in DML operations and queries.
-
Minimize the size of pinned data by setting policies at the smallest effective level—for example, pin only the data of a table's active partition.
For details on how Vertica handles depot storage and turnover, see Managing depot caching.
Create a table or partition pinning policy
To create a pinning policy for a single table or table partition:
-
Under the Create or Modify Pinning Policies list , find the table to pin.
-
Click Create Policy. The Create a Pinning Policy dialog opens.
-
Select the desired policy scope, one of the following:
- Database
- An available subcluster
-
Select the desired policy type: Table Policy or Partition Policy
Table Policy
Click Create:
Partition Policy (available only if the table is partitioned)
For example:
-
Click Create.
Vertica displays the new pinning policy:
-
Optionally, add more partition-level policies on the same table by setting new partition keys.
-
When finished, click Close.
If partition pinning policies on the same table specify overlapping key ranges, Vertica collates the partition ranges. For example, if you create two partition pinning policies with key ranges of 1-3 and 2-4, Vertica creates a single policy with a key range of 1-4.
Create pinning policies on multiple tables
To create a pinning policy on multiple tables:
-
On Create or Modify Pinning Policies, select the check boxes of the tables to pin.
Note
All checked tables must be unassigned to a pinning policy, as indicated by their Create Policy link.
-
Click Bulk Create Table Policies. The Bulk Create Table Policies dialog opens.
-
Select the desired policy scope, one of the following:
- Database
- subcluster (choose the desired subcluster)
-
Click Create, then click Close.
Removing a pinning policy
To remove an existing pinning policy:
-
On Create or Modify Pinning Policies, find the table with the policy to remove.
-
Click Modify Policy.
-
In the Modify Pinning Policy dialog, perform one of the following actions:
- Click Remove Policy on the policy to remove.
- Select the check boxes of one or more policies, then click Remove Selected Policies.
-
Click Close.
Remove pinning policies from multiple tables
To bulk-remove pinning policies from one or more tables:
-
On Create or Modify Pinning Policies, select the target table check boxes.
Note
All checked tables must comply with the following requirements:
-
Click Bulk Remove Table Policies. The Bulk Remove Table Policies dialog opens.
-
Click Remove, then click Close.
Viewing frequently fetched tables
You can query the depot for tables that are most frequently fetched from communal storage. This can help you quickly identify potential candidates for depot pinning:
-
Select Top num Refetched Tables(s) from Depot.
-
Specify the maximum number of results to return (by default 10), and the range of dates to query.
From the list, you can perform the following tasks:
15 - Monitoring depot storage with MC
To display detailed storage monitoring information for your Eon database:.
To display detailed storage monitoring information for your Eon database:
-
From the MC home page, select View Your Infrastructure.
-
On the Infrastructure page, select the Storage View tab.MC displays the Storage View screen, with details about the database storage and links to further detail screens:
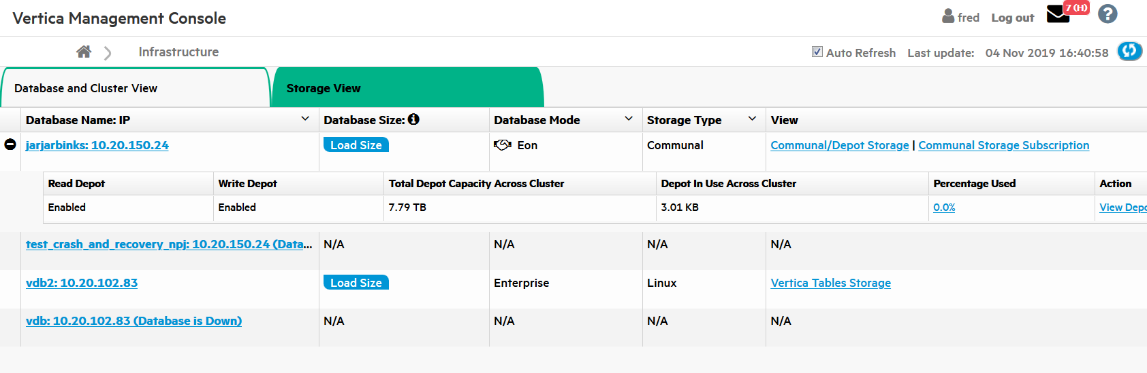
-
To see the loaded size of the database, click Load Size.
-
To see communal storage details for the database, such as its location and size, and the IP addresses of the nodes, click Communal/Depot Storage.
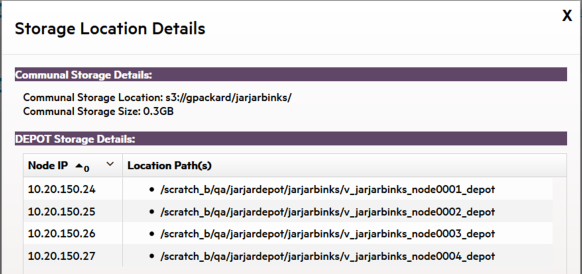
-
To view the shard subscriptions for your Eon nodes, click Communal Storage Subscription. MC displays the shard type, how many nodes are subscribed to each shard, and the status of each shard subscription (Active, Inactive, Passive, Pending, Removing).
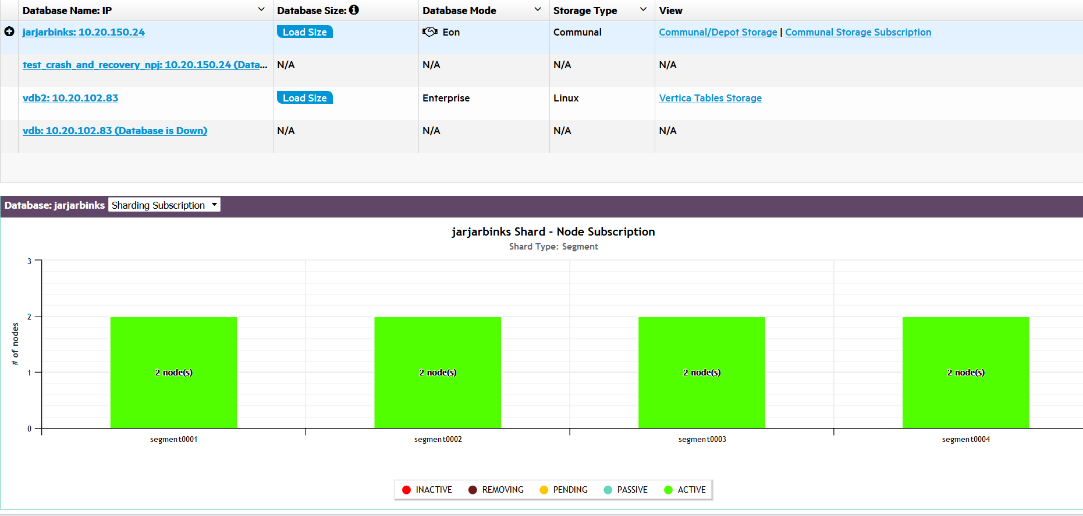
There are two views:
Hover over a bar to display the details.
-
To display the depot details for all nodes in the database, click View Depot Details by Nodes. MC lists the nodes by node name, and for each node shows the number of bytes the node has in its depot, the total capacity of the depot, the percent used, and the path to the node's depot.
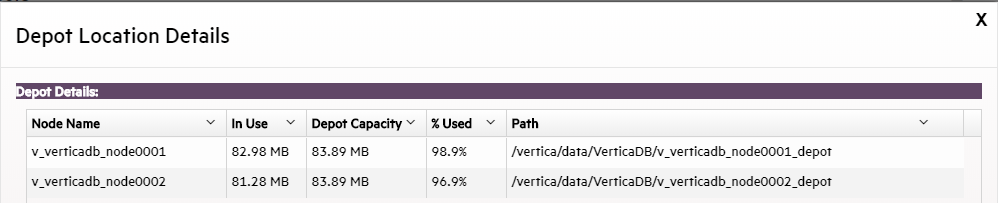
See also
Monitoring depot activity with MC
16 - Extended monitoring
Enabling extended monitoring allows you to monitor a longer range of data through MC.
Enabling extended monitoring allows you to monitor a longer range of data through MC. This can offer insight into long-term trends in your database's health. MC can also continue to display your monitored database's dashboard while it is down.
Extended monitoring uses Kafka to stream monitoring data from your monitored databases to a single MC storage database. MC can query the storage database instead of your monitored database to render some of its charts, reducing impact on your monitored database's performance.
How extended monitoring works
By default, MC monitors your database by querying it directly for monitoring data about system activities, performance, and resource utilization. Typically, the Data collector stores all monitoring data in data collector (DC) tables. However, DC tables have limited retention periods. See Data Collector utility.
Extended monitoring stores your database's monitoring data in a dedicated storage database. Vertica streams data from your database's DC tables through Kafka servers to the storage database. To use extended monitoring, you must have access to a running Kafka server. For more how Vertica integrates with Kafka, see Apache Kafka integration.
After you set up and enable extended monitoring for a monitored database, MC renders several of your database's charts and graphs by querying the MC storage database instead of directly querying the database you are monitoring.
You can enable extended monitoring for any, or all, of your monitored databases. The MC storage database provides a single repository for monitoring data from every database that uses enabled extended monitoring.
In the following example, Kafka streams system data from two monitored databases to the storage database. MC uses the storage database to render individual dashboards for each monitored database. Be aware that MC always creates a dashboard that monitors the MC storage database.
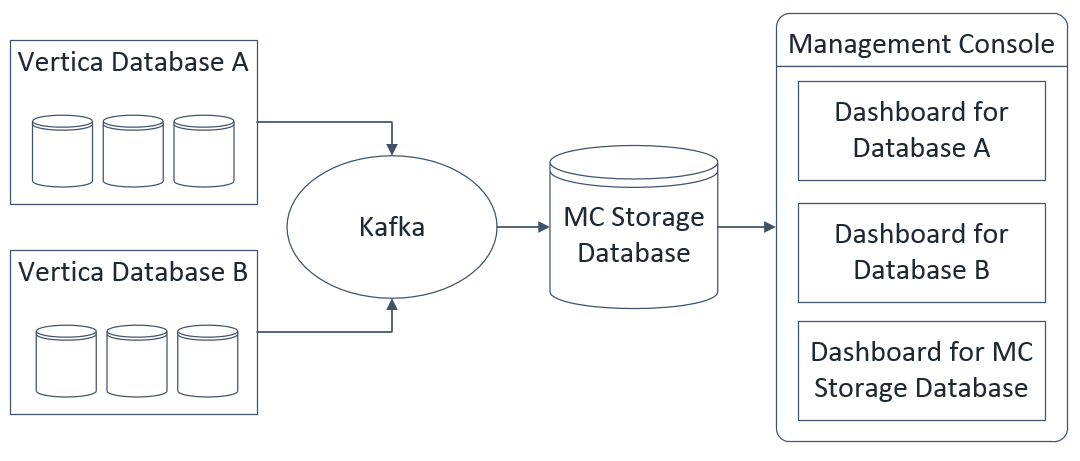
Use extended monitoring
Important
Important: To use extended monitoring, OpenText recommends installing Management Console on a host without any other Vertica databases.
When a database has extended monitoring enabled, the MC charts that use the feature display a rocket ship icon in the corner. You can use these charts to access longer-term data about your database's health or performance.
To view historical information in these charts, click the calendar icon to specify the timeframe to display. For example, if your database has been down for several hours, your charts do not display recent activity in your database. You could use the timeframe filter in the System Bottlenecks chart to see unusual resource usage occurred in your database in the hour it went down.
You can view a history of the Kafka streaming jobs loading data into the storage database. MC displays these jobs on the Load tab of your storage database's dashboard. See Viewing load history.
Set up extended monitoring
To set up extended monitoring, see Managing the storage database and Managing extended monitoring on a database.
See also
16.1 - Managing the storage database
Extended Monitoring stores your Vertica database's monitoring data in a dedicated MC storage database.
Extended Monitoring stores your Vertica database's monitoring data in a dedicated MC storage database.
To use Extended Monitoring, you must first set up the storage database and configure it for Kafka streaming. Then, turn on Extended Monitoring for any or all monitored databases.
MC automatically configures a schema for the storage database, named dcschema, which is synced with DC tables on your monitored databases.
Caution
Do not alter dcschema after MC has configured it. Altering it could cause the storage database to lose data or supply incorrect monitoring information to MC.
MC preparation
First verify that MC is not installed on the same host as a Vertica database. When Extended Monitoring is enabled, MC sharing a host with a production database can affect performance.
You must also increase the allocation of memory for the MC application server, as described in the next section. Tune the memory allocation options based on:
For example, MC requires more memory to display a week of data in a chart.
Modify memory allocation
To modify memory allocation:
-
In Management Console, select the Configuration tab on the MC Settings page.
-
Modify the following fields under Application Server JVM Settings to increase the allocation of memory for the JVM:
-
Initial Heap Size: For Extended Monitoring, a minimum value of 2 GB is recommended. (The default value is 1 GB.)
-
Maximum Heap Size: For Extended Monitoring, a minimum value of 4 GB is recommended. (The default value is 2 GB.)
-
Click Apply at the top right of the page. A prompt appears to restart MC.
-
Click OK to restart MC and save your changes.
Storage database requirements
To set up storage for Extended Monitoring, your system must meet the following prerequisites:
-
An available host, or available database whose Vertica version is the same version or a higher version of the database you plan to monitor.
-
Configured MC for Extended Monitoring (See Prepare MC to Use Extended Monitoring.)
-
Access to a deployed Kafka server (For details on installing Kafka, see the Apache Kafka site.)
Set up the storage database
To configure the storage database for Extended Monitoring, on the MC Settings page, select the MC Storage DB Setup tab. Modify the settings in each of the three areas:
1) Kafka Broker>
Enter the host name or IP addresses and ports for one or more of your deployed Kafka servers.
2) MC external storage database
Designate the storage database. You can create a new database or use an existing database.
-
Create a new database: To create a new single node cluster on an available host using a Community Edition license of Vertica, choose this option. Doing so does not affect your normal Vertica license usage.
-
Use an existing database known to MC: To designate a database you have already imported to MC, choose this option. If the schema 'dcschema' exists in the database, a dialog appears. Depending on your system needs, do one of the following:
- To keep the existing schema's data, click Append. For example, if you have already used this database for Extended Monitoring storage and are reimporting it, you can use this option to retain its historical data for continued use.
- To clear the existing schema from the database and create a fresh version of dcschema configured for Extended Monitoring storage, click Remove.
At the Database name prompt:
-
Select the database you want to use from the drop-down list.
-
To use that database for Extended Monitoring, click Prepare MC Storage database.
Advanced Streaming Options:
To change the value of the Scheduler Frame Duration, click Advanced Streaming Options. Management Console displays the Streaming Options window, which allows you to modify the Scheduler Frame Duration default that Management Console uses for Extended Monitoring..
The Scheduler Frame Duration is the amount of time given to the Kafka scheduler for each individual frame to process and run the COPY statements, after which KafkaSource terminates the COPY statements. Vertica must have enough time to complete COPY tasks within this duration.
If the frame duration is too small, you would see data loss, as the scheduler does not have sufficient time to process all the data. You may see errors or messages on Management Console’s Load page for microbatches that are not able to process the data.
On the contrary, if the frame duration is too large, the scheduler will have too much time to process the incoming data and after it has finished processing the data, it might wait for the frame duration to expire. In this case, you may see some latency in the data getting processed. In addition, the charts in Management Console may not show the data in real time and may show some latency.
You can approximate the average available time per COPY using the following equation:
TimePerCopy=(FrameDurationParallelism)/Microbatches*
This equation provides only a rough estimate. There are many factors that impact the amount of time that each COPY statement needs to run.
Vertica requires at least 100 milliseconds per COPY to function.
Note
The Advanced Scheduler options button is enabled when the Streaming is turned off. If Kafka Streaming is enabled, the Advanced Scheduler options button is disabled.
3) enable extended monitoring
Click Select database(s) for extended monitoring.
Restart the storage database
If you stop the storage database while streaming is enabled, streaming to the storage database stops automatically. You must re-enable streaming on the MC Storage DB Setup tab after you restart the storage database.
If streaming to the MC storage database is disabled while Extended Monitoring on your database is on, the Kafka retention policy determines how long streaming can remain disabled without data loss. See Managing streaming services for extended monitoring.
Discontinue the storage database
-
Select the Extended Monitoring tab in MC Settings.
-
Set Extended Monitoring for all databases to OFF.
-
Select the MC Storage DB Setup tab in MC Settings.
-
Click Disable Streaming in the MC External Storage Database section to de-activate your storage database.
-
Click Remove in the MC External Storage Database section to remove the MC Storage Database from MC.
-
Choose whether to keep or remove the data your storage database has collected:
-
Keep Data: Existing data will not removed. If you re-use this database for Extended Monitoring storage, you can choose to append new collected monitoring data to this existing data.
-
Remove Data: MC deletes its customized storage schema from the database.
On the Resource Pools tab of the storage database, you can optionally increase the memory size of SYSQUERY and KAFKA_DEFAULT_POOL. For setting resource pool parameters in MC, see Configuring resource pools with MC.
-
SYSQUERY: Reserved for temporary storage of intermediate results of queries against system monitoring and catalog tables. Default setting is 1G. For best performance for MC, set to 2G or higher.
-
KAFKA_DEFAULT_POOL: Reserved for all queries executed by the Kafka scheduler. Default setting is 30%, which is the recommended setting. By default, queries spill to the general pool when they exceed the 30% memory size.
Manage disk space
The storage database uses a customized schema, named dcschema. You can monitor these tables on MC, using the Table Utilization chart on the storage database's Activity tab. The Table Utilization chart lists all the tables in dcschema and their details, such as row counts and column properties. You can sort by row count to determine if certain tables use more disk space on your storage database. SeeMonitoring table utilization and projections with MC.
You should regularly drop partitions from dcschema if you have limited disk space for the MC storage database. MC does not automatically drop partitions from the storage database. For more information on dropping partitions, seeDropping partitions.
The table dc_execution_engine_profiles is partitioned by day. Because this table typically contains the most rows, as a best practice you should drop partitions from this table more often. The following example shows how you can specify partition key 2016-08-22 to drop a partition from dc_execution_engine_profiles.
=> SELECT DROP_PARTITIONS
  ('dcschema.dc_execution_engine_profiles', 2016-08-2, 2016-08-22);
Other than dc_execution_engine_profiles, all other tables in dcschema are partitioned by week. The next example shows you how you can drop a partition from the table dc_cpu_aggregate_by_minute, specifying the thirty-fourth week of 2016.
=> SELECT DROP_PARTITION
  ('dcschema.dc_cpu_aggregate_by_minute', 201634, 201634);
Manage client sessions
By default Vertica allows 50 client sessions and an additional five administrator sessions per node. If you reach the limit on the storage database, MC switches back to default monitoring, and does not use Extended Monitoring data from the storage database.
You can optionally configure the maximum number of client sessions that can run on a single database cluster node on your MC storage database's Settings page:
-
On the storage database dashboard, click the Settings page.
-
Choose the General tab.
-
Enter a value in the Maximum client sessions field. Valid values are 0–1000.
For more details about managing client connections in MC, see Configuring Management Console.
See also
16.2 - Managing extended monitoring on a database
When you enable extended monitoring on your Vertica database, monitoring data from your database streams through Kafka servers to the MC storage database.
When you enable extended monitoring on your Vertica database, monitoring data from your database streams through Kafka servers to the MC storage database.
You can enable streaming for any or all databases that MC monitors.
Extended monitoring prerequisites
Before you can enable extended monitoring, your system must meet these prerequisites:
Enable extended monitoring
-
Select the Extended Monitoring tab on MC Settings.
The Extended Monitoring page displays all databases monitored by MC.
-
In the Memory Limit field for the database of your choice, set the maximum amount of memory the database can use for streaming monitoring data. For more about the memory limit, see Managing streaming services for extended monitoring.
-
In the Extended Monitoring column, select ON to enable streaming for the database of your choice.
The database begins streaming its monitoring data to the Kafka server.
User access
When you change user permissions for a database using extended monitoring, the user access policy on the storage database does not automatically update. On the Extended Monitoring page, in the user access column for your database, click Refresh to sync the policy.
If you rename a Vertica user, you must re-map the user in MC Settings before refreshing the user access policy.
See also
16.3 - Managing streaming services for extended monitoring
When extended monitoring is enabled, Vertica streams data from your database through Kafka servers to the storage database.
When extended monitoring is enabled, Vertica streams data from your database through Kafka servers to the storage database.
For additional parameters that optimize the performance of Kafka with Vertica, see Kafka and Vertica configuration settings.
View streaming details in MC
Click the Load tab on your database's MC dashboard to see the Data Load Activity page. On this page, the Continuous tab displays details about all continuous loading jobs for extended monitoring. You can use this page to monitor whether your extended monitoring data is streaming successfully to the MC storage database.
See Viewing load history for more about the Data Load Activity page.
Tip
Tip: If you do not see loading jobs for extended monitoring, verify that you have selected Show MC data collector monitoring streams at the top of the Continuous tab.
Prevent data loss
The Memory Limit buffer allows you to restart the Kafka server without data loss. Vertica queues the streamed data until you restart the Kafka server. When the Kafka server remains down for an extended period of time, data loss occurs when the queue of streamed data exceeds the buffer. You set the buffer size on the Extended Monitoring tab when you enable extended monitoring for a database. See Managing extended monitoring on a database.
The Kafka retention policy determines when data loss occurs during the following scenarios:
The Kafka retention policy can allow you to restart these extended monitoring components without data loss. The Kafka server retains the data while the listed components are disabled. Data loss occurs when the streamed data exceeds the Kafka retention policy's log size or retention time limits. See the Apache Kafka documentation for how to configure the retention policy.
Changing the Kafka server
Be aware that when you change Kafka servers for extended monitoring on the MC Storage DB Setup page, you must disable all extended monitoring processes and re-configure the MC storage database. For storage database setup instructions, see Managing the storage database.
See also