Viewing depot activity
The At A Glance screen provides a high level view of depot activity. The screen is divided into several sections:
-
Current Depot Usage summarizes depot attributes and usage statistics.
-
Depot Configuration shows how the depot is configured.
-
User Queries Depot Hits and Misses shows how queries have interacted with the depot over time.
-
Communal Storage Access Calls shows frequency of calls to communal storage.
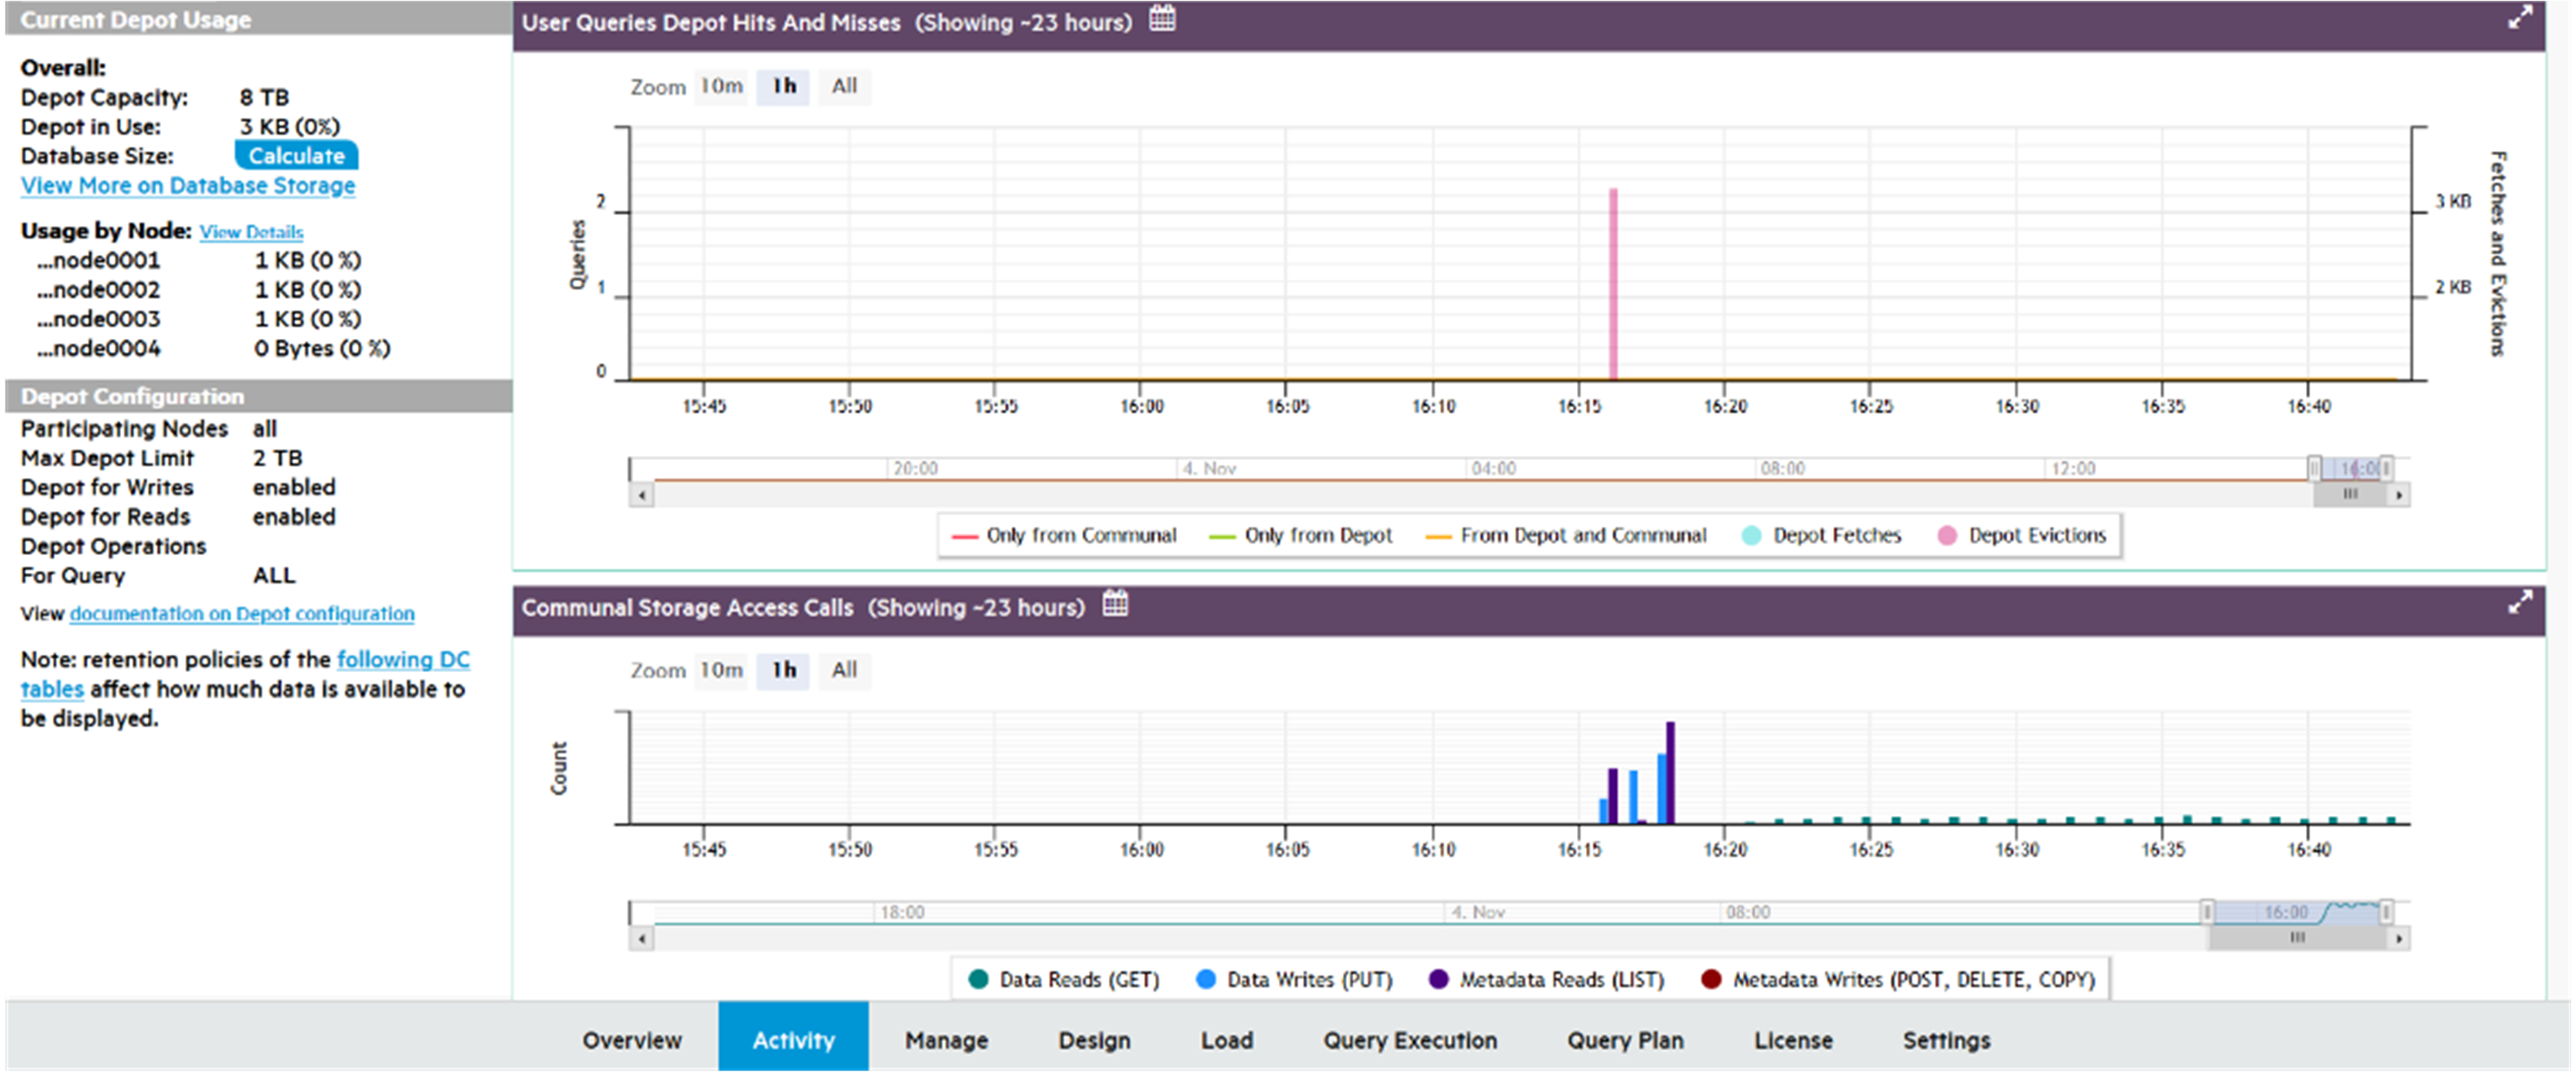
Current depot usage
Displays a summary of depot attributes and usage statistics:
Overall
-
Depot Capacity: Total depot capacity for all nodes in the database, added together.
-
Depot in Use: Total depot space currently in use, on all nodes in the database added together.
-
Database Size: Select Calculate to show the total size of the database, in GB.
-
View More on Database Storage: Click to see the Storage View tab, with details on the storage for this database.
Usage by node
-
Lists the number of bytes in the depot and percentage used, for each node in the database.
-
View More: Click to display depot usage for individual nodes.
Depot configuration
Provides information about how the depot is configured:
-
Participating Nodes: Number of nodes covered by these statistics.
-
Max Depot Limit: Total amount of depot space on all participating nodes.
-
Depot for Writes: Specifies whether the depot is Enabled or Disabled for write operations.
-
Depot for Reads: Specifies whether the depot is Enabled or Disabled for read operations.
-
Depot Operations for Query: Displays how system parameter DepotOperationsForQuery is set. This parameter specifies behavior when the depot does not contain queried file data, one of the following:
-
ALL(default): Fetch file data from communal storage, if necessary displace existing files by evicting them from the depot. -
FETCHES: Fetch file data from communal storage only if space is available; otherwise, read the queried data directly from communal storage. -
NONE: Do not fetch file data to the depot, read the queried data directly from communal storage.
-
-
A link for querying internal DC tables, to obtain retention limits on depot activity such as Depot Reads.
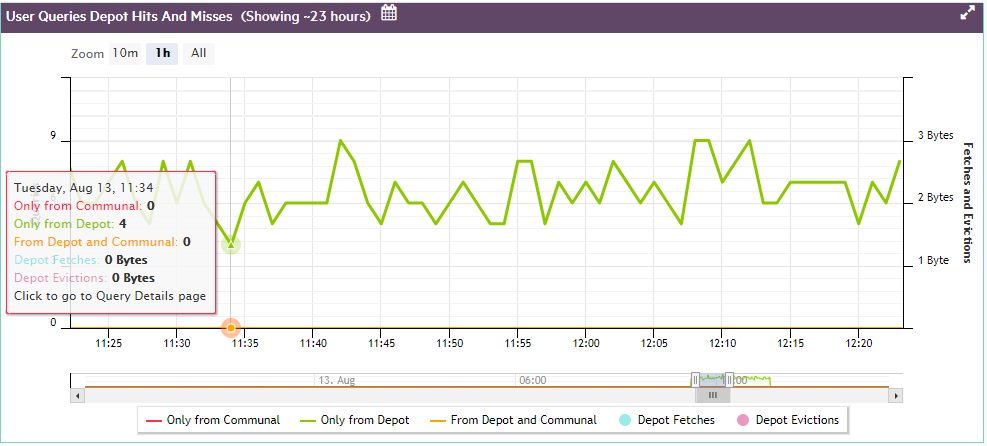
User queries depot hits and misses
For optimal performance, the majority of queries should access data that is locally stored on the depot. To maximize depot access, make sure that your depot is large enough to accommodate frequently accessed data. Otherwise, Vertica must access communal storage more often to retrieve required data, which can significantly affect query performance.
User Queries Depot Hits and Misses helps you evaluate how queries have interacted with the depot over time.
-
Color-coded graph lines show how many queries were accessing the depot or communal storage, or both, at any given time.
-
The left y-axis indicates the number of queries.
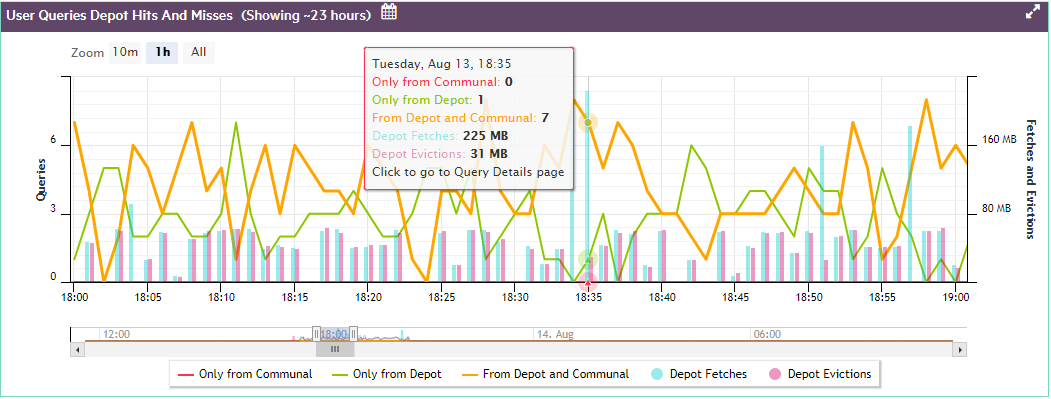
Depot fetches and evictions
When a query fetches data from communal storage to a depot that lacks enough space for the new data, Vertica attempts to evict older data. The User Queries Depot Hits and Misses chart can help you monitor churn—that is, how many files are evicted from the depot, and how often:
-
Colored bars show the moments of depot fetches and evictions, as measured in megabytes.
-
The right y-axis shows how much data was fetched or evicted.
If you observe that queries are consistently slower due to accessing communal storage, and notice the depot keeps experiencing frequent churn, it's likely that you need to increase depot size.
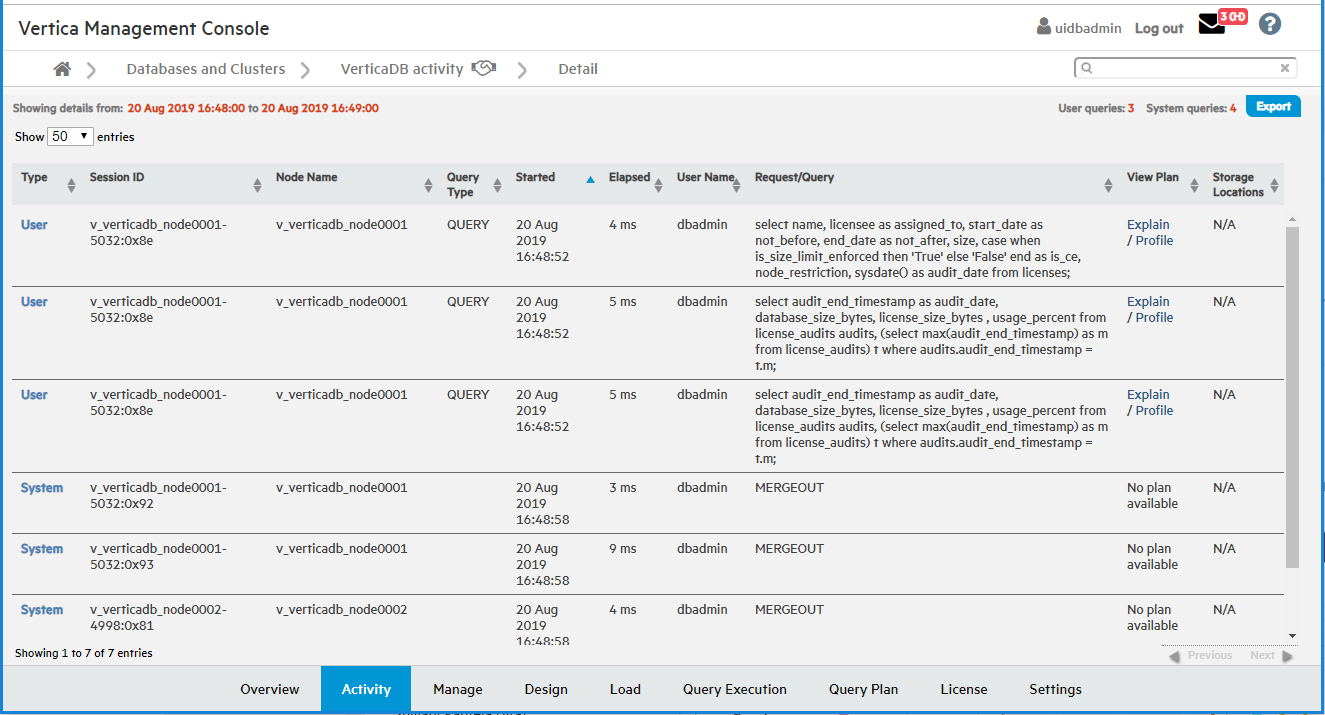
Depot query details
-
Hover over a point on the query line to see details about the number of queries that ran.
-
Hover over a Fetches or Evictions bar graph to see details about the number of bytes fetched or evicted.
-
Click the line or bar to view the Query Details page, which provides information about every query that ran in the selected timespan.
The following example shows a depot size sufficient to run all queries in the depot:
The next example shows what happens when the depot is too small for ongoing query activity, so a number of queries are forced to fetch their data from communal storage.
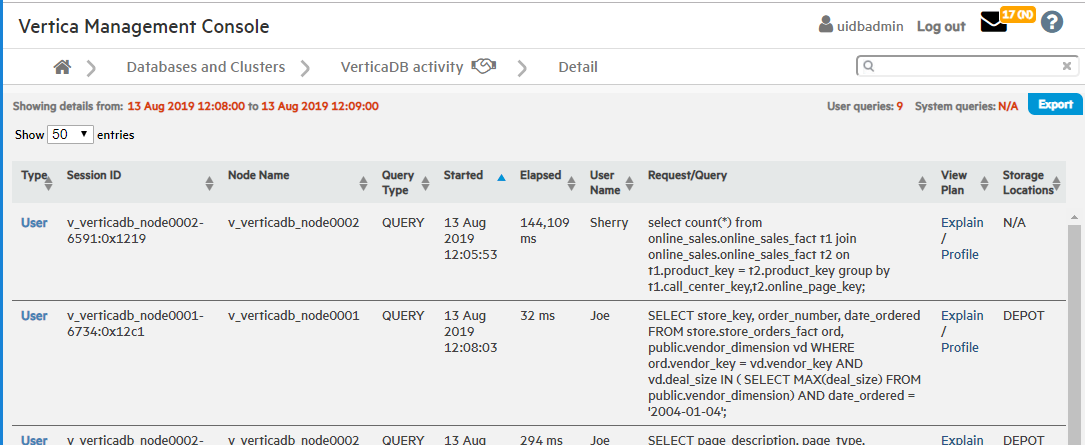
If you click on any point on the line, MC opens a Query Detail window that shows:
-
All queries represented by that point
-
Details for each query
Communal storage access calls
Shows how many communal storage access calls (for example, AWS S3 API calls) of each type your database has executed over a given time span, one of the following:
-
Data Reads (GET)
-
Data Writes (PUT
-
Metadata Reads (LIST)
-
Metadata Writes (POST, DELETE, COPY)
Hover over any point on the Communal Storage Access Calls chart, to view a summary of data about that point. For example, if your cluster is on AWS, the summary lists how many of each AWS S3 API call type were executed in the selected timespan.
Click on any point on the bar graph to view details on:
-
All queries that ran during the selected timespan. These queries executed the API calls listed for that timespan on the Communal Storage Access Calls chart.
-
Details on each query.
For example: