This is the multi-page printable view of this section.
Click here to print.
Return to the regular view of this page.
Monitoring depot activity with MC
The depot is a cache-like component on each node that downloads and stores local copies of table data.
The depot is a cache-like component on each node that downloads and stores local copies of table data. Queries that can access the data that they need on the depot, instead of fetching it from communal storage, generally execute much faster. If your database is in Eon Mode, you can use the Depot Activity page to view depot settings and evaluate how efficiently it handles queries and load activity.
To view depot settings and activity, navigate to Database > Activity > Depot Activity Monitoring. The Depot Activity page has the following tabs:
1 - Why monitor the depot?
If you run an Eon Mode database on a cloud platform such as AWS, monitoring your depot in MC can help you tune performance and reduce expenses.
If you run an Eon Mode database on a cloud platform such as AWS, monitoring your depot in MC can help you tune performance and reduce expenses. MC can help address the following questions:
To access depot monitoring capabilities: from the MC home page, navigate to Database > Activity > Depot Activity Monitoring. See Monitoring depot activity with MC.
How often do queries hit the depot versus the S3 bucket?
Queries run faster when they access node-based depot data rather than fetch it from communal storage. For details, see Query Depot Hits and Misses
Is the depot optimally sized?
To optimize your queries for speed, you might want to resize the depot to fit your query workload. This ensures that queries do not need to spend extra time fetching data from the communal repository on S3. The Eon meta-function ALTER_LOCATION_SIZE lets you change depot size on one node, all nodes in a subcluster, or all nodes in the database. The following statement resizes all depots in the database to 80MB:
=> SELECT alter_location_size('depot', '','80%');
 alter_location_size
---------------------
 depotSize changed.
(1 row)
On the Depot Activity Monitoring screen, in the Communal Storage Access Calls chart, MC displays how many of each type of API call your queries executed in a given timespan. To see details on which queries were running, click on any point on the chart.
What is the current depot usage on each node?
The Depot Content tab of the Depot Activity Monitoring page provides detailed information about how each table is using the depot space on the cluster nodes.
On the Depot Content tab, when you select a row, you are selecting the table depot content on a node. MC loads the details for that table for that node in the bottom section of the page, to show depot content for the selected table, broken down by either projections or partitions on a given node.
2 - Viewing depot activity
The At A Glance screen provides a high level view of depot activity.
The At A Glance screen provides a high level view of depot activity. The screen is divided into several sections:
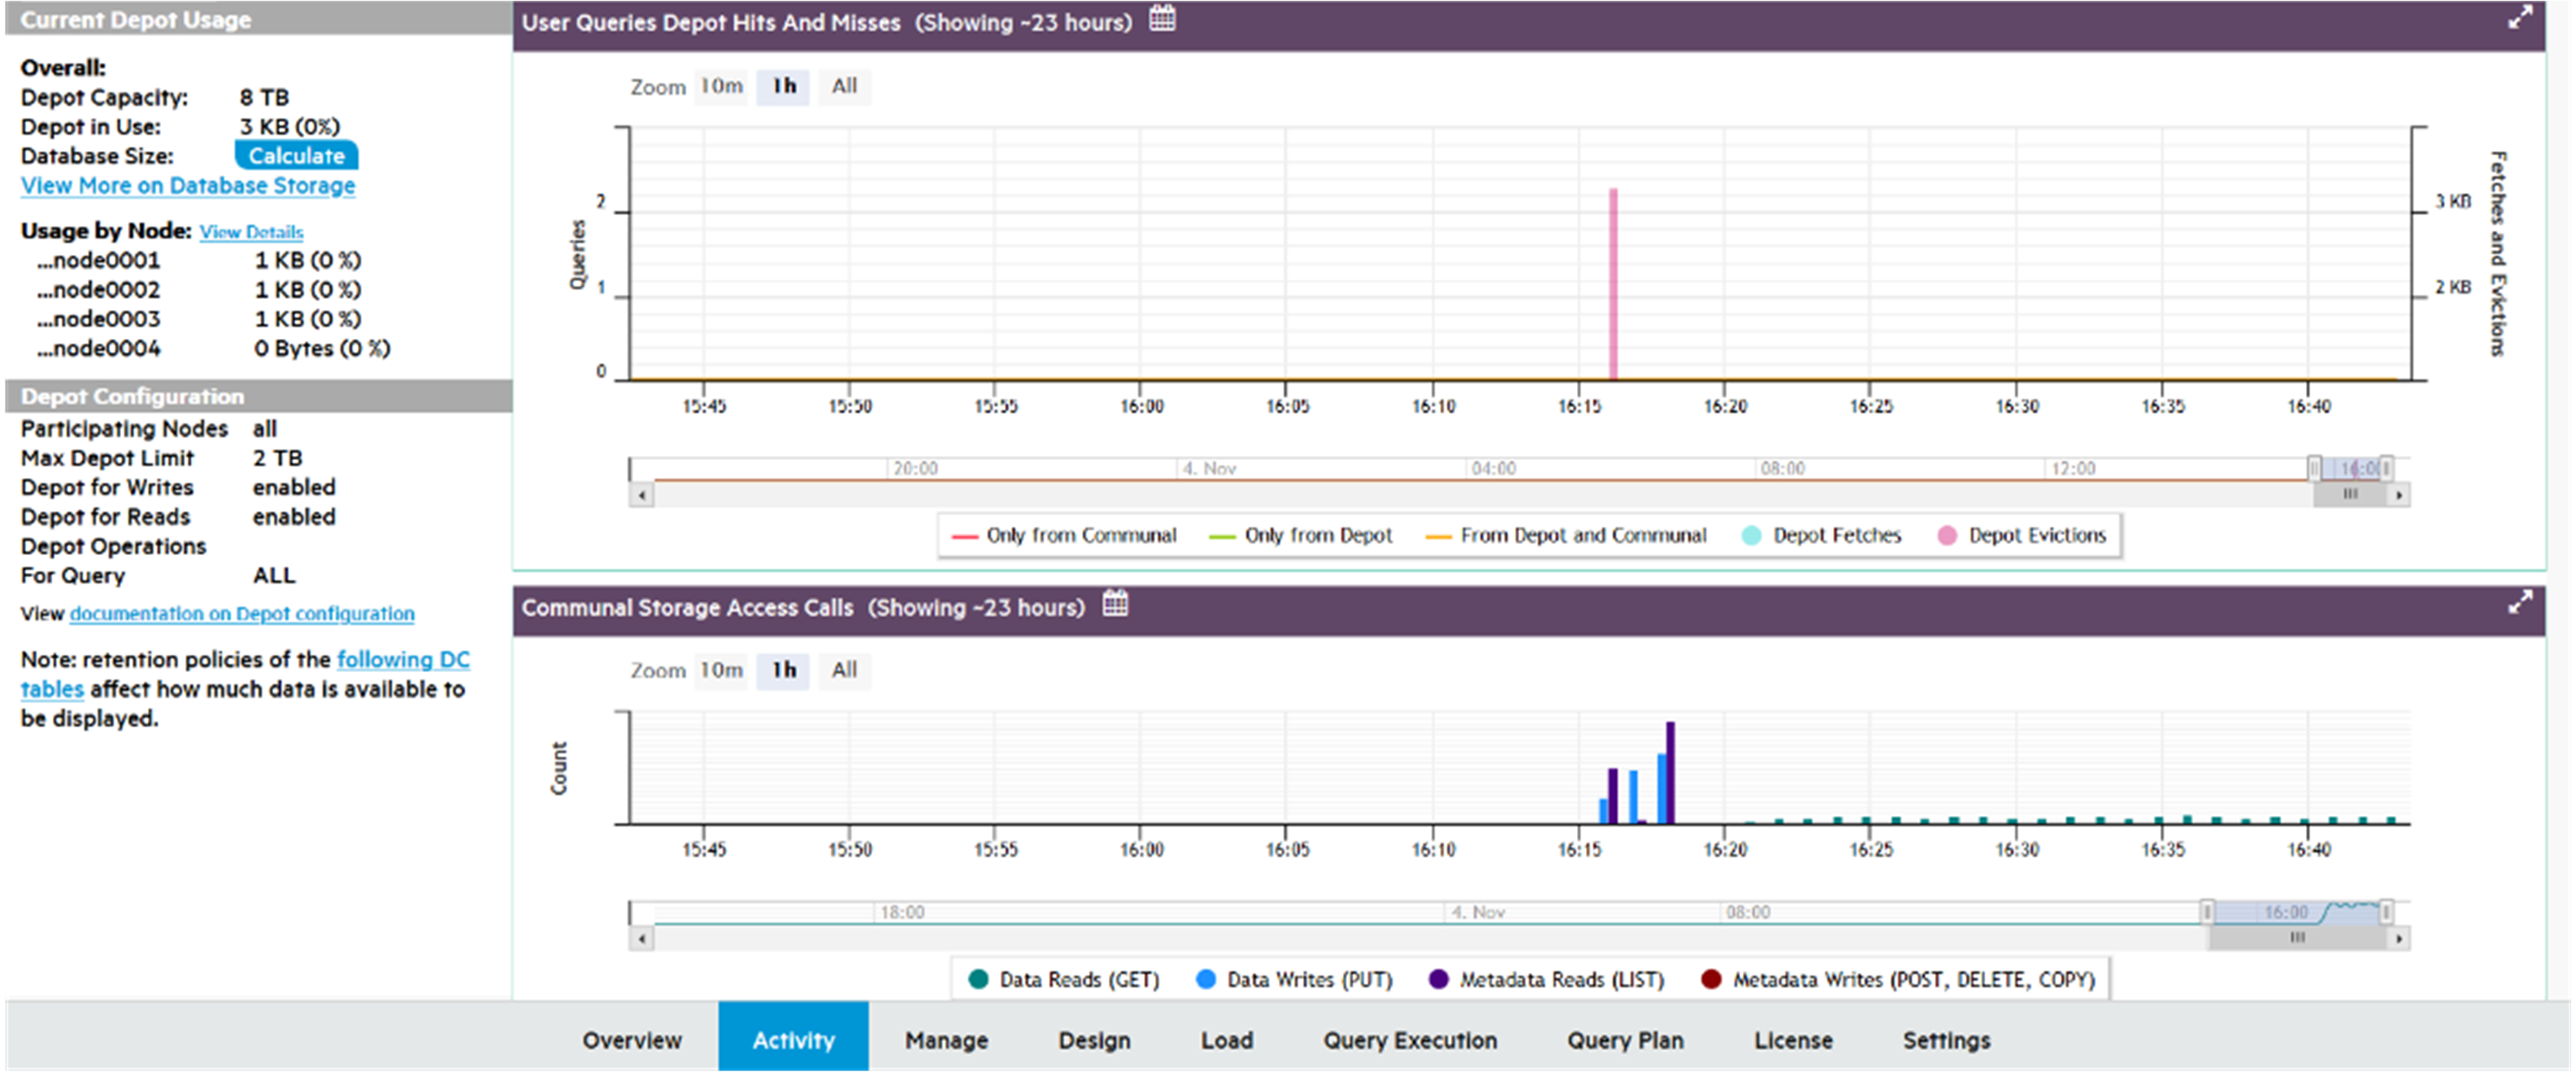
Current depot usage
Displays a summary of depot attributes and usage statistics:
Overall
-
Depot Capacity: Total depot capacity for all nodes in the database, added together.
-
Depot in Use: Total depot space currently in use, on all nodes in the database added together.
-
Database Size: Select Calculate to show the total size of the database, in GB.
-
View More on Database Storage: Click to see the Storage View tab, with details on the storage for this database.
Usage by node
-
Lists the number of bytes in the depot and percentage used, for each node in the database.
-
View More: Click to display depot usage for individual nodes.
Depot configuration
Provides information about how the depot is configured:
-
Participating Nodes: Number of nodes covered by these statistics.
-
Max Depot Limit: Total amount of depot space on all participating nodes.
-
Depot for Writes: Specifies whether the depot is Enabled or Disabled for write operations.
-
Depot for Reads: Specifies whether the depot is Enabled or Disabled for read operations.
-
Depot Operations for Query: Displays how system parameter DepotOperationsForQuery is set. This parameter specifies behavior when the depot does not contain queried file data, one of the following:
-
ALL (default): Fetch file data from communal storage, if necessary displace existing files by evicting them from the depot.
-
FETCHES: Fetch file data from communal storage only if space is available; otherwise, read the queried data directly from communal storage.
-
NONE: Do not fetch file data to the depot, read the queried data directly from communal storage.
-
A link for querying internal DC tables, to obtain retention limits on depot activity such as Depot Reads.
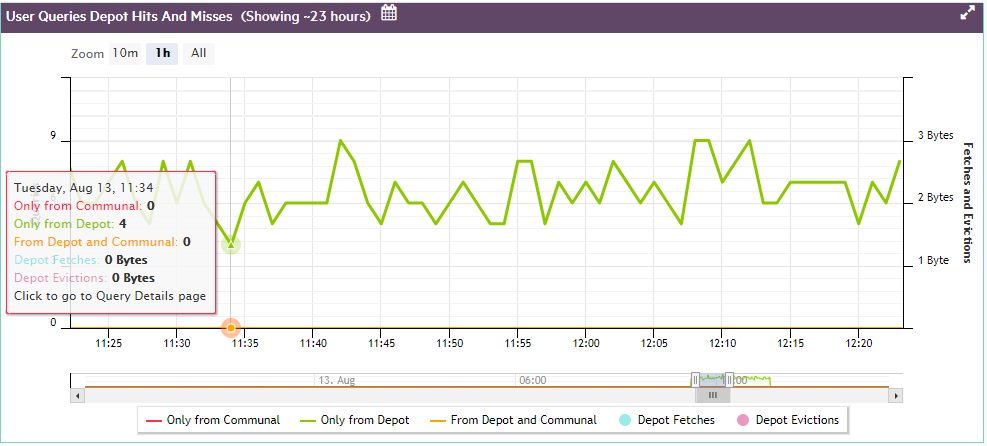
User queries depot hits and misses
For optimal performance, the majority of queries should access data that is locally stored on the depot. To maximize depot access, make sure that your depot is large enough to accommodate frequently accessed data. Otherwise, Vertica must access communal storage more often to retrieve required data, which can significantly affect query performance.
User Queries Depot Hits and Misses helps you evaluate how queries have interacted with the depot over time.
-
Color-coded graph lines show how many queries were accessing the depot or communal storage, or both, at any given time.
-
The left y-axis indicates the number of queries.
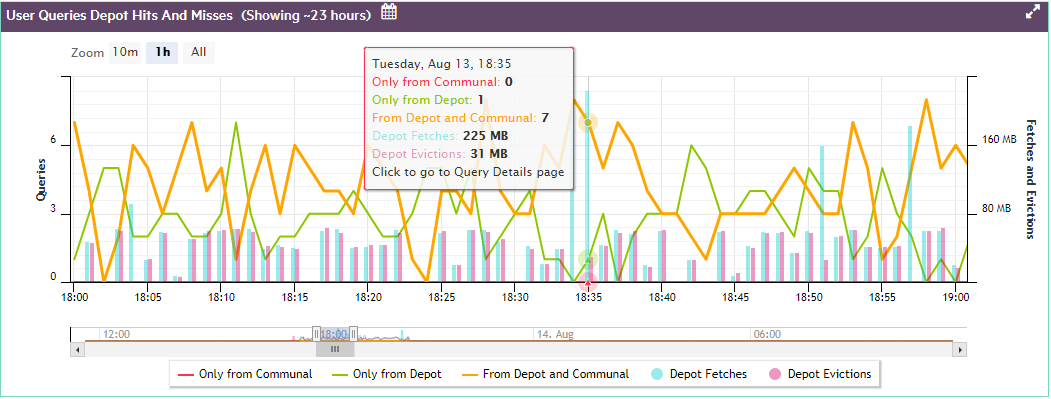
Depot fetches and evictions
When a query fetches data from communal storage to a depot that lacks enough space for the new data, Vertica attempts to evict older data. The User Queries Depot Hits and Misses chart can help you monitor churn—that is, how many files are evicted from the depot, and how often:
-
Colored bars show the moments of depot fetches and evictions, as measured in megabytes.
-
The right y-axis shows how much data was fetched or evicted.
If you observe that queries are consistently slower due to accessing communal storage, and notice the depot keeps experiencing frequent churn, it's likely that you need to increase depot size.
Depot query details
-
Hover over a point on the query line to see details about the number of queries that ran.
-
Hover over a Fetches or Evictions bar graph to see details about the number of bytes fetched or evicted.
-
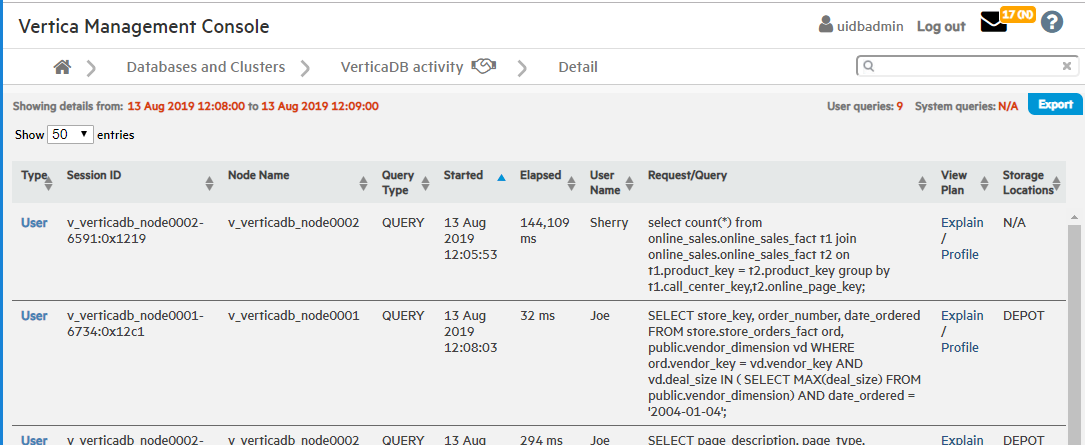
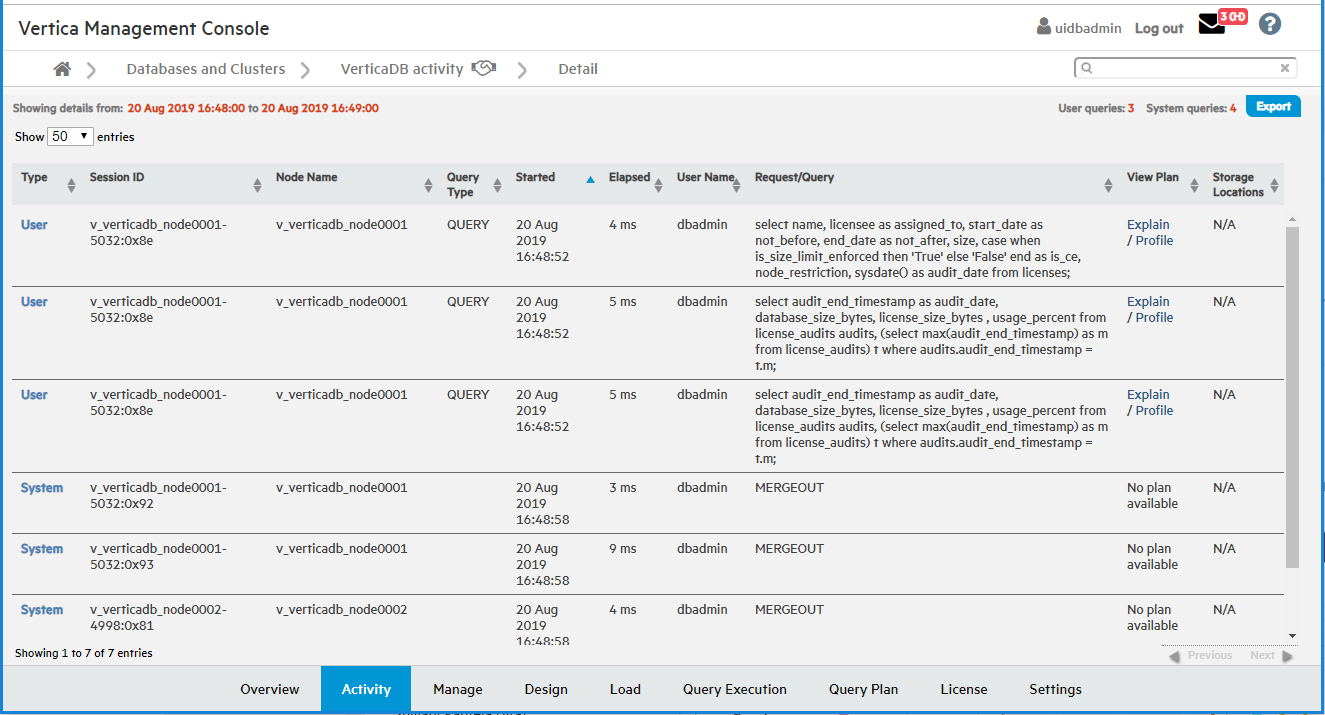
Click the line or bar to view the Query Details page, which provides information about every query that ran in the selected timespan.
The following example shows a depot size sufficient to run all queries in the depot:
The next example shows what happens when the depot is too small for ongoing query activity, so a number of queries are forced to fetch their data from communal storage.
If you click on any point on the line, MC opens a Query Detail window that shows:
Communal storage access calls
Shows how many communal storage access calls (for example, AWS S3 API calls) of each type your database has executed over a given time span, one of the following:
Hover over any point on the Communal Storage Access Calls chart, to view a summary of data about that point. For example, if your cluster is on AWS, the summary lists how many of each AWS S3 API call type were executed in the selected timespan.
Click on any point on the bar graph to view details on:
For example:
3 - Viewing depot efficiency
The Depot Efficiency tab provides several graphics that can help users quickly determine whether the depot is properly tuned.
The Depot Efficiency tab provides several graphics that can help users quickly determine whether the depot is properly tuned.
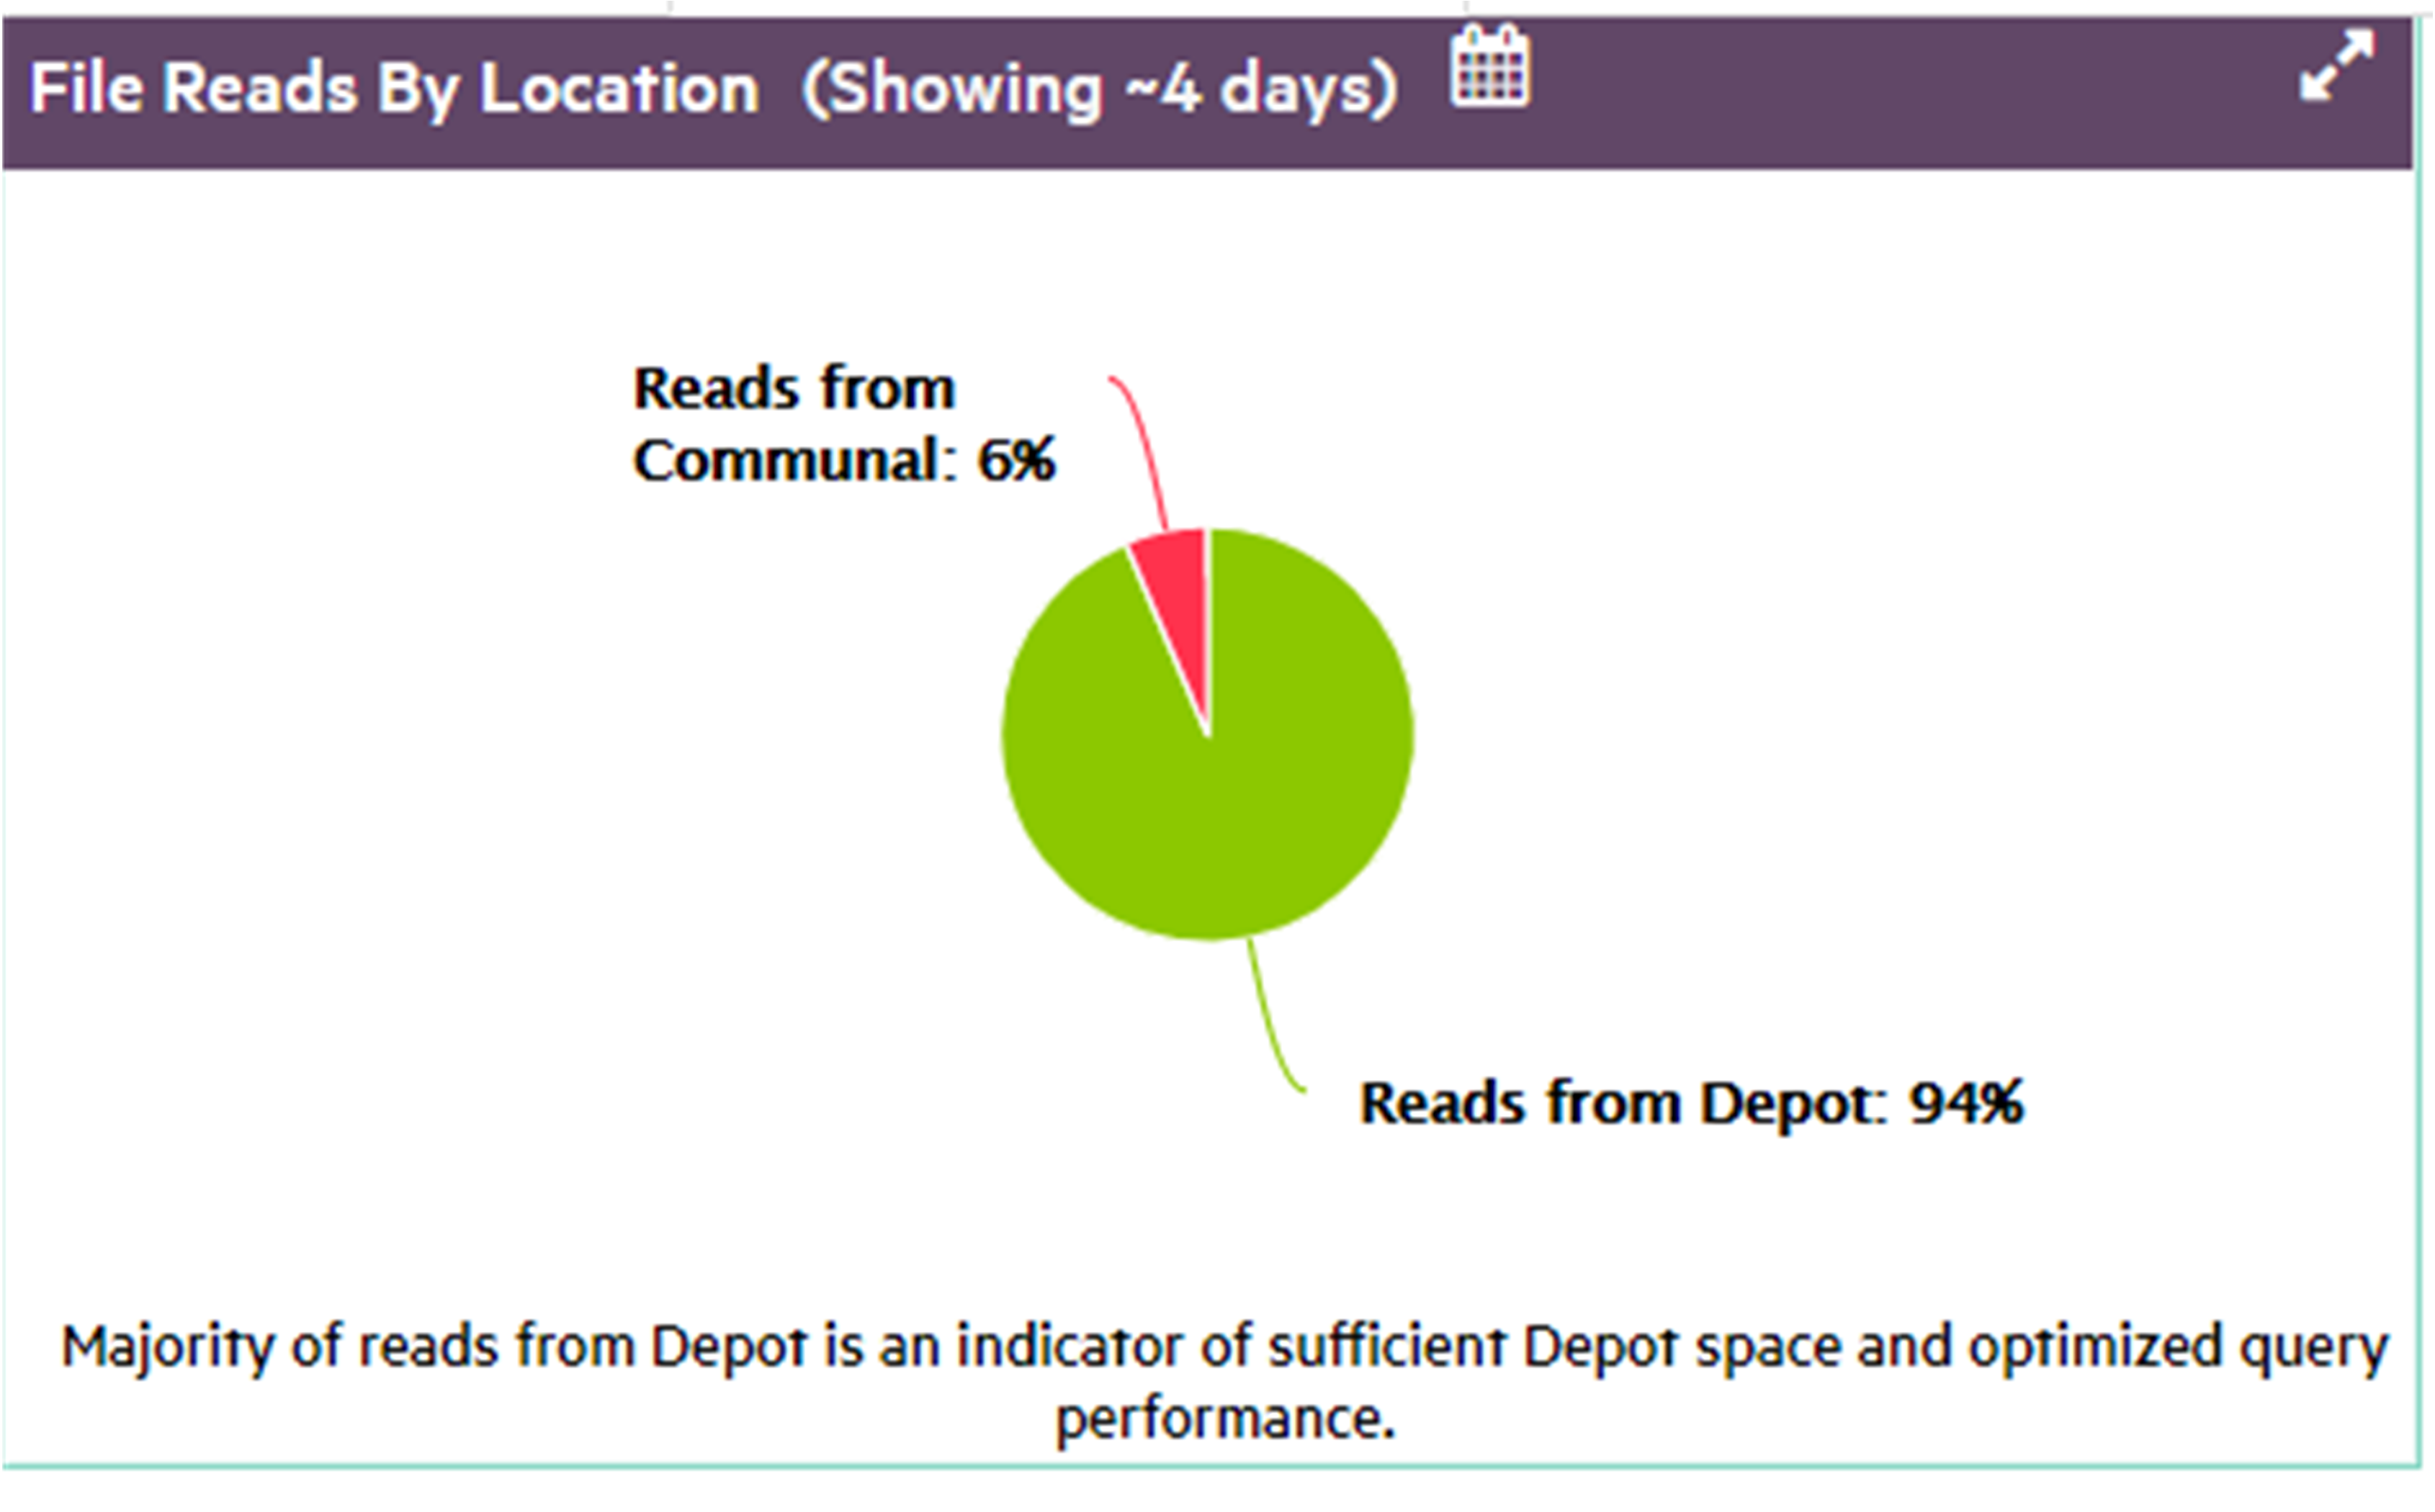
File reads by location
Shows the percentage of reads from depot and communal storage over the specified time span. In general, you want the majority of queries and other read operations to obtain their data from the depot rather than communal storage, as verified by the chart below.If communal storage shows a large percentage of file reads, it's likely that you need to increase the depot size.
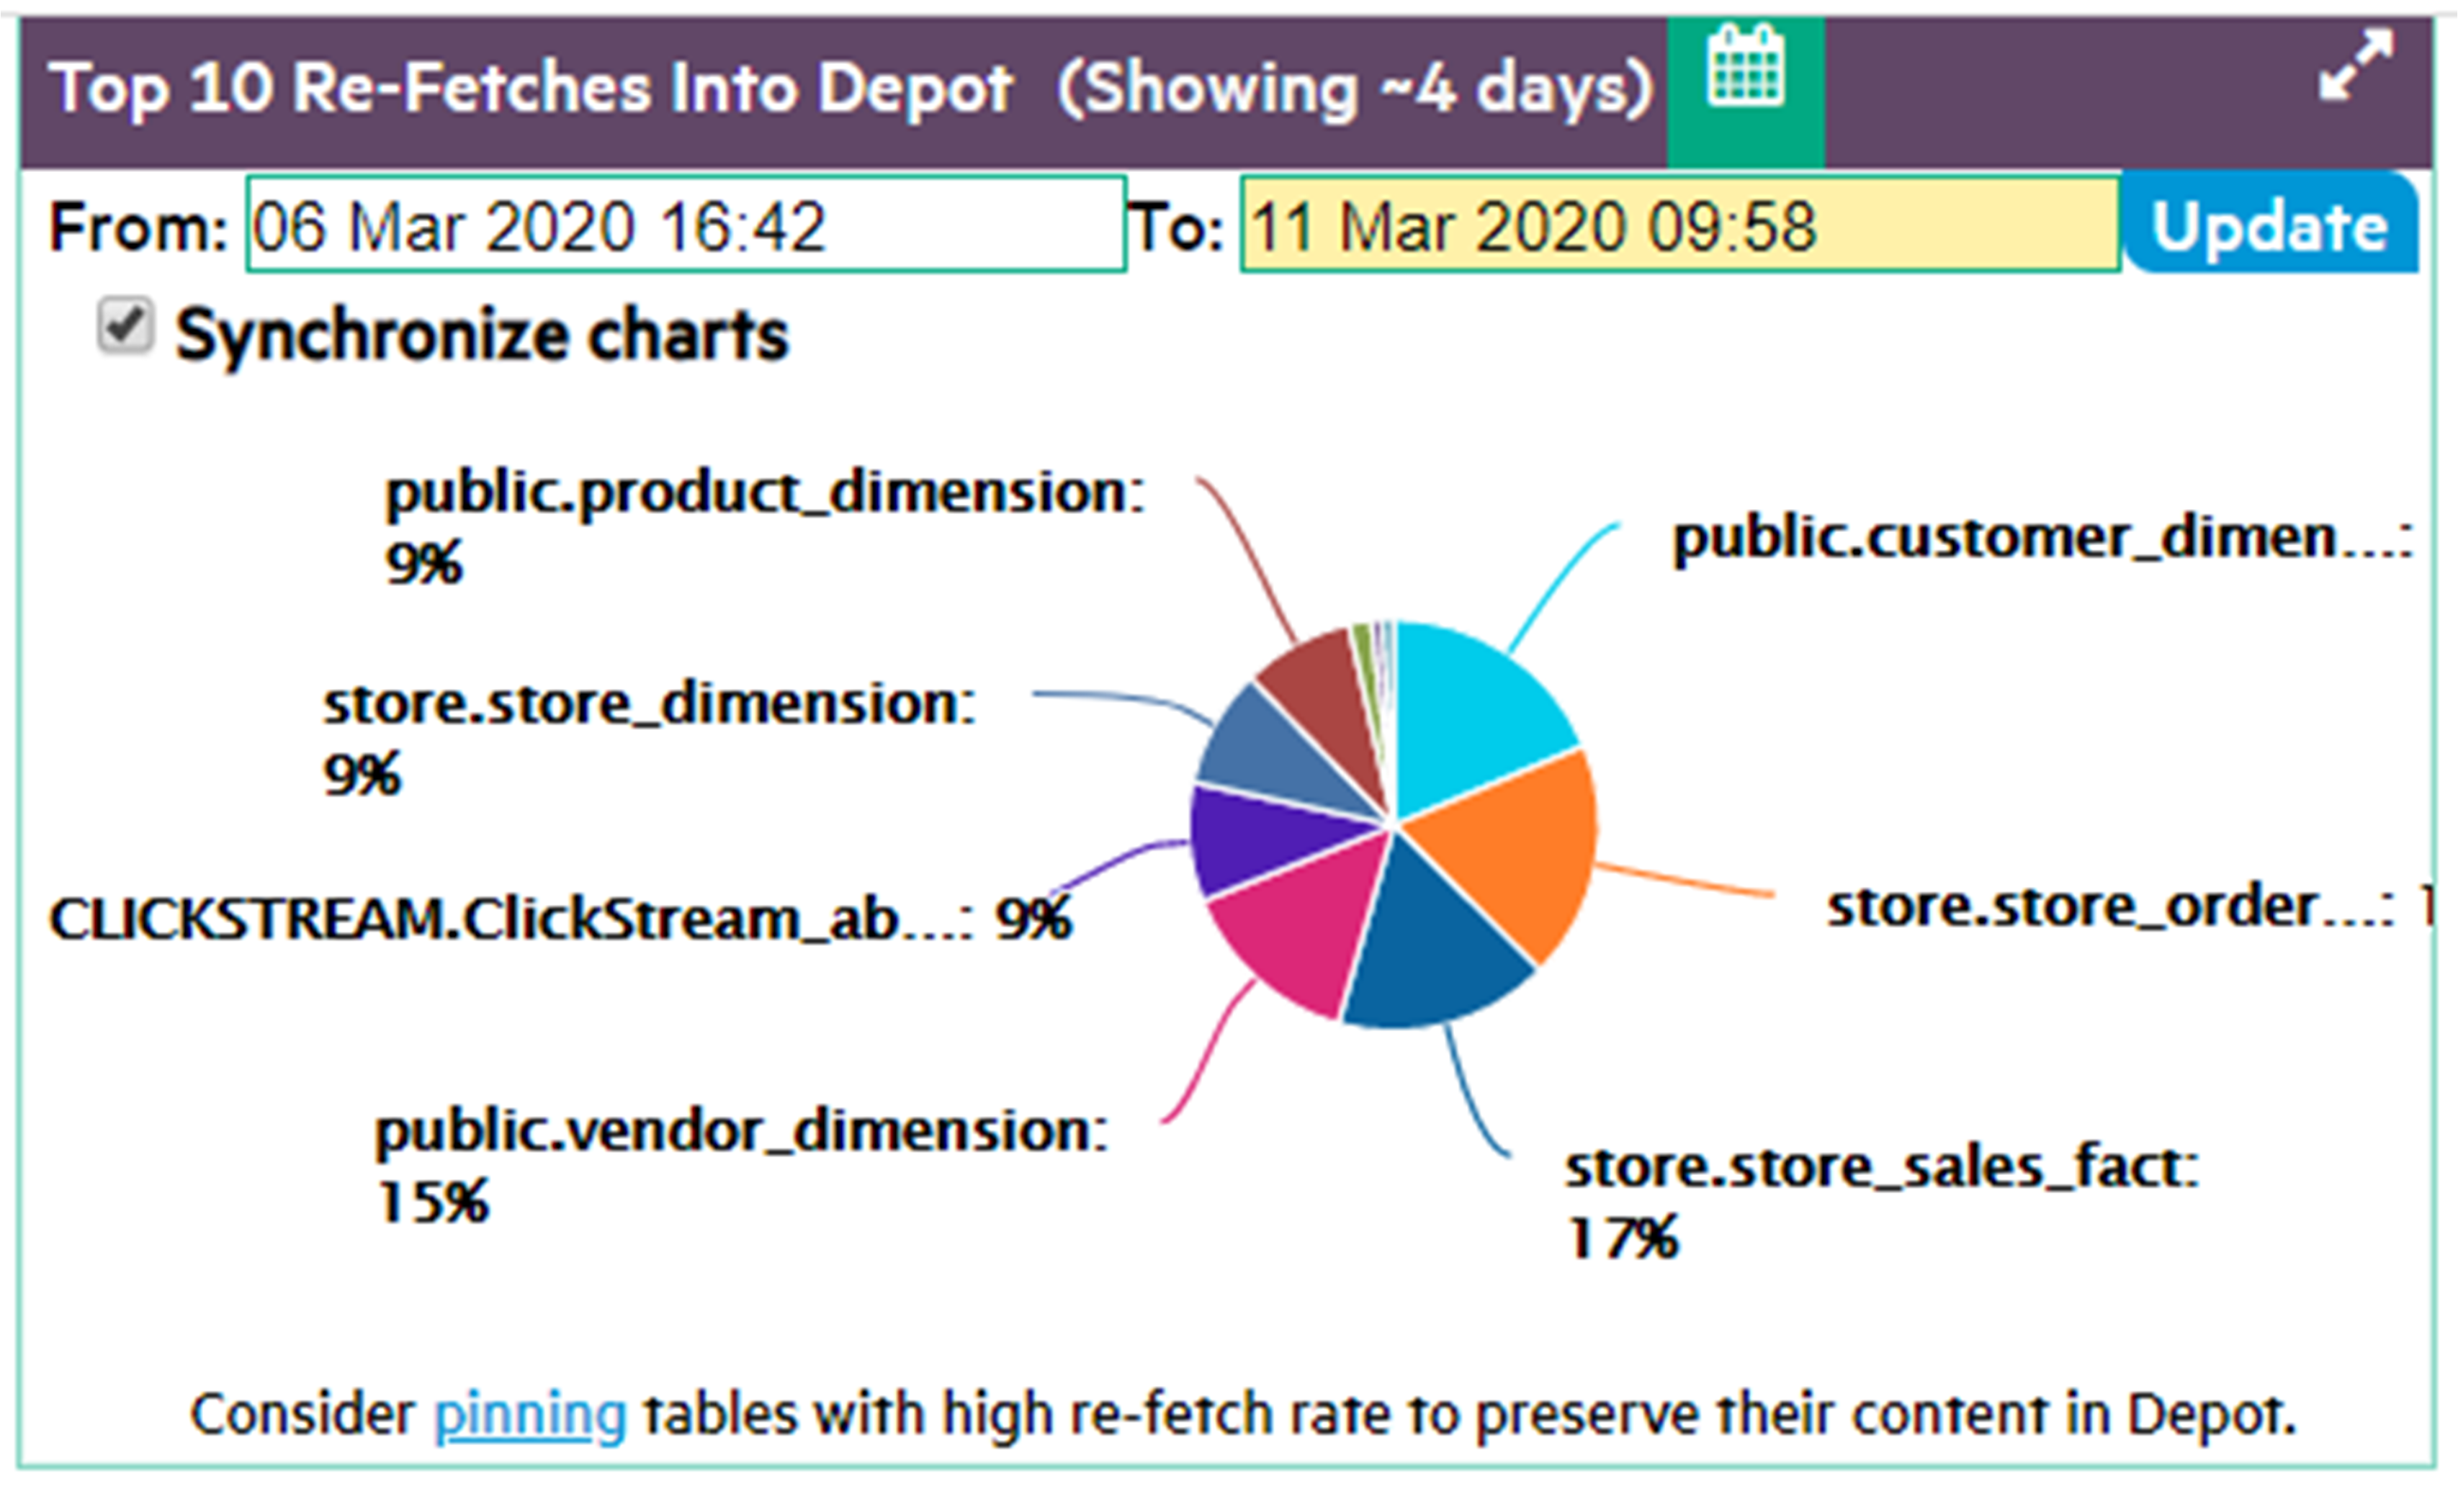
Top 10 re-fetches in depot
Vertica evicts data from the depot as needed to provide room for new data, and expedite request processing. Depot fetches and evictions are expected in a busy database. However, you generally want to avoid repeated evictions and fetches of the same table data. If this happens, consider increasing the depot size, or pinning the table or frequently accessed partitions to the depot.
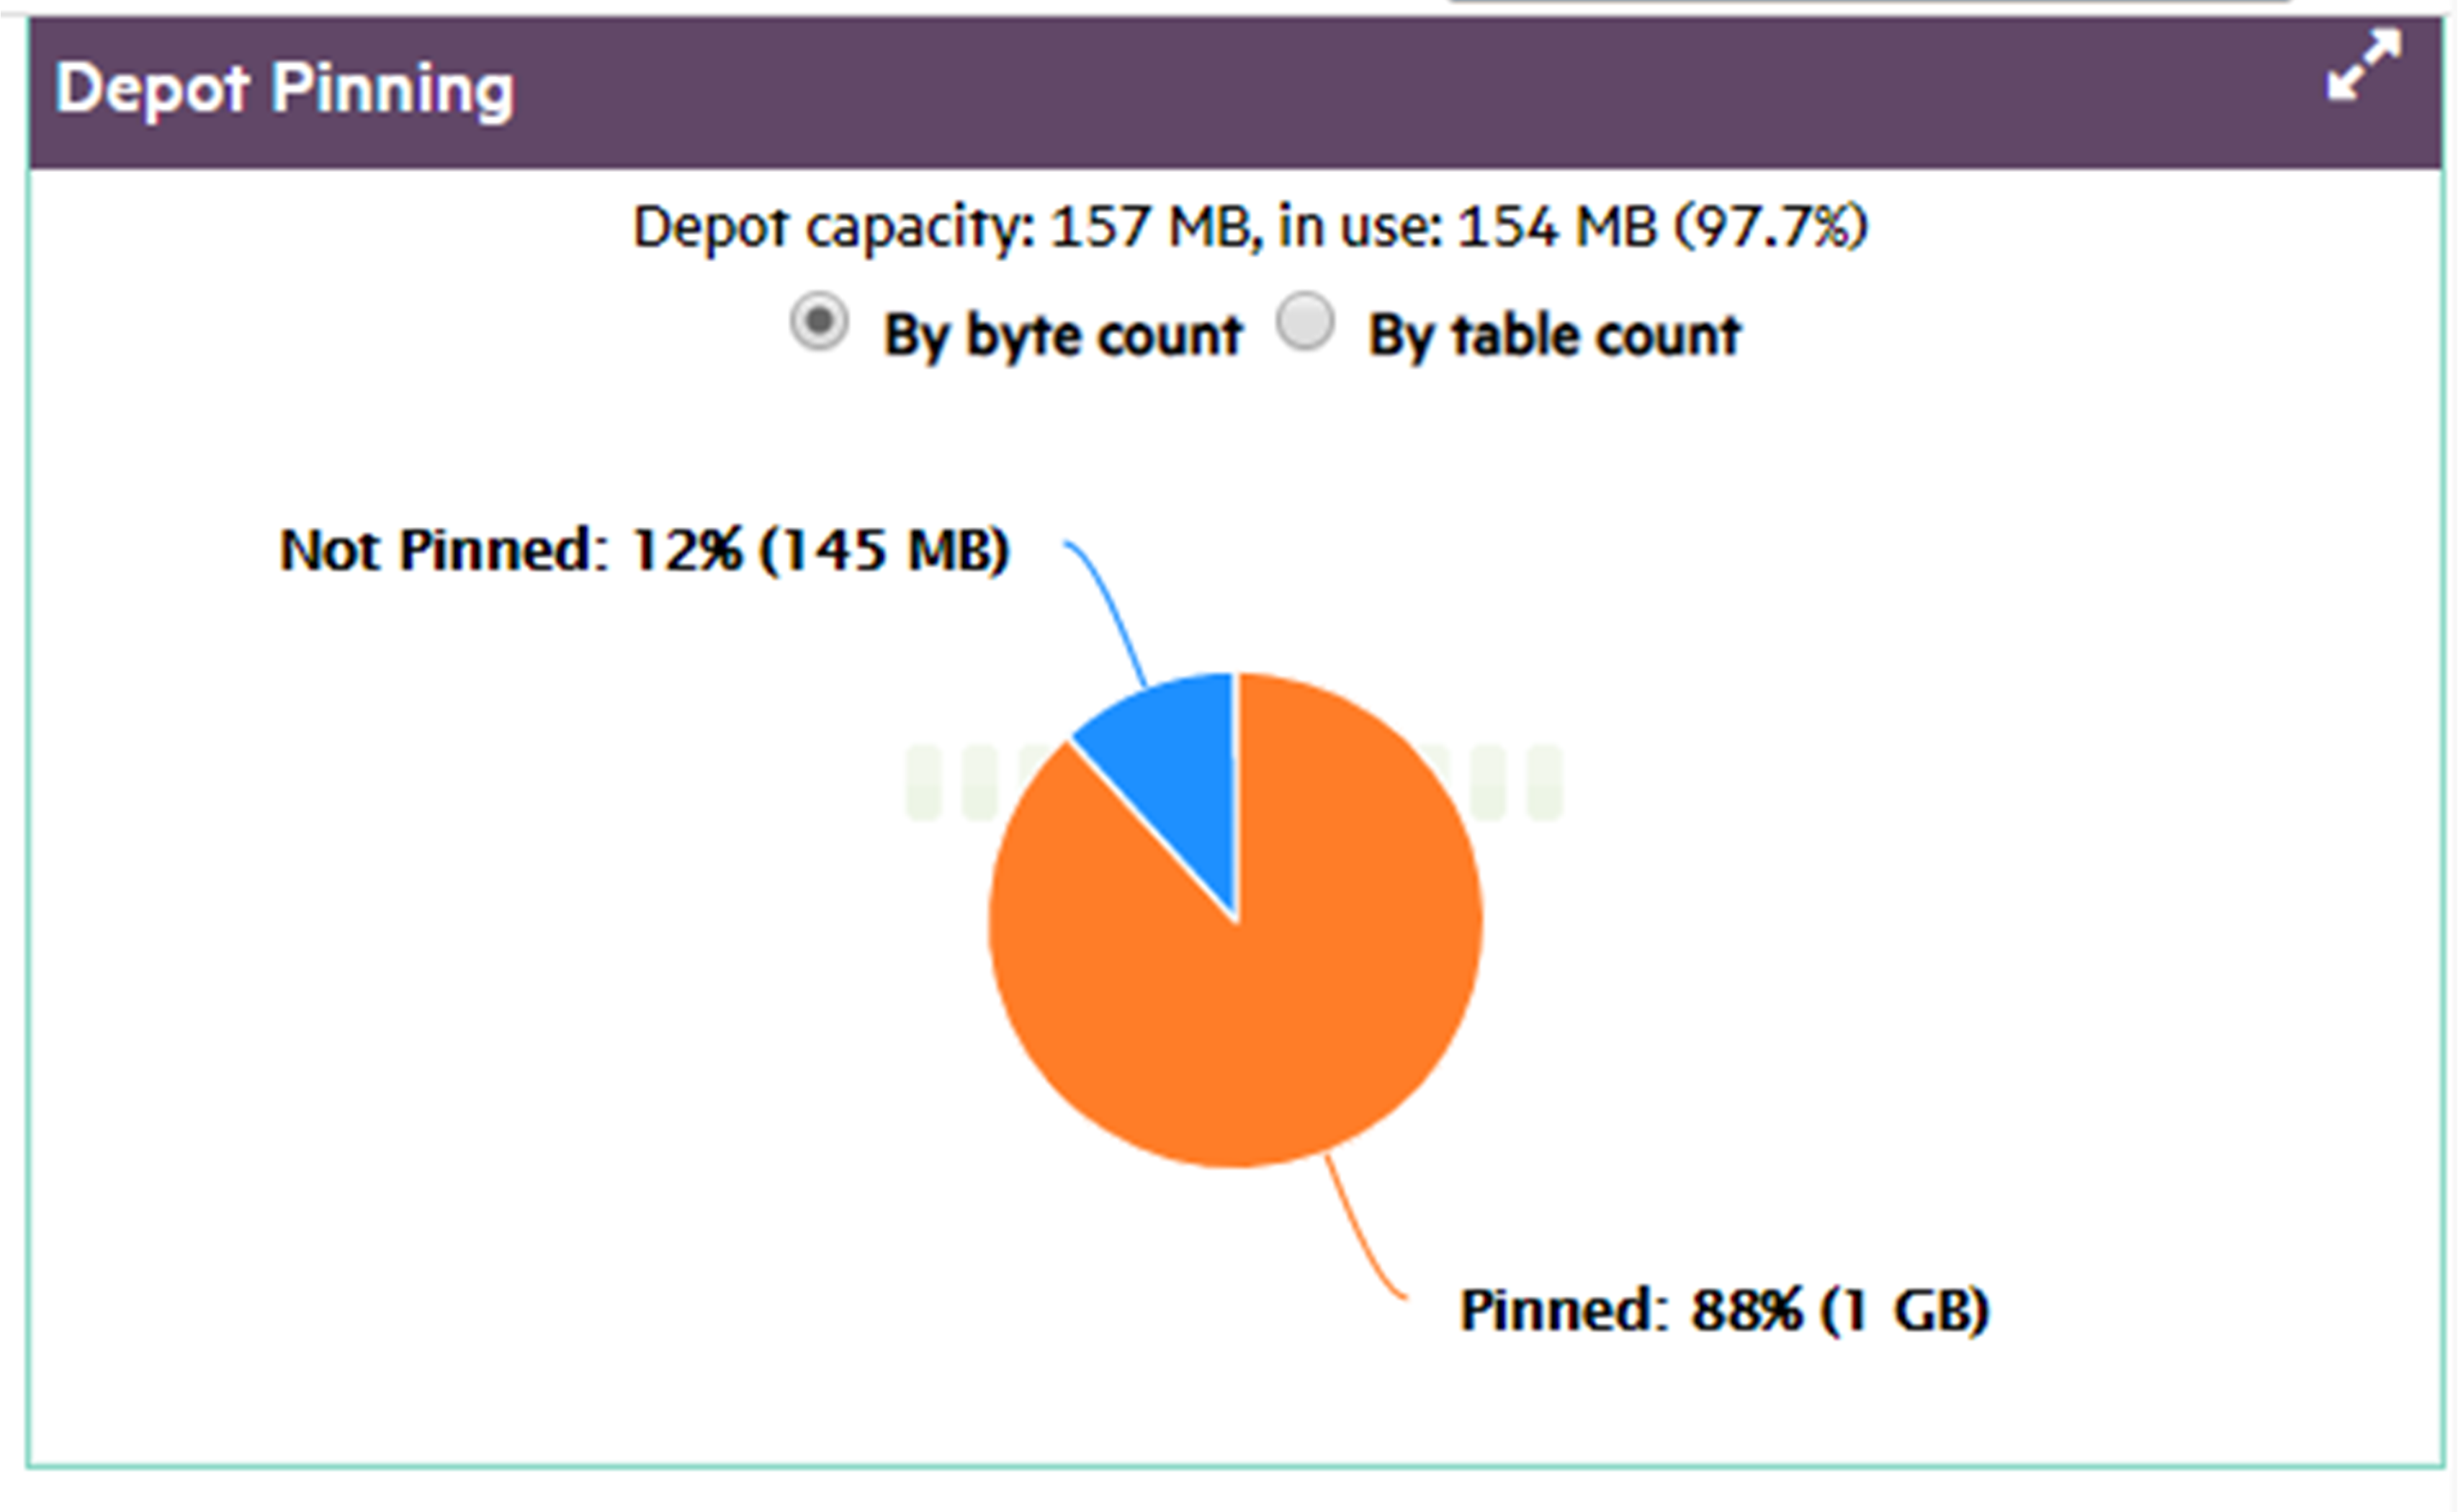
Depot pinning
It's often advisable to pin a table or table partitions whose data is frequently queried. Doing so reduces their exposure to eviction from the depot. However, you should also be careful not to use up too much depot storage with pinned data. If too much depot space is claimed by pinned objects (as shown below), the depot might be unable to handle load operations on unpinned objects.
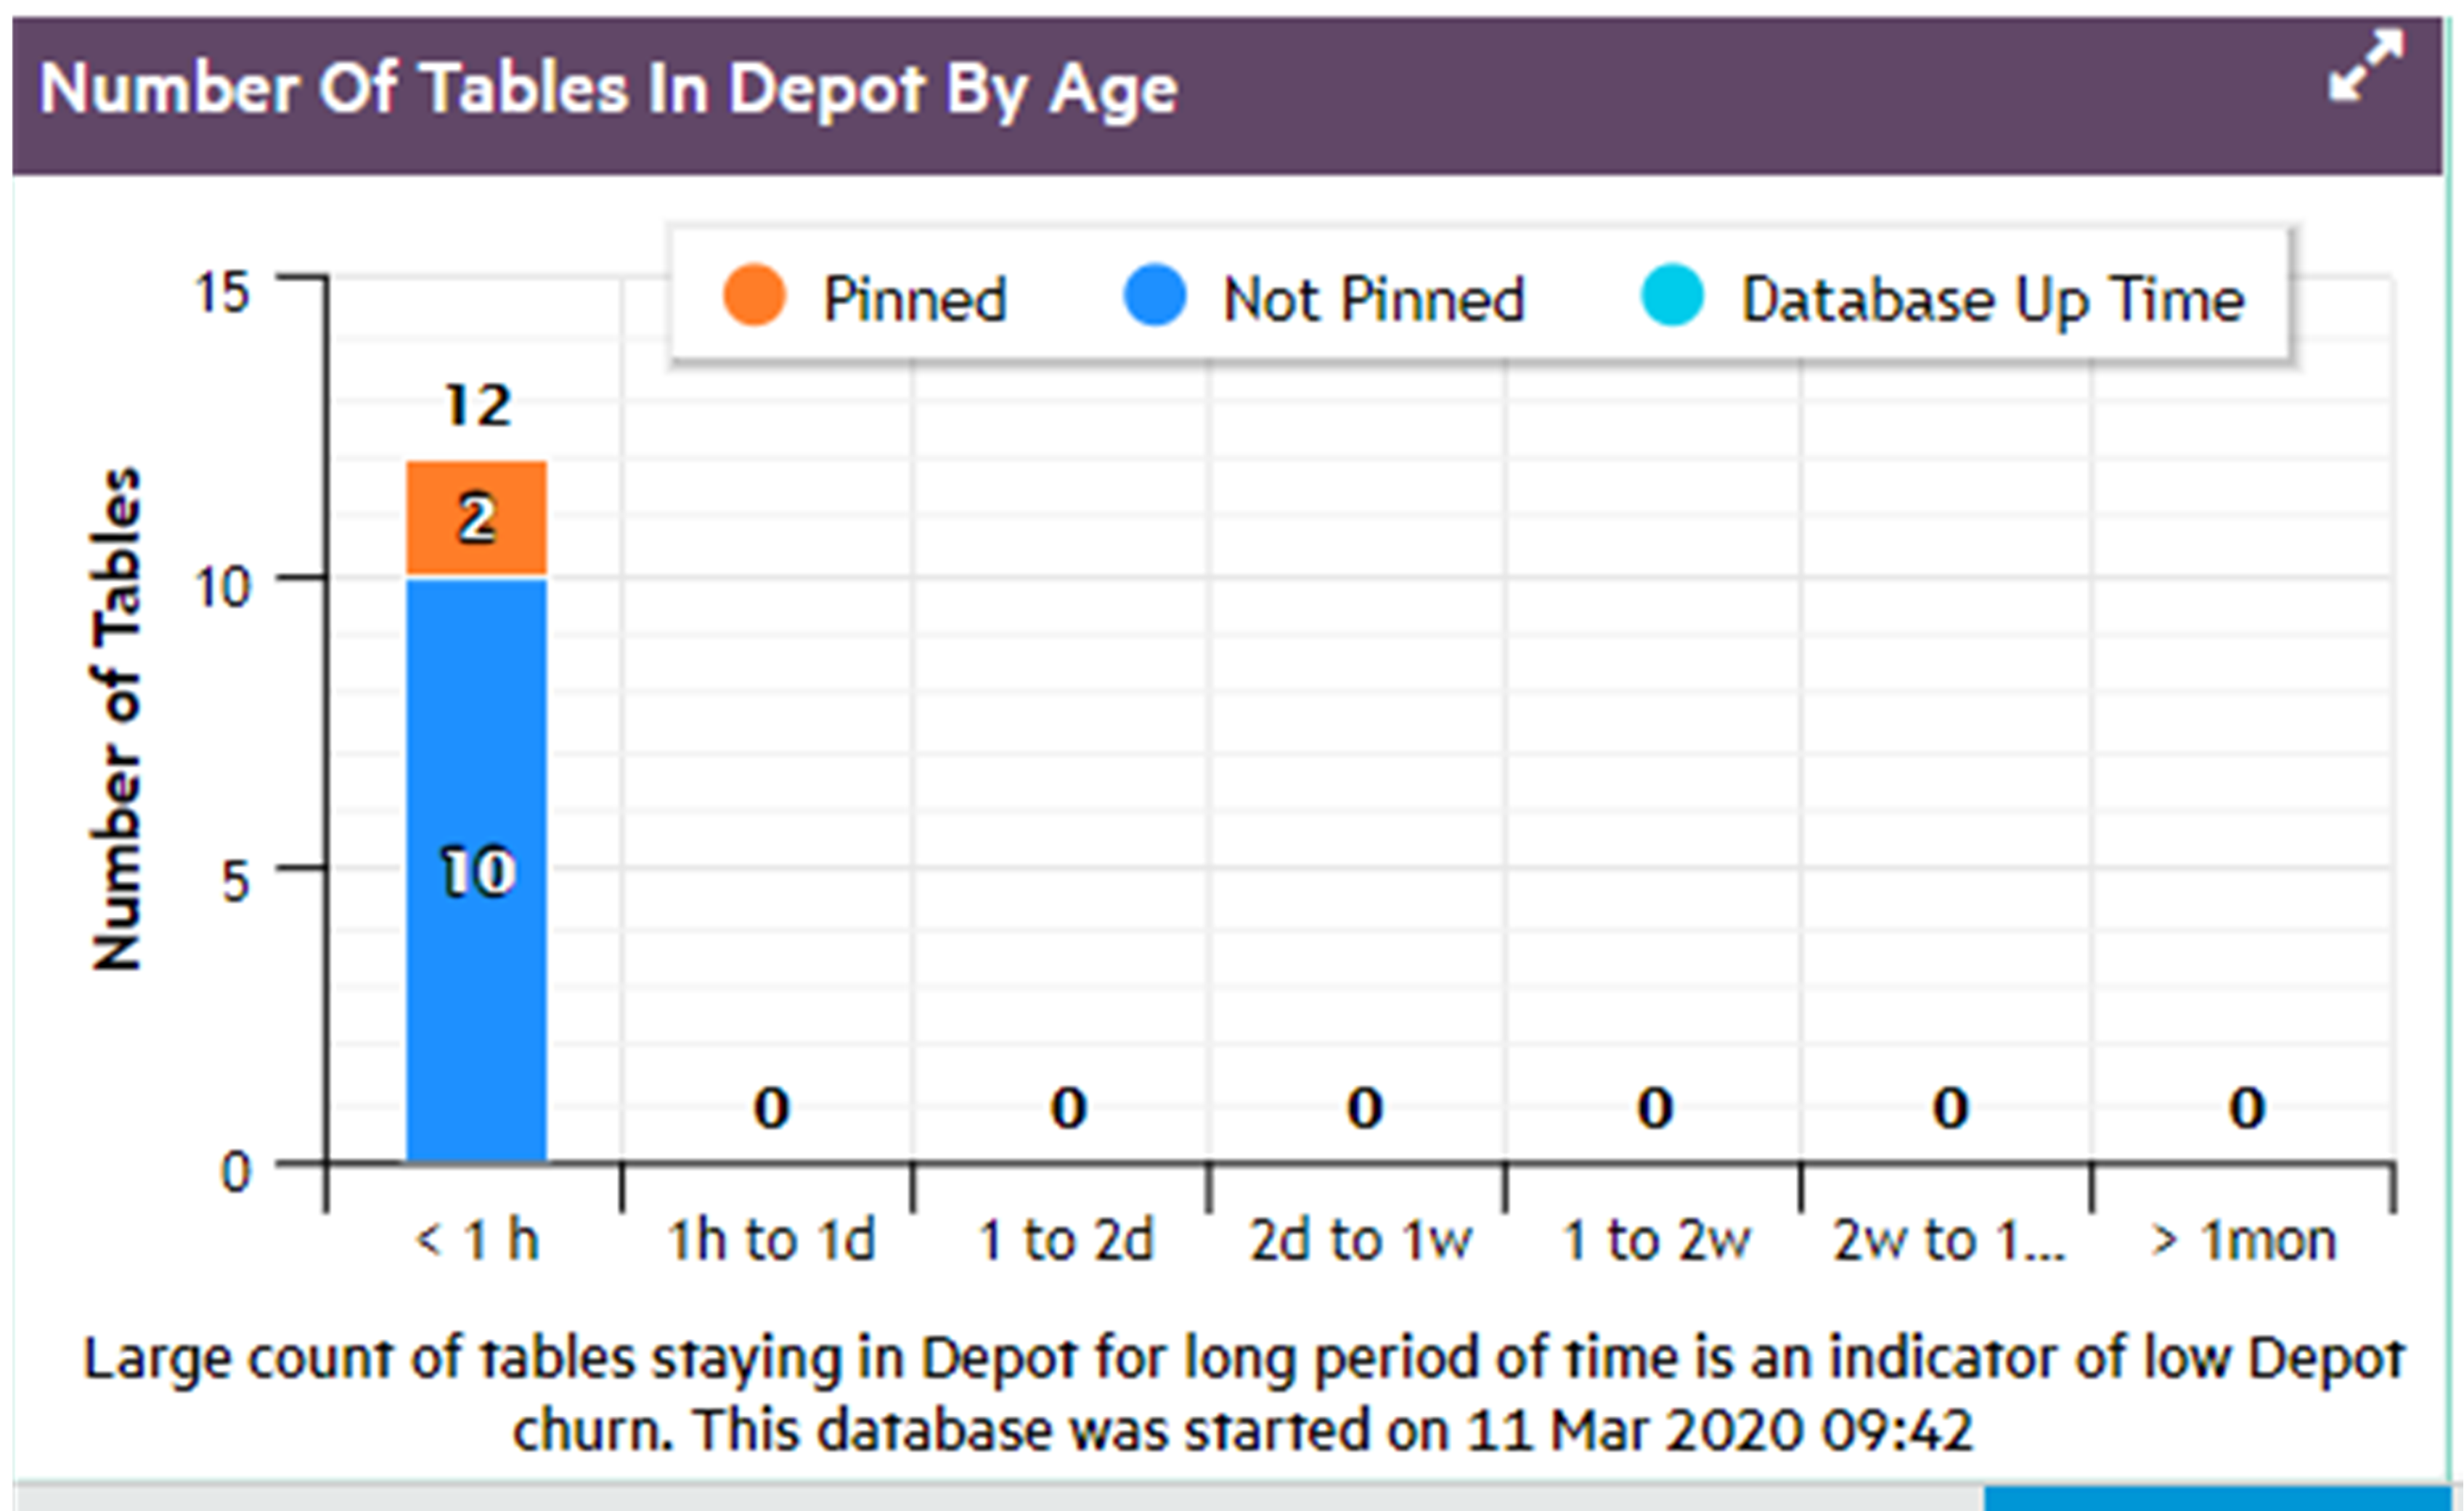
Number of tables in depot by age
Tables should typically reside in the depot for as long as their data are required. A short average lifespan of table residency might indicate frequent depot eviction, which can adversely impact overall performance. If this happens, consider increasing the depot size, or pinning frequently accessed table data.
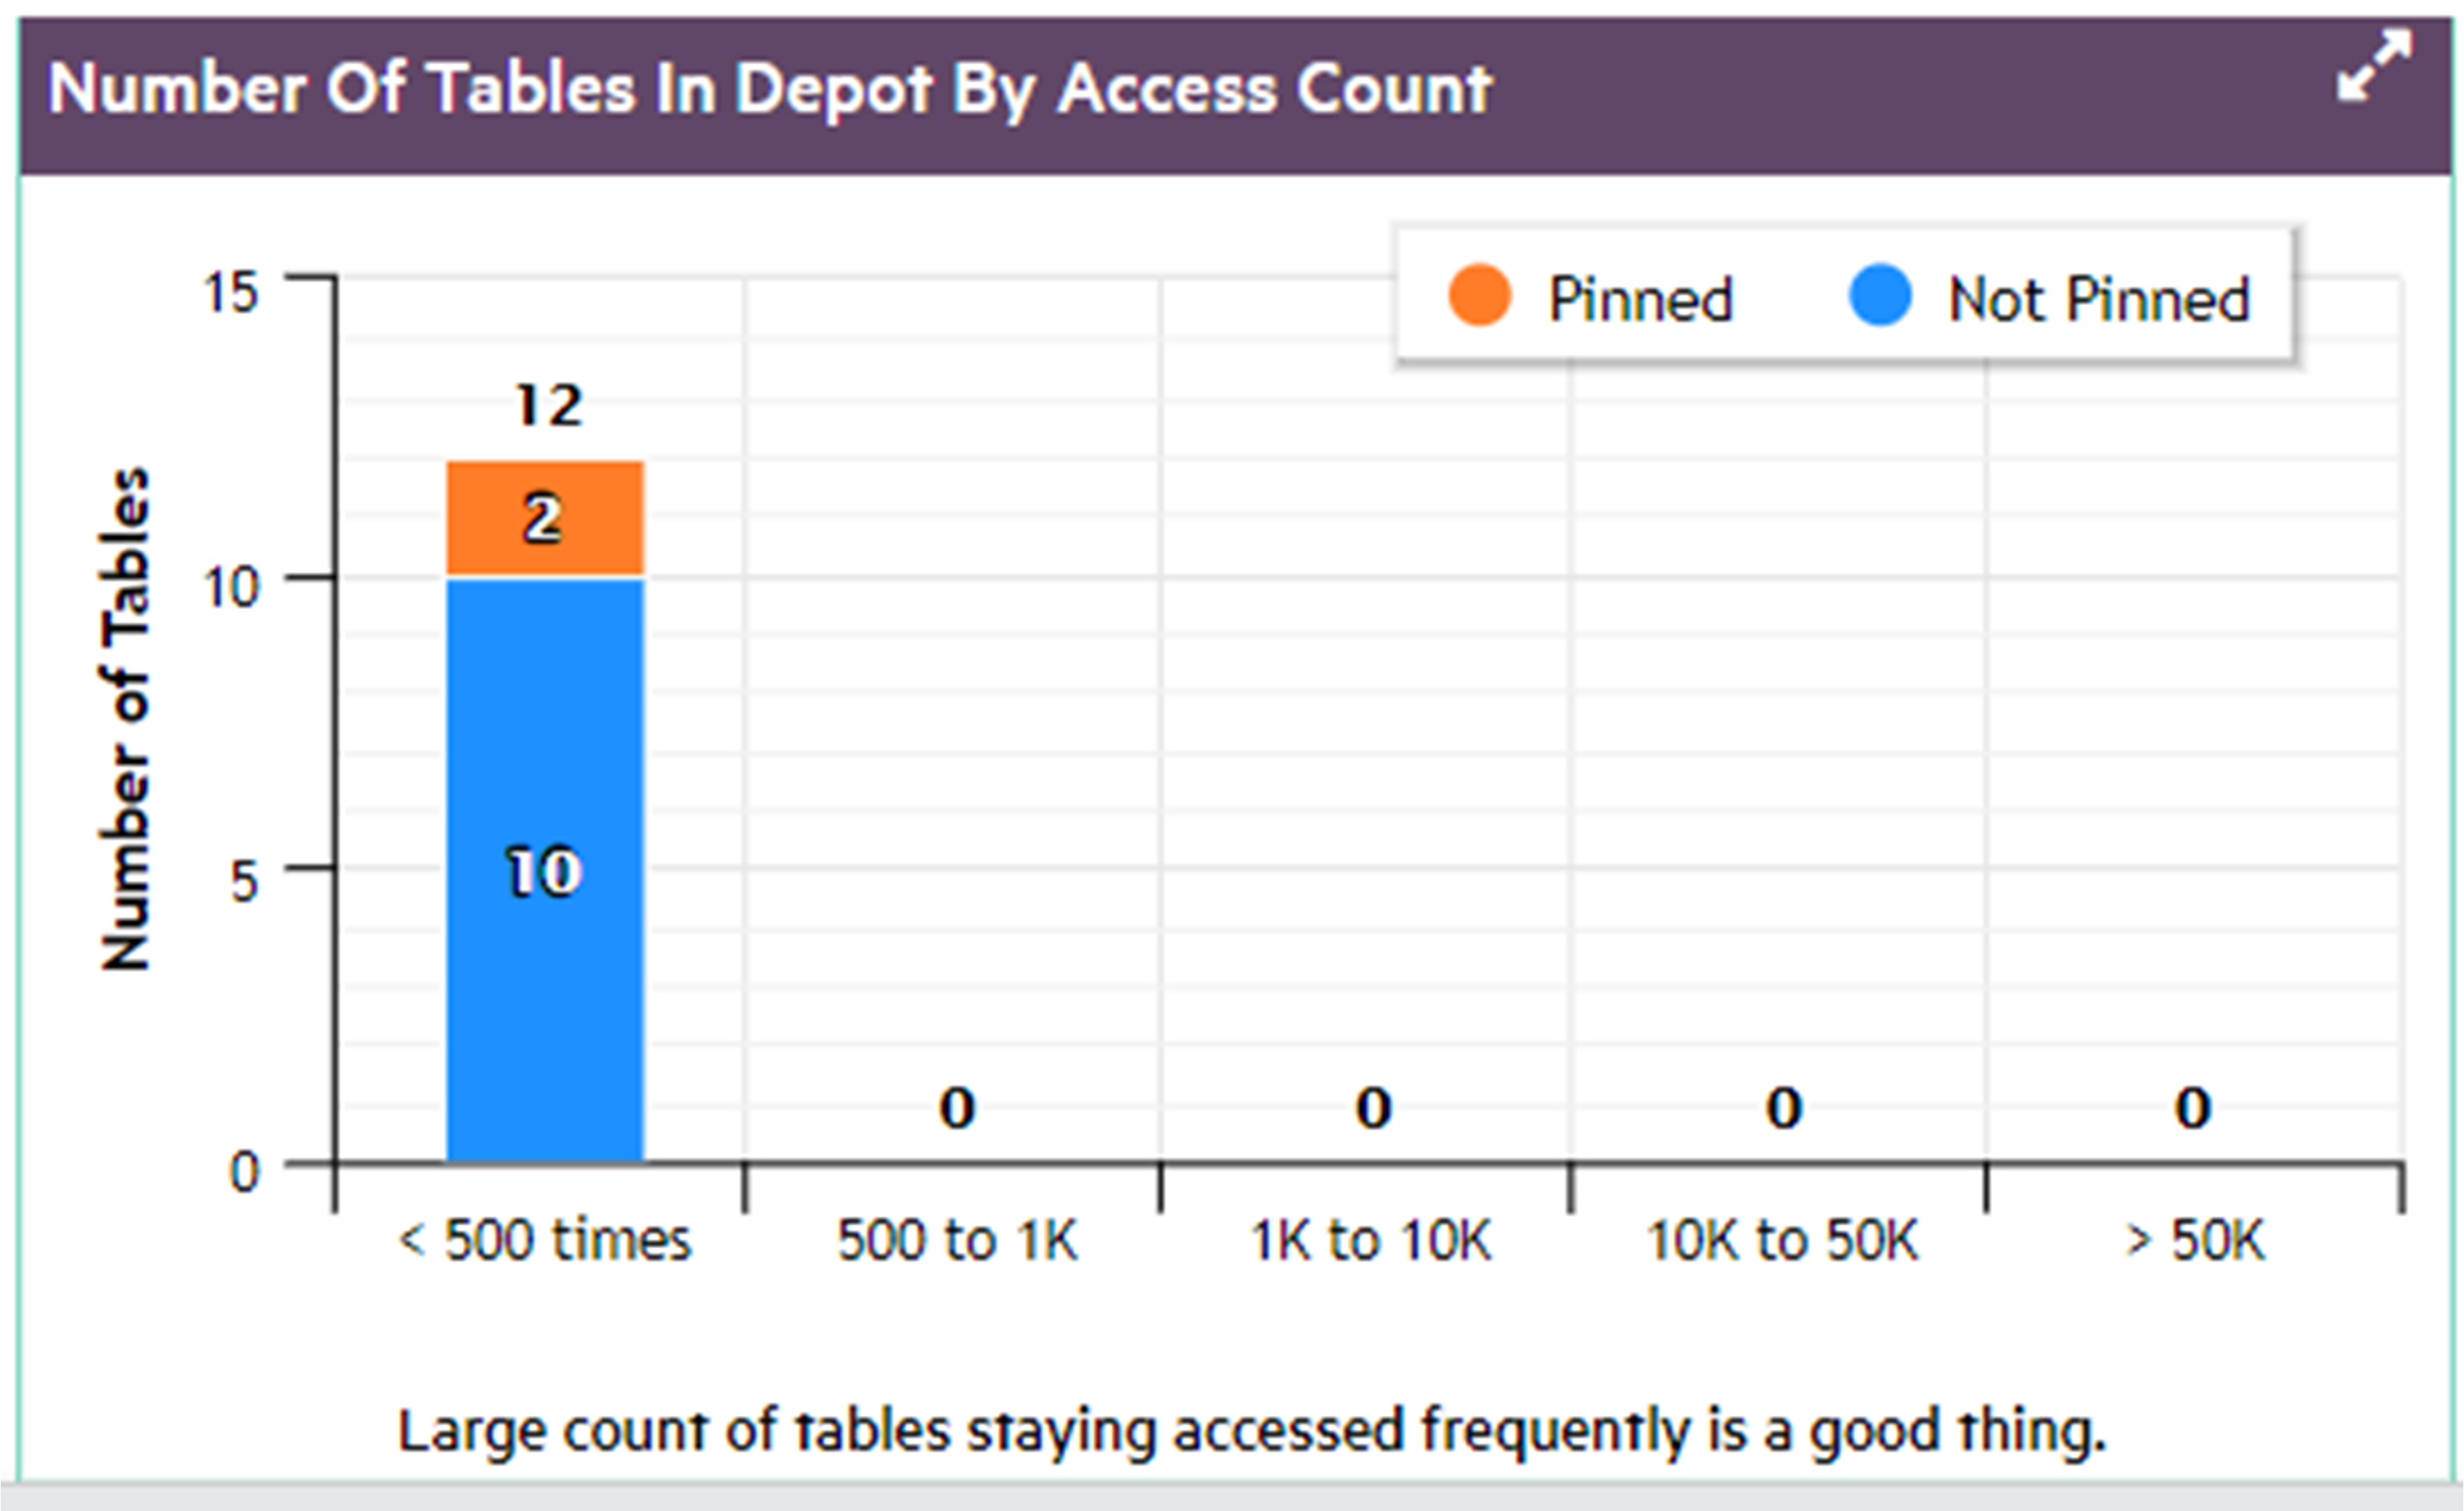
Number of tables in depot by access count
In general, the depot should largely be populated by tables that are frequently accessed, both pinned and unpinned.
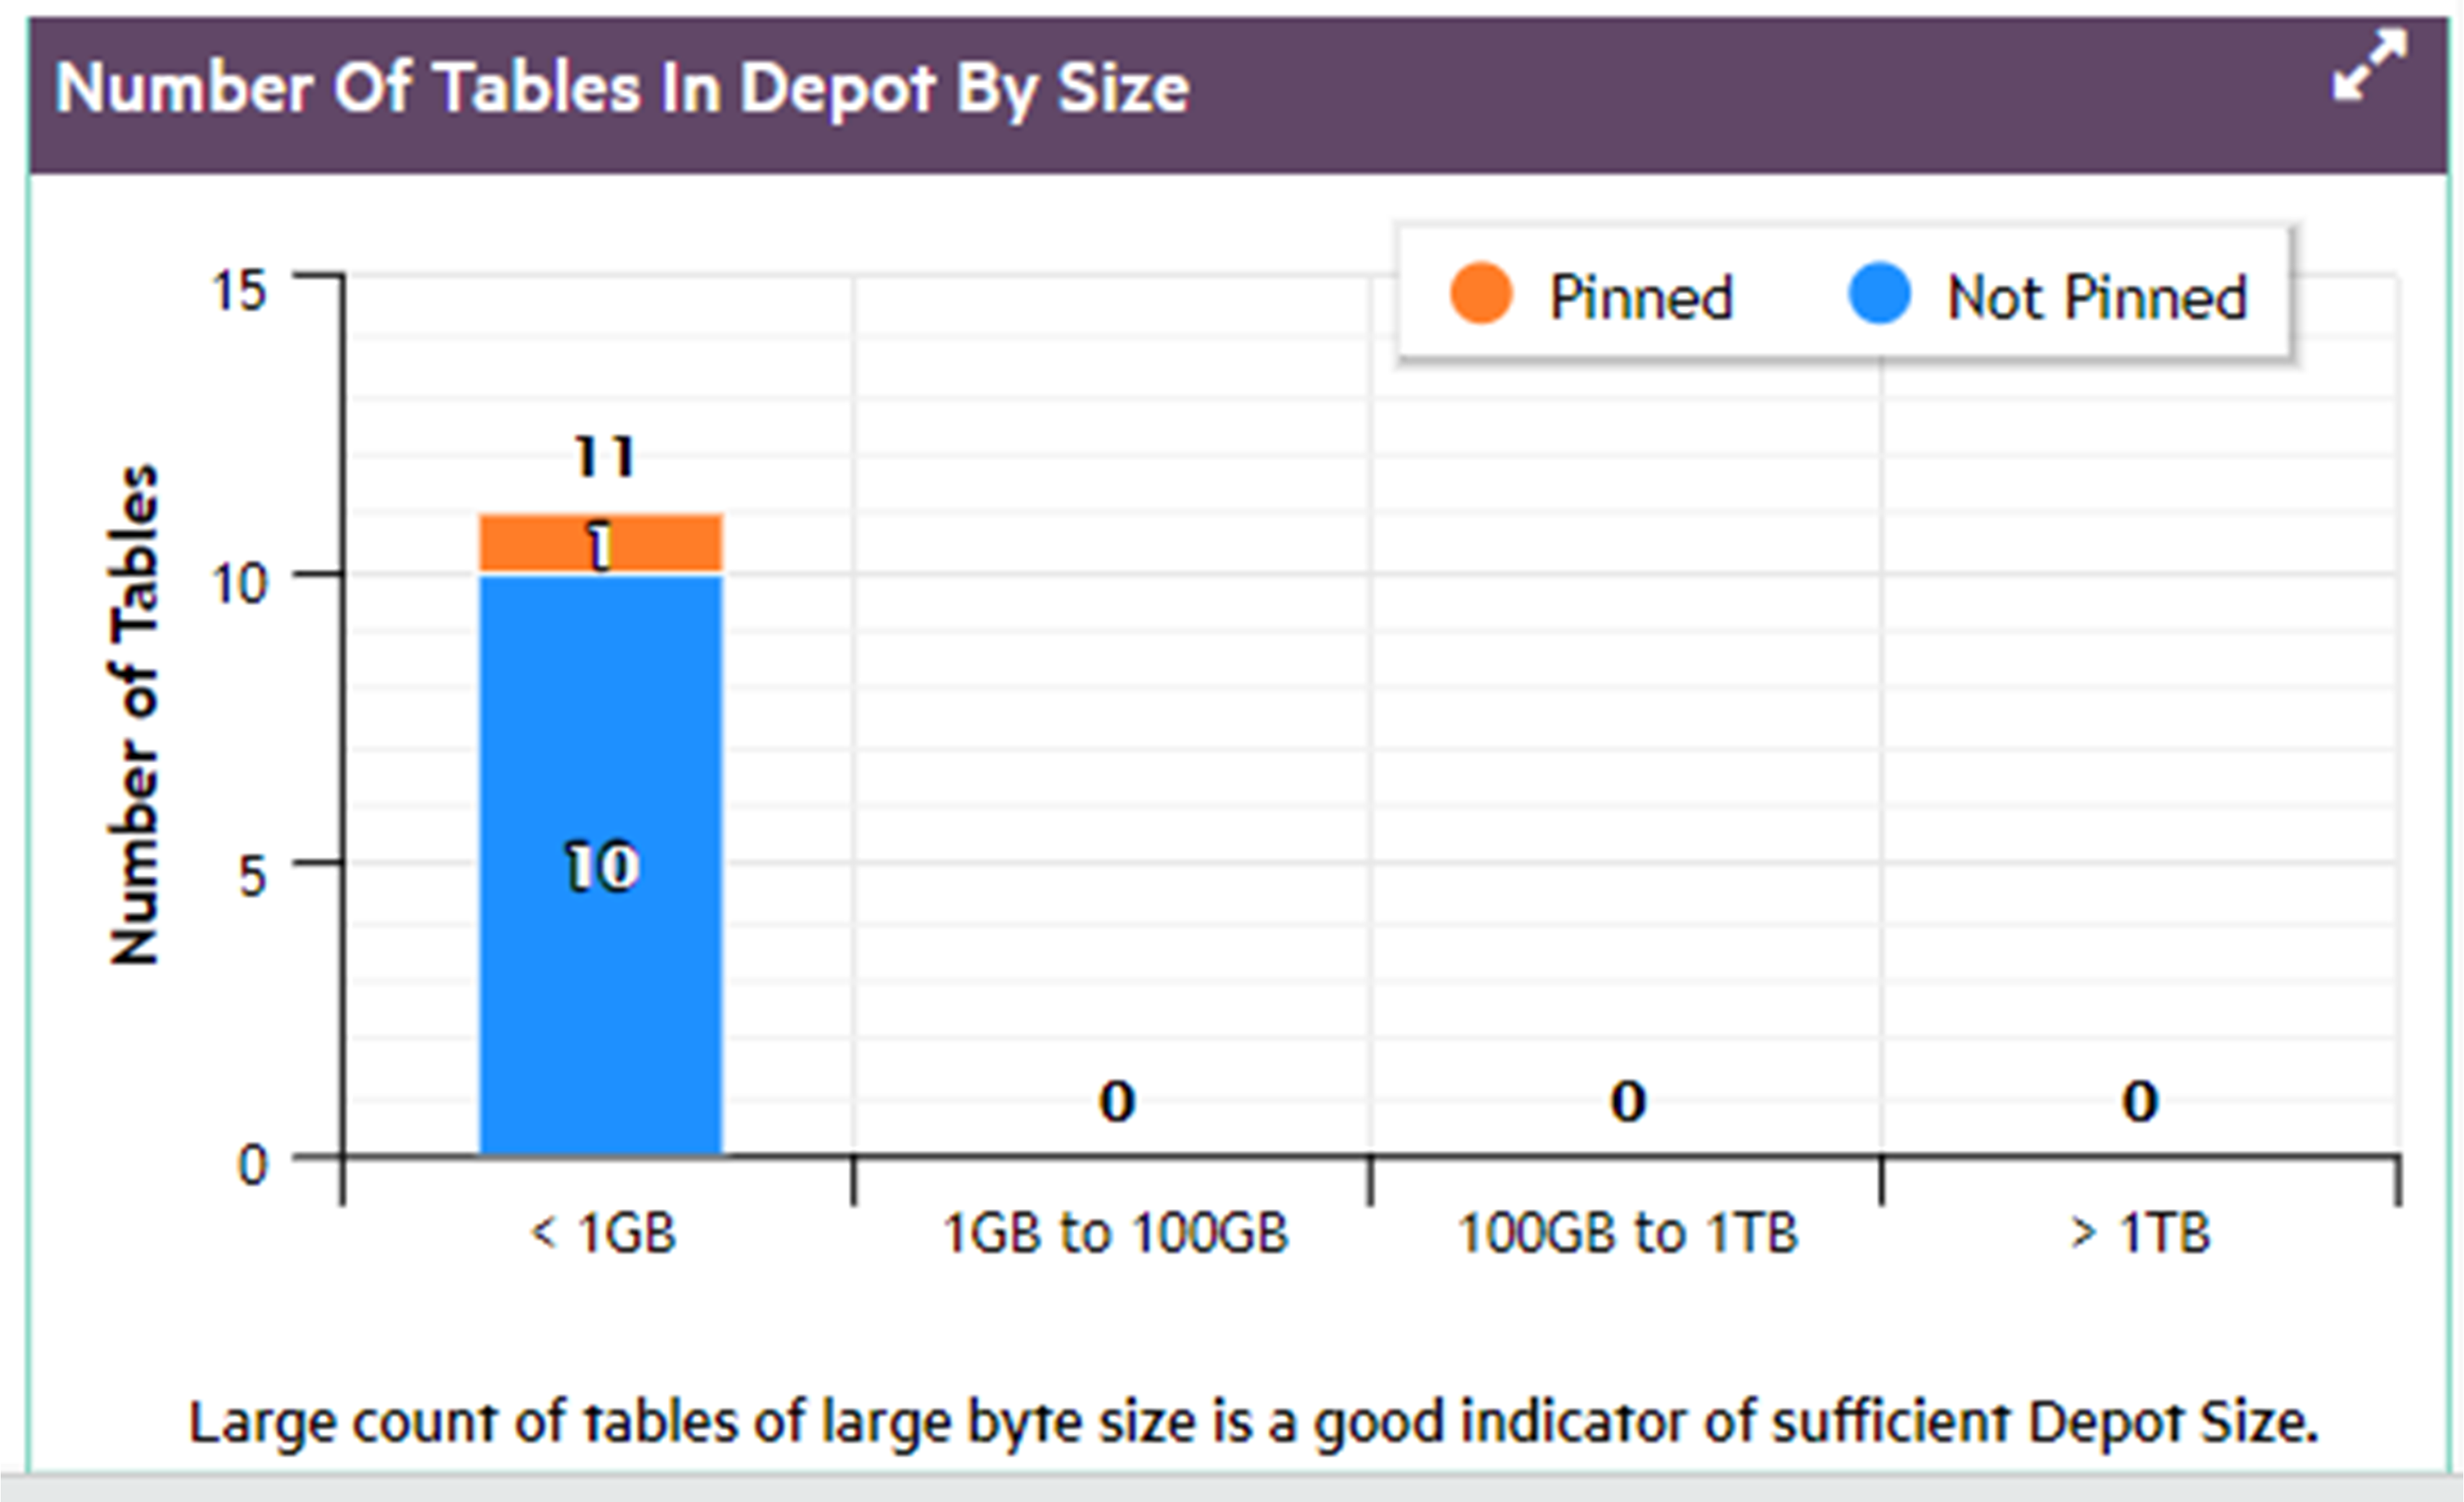
Number of tables in depot by size
It can be helpful to know the distribution of table sizes in the depot.
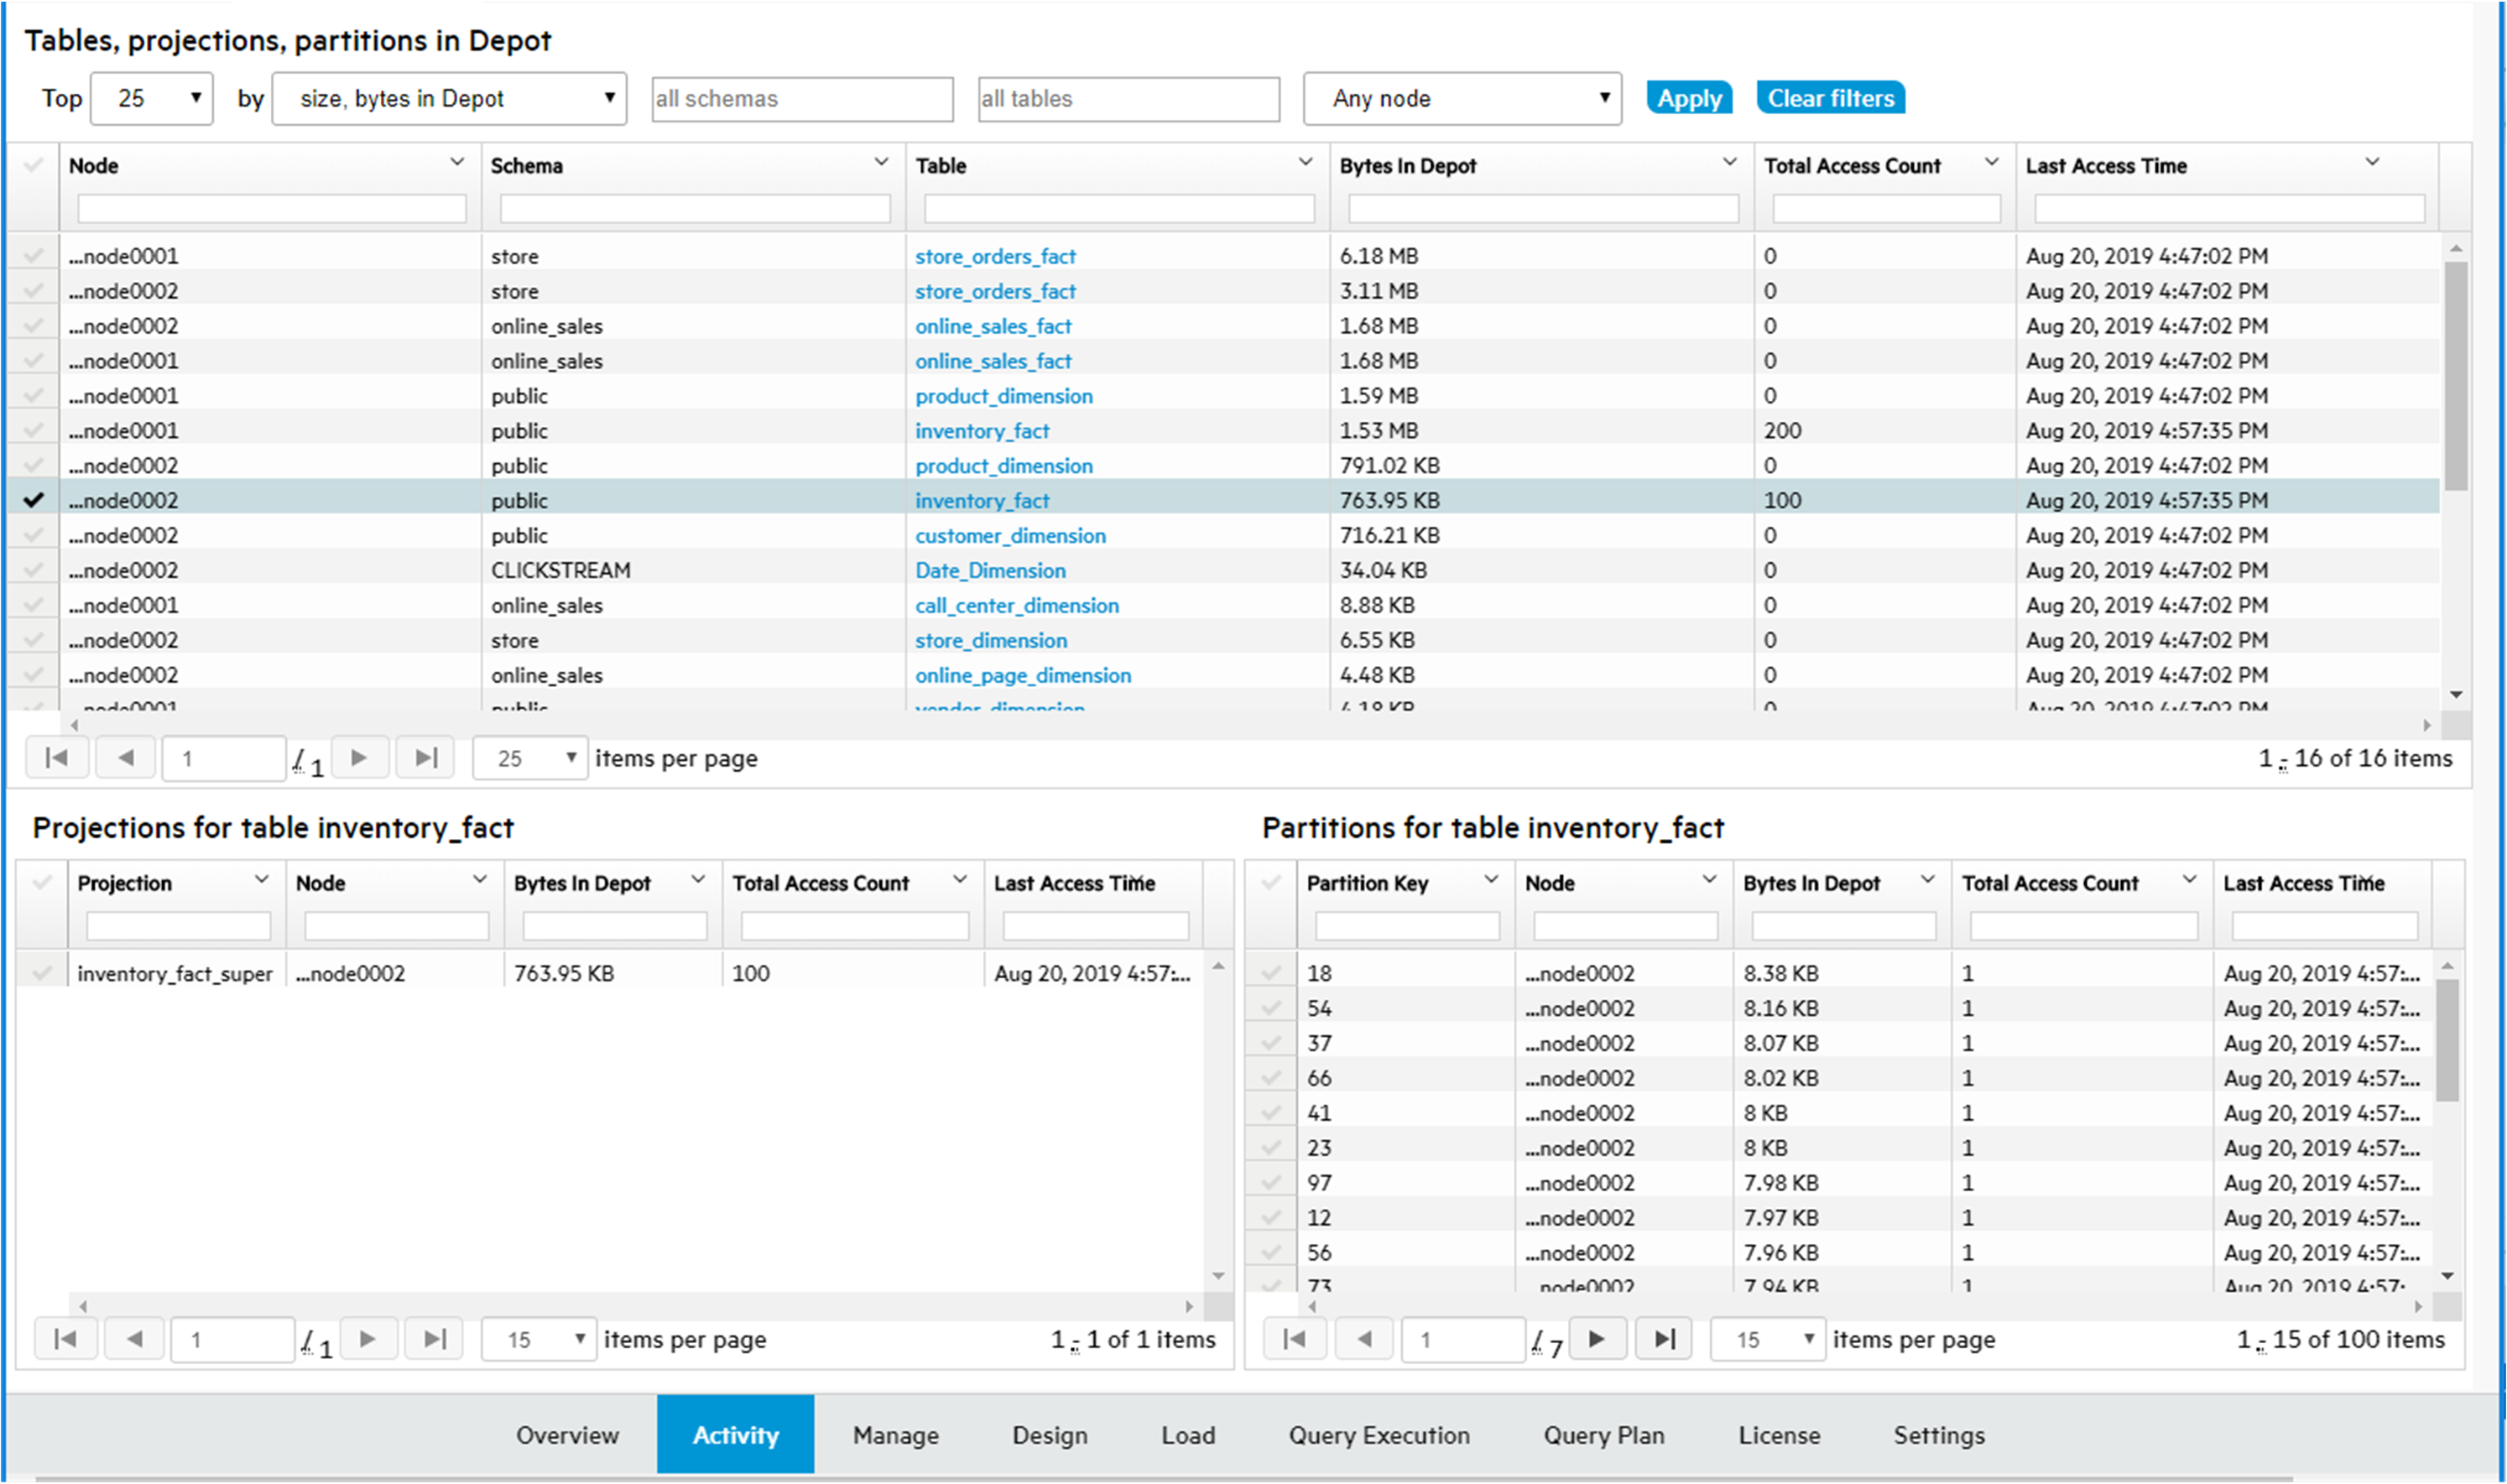
4 - Viewing depot content in MC
You can view in detail how the nodes in your Eon database are using the depot:.
You can view in detail how the nodes in your Eon database are using the depot:
-
Display a list of tables with the largest amount of data in the depot.
-
Use the filter fields to list the tables most frequently or most recently accessed in the depot.
-
Display details about how frequently the projections and partitions for a specific table access the depot, and the last time the depot was accessed.
The Depot Activity Monitoring > Depot Content tab opens showing a default list of the top 25 tables in the database, as ranked by each table's total bytes in the depot. The list shows all the nodes for each of those top tables. The nodes are sorted solely based on most bytes in depot, so the nodes for a given table do not necessarily appear together.
Filter the list
You can use the filter fields above the table to focus the list more narrowly. The filters let you select:
-
The number of top tables
-
Whether the tables are selected by most bytes in depot, the highest number of times their depot was accessed, or the most recent last access time
-
Tables in all schemas, or only in a specific schema
-
All tables, or only a specific table
-
All nodes, or only a specific node
In the Schema, Table, and Node filter fields, you can enter a text string to select all items whose names include that text string.
Select a node to see the breakdown of depot data in projections and partitions
Select a row in the top table. MC then loads the details to show how that table's depot content is distributed across the projections and the partitions for that table, that are on that node. The Projection and Partition panes show these details for the selected node:
-
Projection: Number of bytes of data for the selected table that each projection has in the depot on the selected node.
-
Partition: If the table is partitioned, this pane shows the number of bytes of data for the selected table that each partition has in the depot on the selected node.
For each projection and each partition, MC also displays the total number of times, that the projection or partition has accessed the depot on that node, and the last access time.
For more information about projections, see Projections.
For more information about partitions, see Partitioning tables.
Steps to monitor depot content
-
From the MC home page, open a database, select the Activity tab from the bottom menu, select Depot Activity Monitoring in the top selection box, and select the Depot Content tab. MC displays the top N tables (25 by default), ranked by the number of bytes of data each table has in the depot on all its nodes.
-
To narrow the list, use the filters at the top of the tab. You can show only the nodes in a certain schema and/or database, or display all the activity on a specific subgroup of nodes. Change the filters, then click Apply.
-
To select all items whose names contain a certain text string, enter that text string in a filter field. This example selects the nodes for the tables whose names contain the string "fact".
-
To display details on the projections and partitions for a specific table that are accessing the depot, select a row in the top pane of the Depot Content tab.
See also
Monitoring depot activity with MC
5 - Managing depot pinning policies
Vertica evicts data from depots as needed to provide room for new data, and expedite request processing.
Vertica evicts data from depots as needed to provide room for new data, and expedite request processing. You can pin database objects to reduce the risk of depot eviction. Three object types can be pinned: tables, projections, and table partitions.
The Depot Pinning tab lets you perform the following tasks:
For details on pinning policies, see Managing depot caching.
Listing pinning policies
To list existing depot pinning policies:
-
Select Display Existing Pinning Policies.
-
Click Search. Vertica lists all tables that are currently pinned to the depot, under Existing Pinning Policies:
-
If desired, filter and sort the list of policies by setting the following fields:
Filter on:
- Schema: Full or partial name of the desired schema
- Table: Full or partial name of the desired table
- Policy Type: Table or Partition
- Policy Scope: Database Level or subcluster name
- Partitioned Table: Y (yes) or N (no)
Sort on (in ascending/descending order):
- Size in Depot: Absolute size (in MB) of cached data
-% of Depot: Percentage of depot storage used by the cached data
- Total Access Count: Number of times that cached data from this table has been queried or otherwise accessed
- Last Access Time: Last time cached data of this table or partition was queried or otherwise accessed
Removing existing policies
You can also use the result set under Existing Pinning Policies to remove one or more policies.
To remove one or more table policies:
- From the policy list, select the check boxes of policies to remove.
Note
Policy Type of all selected policies must be set to Table.
- Click Bulk Remove Table Policies.
To remove a table's partition policies:
-
On the policy to remove, click Modify Policy.
-
In the Modify Pinning Policy dialog, perform one of the following actions:
- Click Remove Policy on the desired policy.
- Select the check boxes of one or more policies, then click Remove Selected Policies.
-
Click Close.
Creating pinning policies
You can create a policy that pins table data to a subcluster depot or to all database depots. You can specify the following policy types:
Find candidates for pinning
-
Select Create or Modify Pinning Policies.
-
Optionally filter the search by specifying a schema and the full or (for wildcard searches) partial name of a table.
-
Click Search.
You can use the filtered data to determine which tables or partitions are good candidates for depot pinning. For example, a high total access count relative to other tables (Total Access Count) might argue in favor of pinning. This can be evaluated against data storage requirements (% of Depot) and age of the cached data. For example, if pinned objects claim too much storage, a depot might be required to:
-
Route large load operations directly to communal storage for processing.
-
Increase frequency of evictions.
-
Increase frequency of fetches from communal storage to handle queries on non-pinned objects.
All these cases can adversely affect overall database performance.
Tip
To minimize contention over depot usage, consider the following guidelines:
-
Pin only those objects that are most active in DML operations and queries.
-
Minimize the size of pinned data by setting policies at the smallest effective level—for example, pin only the data of a table's active partition.
For details on how Vertica handles depot storage and turnover, see Managing depot caching.
Create a table or partition pinning policy
To create a pinning policy for a single table or table partition:
-
Under the Create or Modify Pinning Policies list , find the table to pin.
-
Click Create Policy. The Create a Pinning Policy dialog opens.
-
Select the desired policy scope, one of the following:
- Database
- An available subcluster
-
Select the desired policy type: Table Policy or Partition Policy
Table Policy
Click Create:
Partition Policy (available only if the table is partitioned)
For example:
-
Click Create.
Vertica displays the new pinning policy:
-
Optionally, add more partition-level policies on the same table by setting new partition keys.
-
When finished, click Close.
If partition pinning policies on the same table specify overlapping key ranges, Vertica collates the partition ranges. For example, if you create two partition pinning policies with key ranges of 1-3 and 2-4, Vertica creates a single policy with a key range of 1-4.
Create pinning policies on multiple tables
To create a pinning policy on multiple tables:
-
On Create or Modify Pinning Policies, select the check boxes of the tables to pin.
Note
All checked tables must be unassigned to a pinning policy, as indicated by their Create Policy link.
-
Click Bulk Create Table Policies. The Bulk Create Table Policies dialog opens.
-
Select the desired policy scope, one of the following:
- Database
- subcluster (choose the desired subcluster)
-
Click Create, then click Close.
Removing a pinning policy
To remove an existing pinning policy:
-
On Create or Modify Pinning Policies, find the table with the policy to remove.
-
Click Modify Policy.
-
In the Modify Pinning Policy dialog, perform one of the following actions:
- Click Remove Policy on the policy to remove.
- Select the check boxes of one or more policies, then click Remove Selected Policies.
-
Click Close.
Remove pinning policies from multiple tables
To bulk-remove pinning policies from one or more tables:
-
On Create or Modify Pinning Policies, select the target table check boxes.
Note
All checked tables must comply with the following requirements:
-
Click Bulk Remove Table Policies. The Bulk Remove Table Policies dialog opens.
-
Click Remove, then click Close.
Viewing frequently fetched tables
You can query the depot for tables that are most frequently fetched from communal storage. This can help you quickly identify potential candidates for depot pinning:
-
Select Top num Refetched Tables(s) from Depot.
-
Specify the maximum number of results to return (by default 10), and the range of dates to query.
From the list, you can perform the following tasks: