Query profiling
The Query Profiling feature in MCP Server enables deep analysis of SQL queries, visualization of execution plans, and export of detailed query profile data. These tools help you understand query performance, resource usage, and execution flow across OpenText™ Analytics Database nodes and subclusters.
Key features
- Profile storage in tables: Save query profiles in persistent tables within a specified schema, or use temporary tables for ad-hoc analysis.
- Large Language Model (LLM)-driven analysis: Analyze queries using the MCP server's LLM, which processes operator statistics and performance aggregates (such as execution time and resource usage) computed by profiling tools.
- Interactive plan tree visualization: Visualize query plan trees, including data flow volumes and execution times per node, with interactive HTML output.
- Export/import profile data: Export all profile tables as a compressed tarball (.tar.gz) for sharing or offline analysis, and import them into other clusters or tools.
- Subcluster and sandbox support: Profile query execution on specific subclusters or sandboxes by routing requests to the desired subcluster or sandbox.
- Prompt support: Configure and execute analysis prompts with flexible input parameters to tailor profiling to your specific needs.
Profiling workflows
Query profiling supports two distinct workflows:
- Profile and analyze using prompts – A guided, step-by-step approach where the LLM orchestrates the entire workflow, including job monitoring and analysis generation.
- Direct tool access – Ask the LLM to use specific profiling tools directly without the built-in prompts, giving you fine-grained control over each step.
Both approaches produce the same profiling results that can be visualized, exported, and imported. Choose the approach that best fits your workflow.
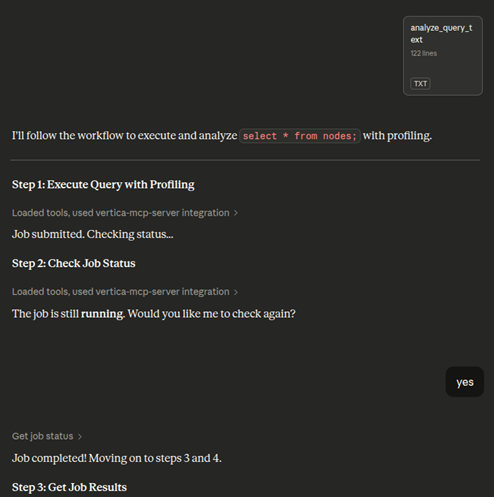
Profile and analyze a query using prompts
Configure prompt inputs
-
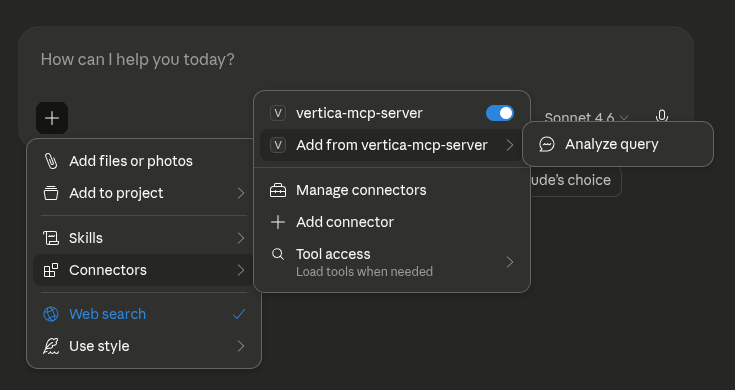
In the LLM, click Add Connectors, select Add from vertica-mcp-server, and then click Analyze Query.
-
To begin profiling a SQL query, enter the required prompt details and click Add prompt:
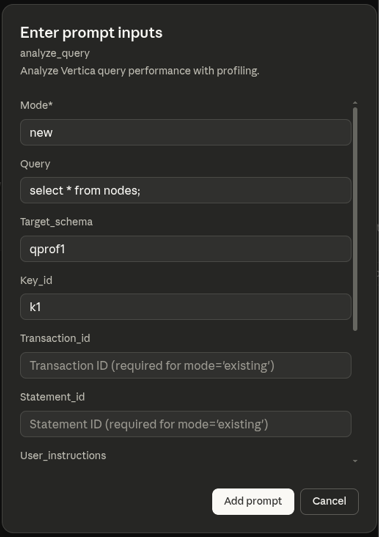
- Mode: Set to
newto execute and profile a new query, orexistingto analyze a previously executed query by providing its transaction ID and statement ID. - Query: The query you want to profile (for example,
select avg(price) from sales;). - Target_schema: The schema where results will be stored (for example,
qprof1). A new schema is automatically created if it does not already exist. - Key_id: A unique identifier for this profiling run (for example,
k1). Profile table names have this ID appended (for example,qprof_query_profiles_k1). - Transaction_id: The transaction id for an existing query.
- Statement_id: The statement id for an existing query.
- User_instructions: Additional instructions to customize the analysis.
- Analysis_scope: Specify the depth of analysis (
basicordetailed). Defaults isbasic. - Subcluster: The subcluster where the query should be executed.
- Sandbox: The sandbox where the query should be executed. If both subcluster and sandbox are specified, sandbox is ignored.
Note
- Transaction ID and Statement ID: Provide
Transaction_idandStatement_idto profile an already-executed query, or provideQuerywithMode=newto execute and profile a new query. These fields are required when usingMode=existing, and should be left empty when usingMode=new. - Key ID: If you leave the Key ID blank for mode
existing, the system auto-generates a timestamp-based identifier. Using an explicit Key ID makes it easier to reference and retrieve your profiling results later.
- Mode: Set to
-
Click
analyze_query_textin the chat to view the analysis workflow and tools the LLM will use.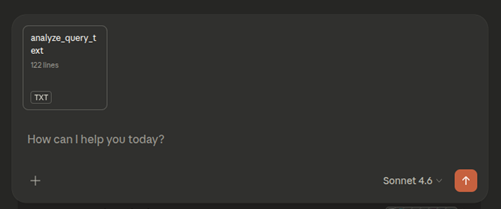
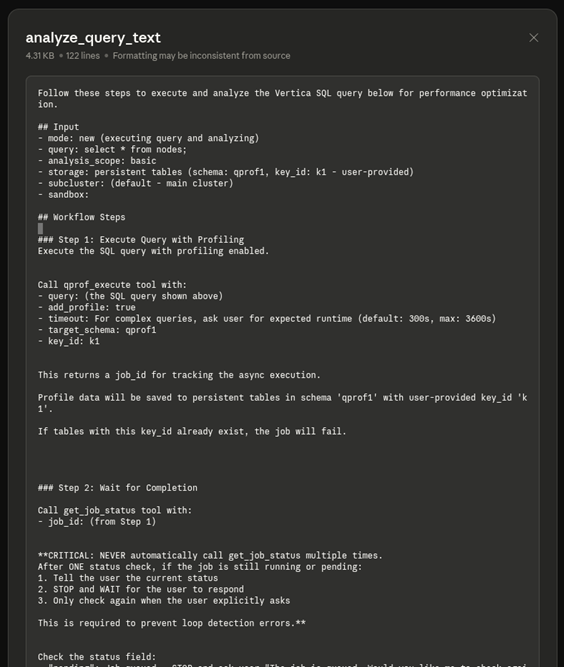
Review workflow steps
The analysis workflow displays the following steps:
- Execute query: The
qprof_executetool runs the query with profiling enabled. - Generate job ID: A
job_idis created to track the asynchronous execution. - Monitor completion: The LLM checks the job status once. If still running, it pauses and waits for your confirmation before checking again to prevent infinite loops.
Execute, monitor, and review analysis
When processing your analysis, the LLM performs these steps:
- Submit and monitor: The job is submitted and checked for completion. If still running, the LLM pauses and requests confirmation before checking again.
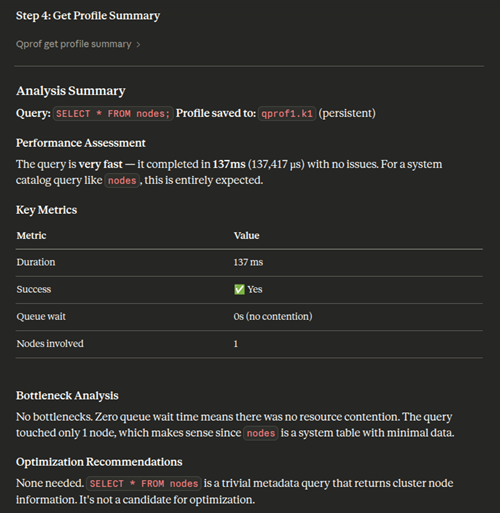
- Generate summary: Once the job completes, the LLM produces a comprehensive profile analysis, including performance assessment, key metrics (duration, success, queue wait time, nodes involved), bottleneck analysis, and optimization recommendations.
Profile storage
Profile data persists in the specified database schema and tables.
Analyze query profiles directly
Alternatively, you can ask the LLM to use specific profiling tools without the built-in prompts. This approach gives you direct control and works independently of the prompt-based workflow.
To use these tools, ask the LLM directly in the chat. For example, "Analyze this query profile using qprof_get_operator_stats" or "Get a summary of my query execution".
You can also analyze existing query profiles saved from previous runs. Provide the schema and key ID where the profile data is stored. For example: "Give me a summary of the query profile that is saved in the schema xyz with key slow_query". This is useful for analyzing historical query executions without re-executing them.
Available tools:
qprof_get_profile_summary: Get a high-level summary of the query execution, including duration, status, and resource usage.qprof_get_events: Retrieve warnings, optimization hints, and execution issues.qprof_get_resources: Examine resource pool acquisition details and queue wait times.qprof_get_steps: See a detailed breakdown of execution phases and timing.qprof_get_operator_stats: Analyze operator-level performance metrics (for example, slowest operators, memory usage).qprof_get_path_stats: View aggregated statistics at the query plan path level.qprof_get_plan: Get the raw EXPLAIN plan for the query.qprof_get_plan_tree: Retrieve the complete query plan tree with structure, metrics, and operator details. This is best suited for LLM or programmatic analysis.
Each tool provides a focused view or set of metrics to help you understand and troubleshoot query performance.
Visualize, export, and import results
The following capabilities work with both profiling approaches above. Use them to interact with and share your profiling data.
Visualize query profile tree
You can visualize the query execution tree by asking the LLM to generate an interactive visualization:
- Ask the LLM to visualize the query profile tree. Optionally, provide your MCP server IP and port.
- The LLM generates an HTML file saved on the MCP server and provides a link to view it. To access the link, ensure you have network access to the MCP server's IP address and port (accounting for any port mappings in your environment).
- Open the provided link in a browser to view the visualization.
- The visualization tree displays all the details of the query profile. You can zoom in and out and interact with the query tree to analyze query execution.
Note
The query profile tree is generated as an HTML file on the MCP server rather than sent directly to your agent. This approach significantly reduces token usage. Alternatively, you can request an embedded object format to load the tree directly in agents such as Claude Desktop, though this option requires more tokens.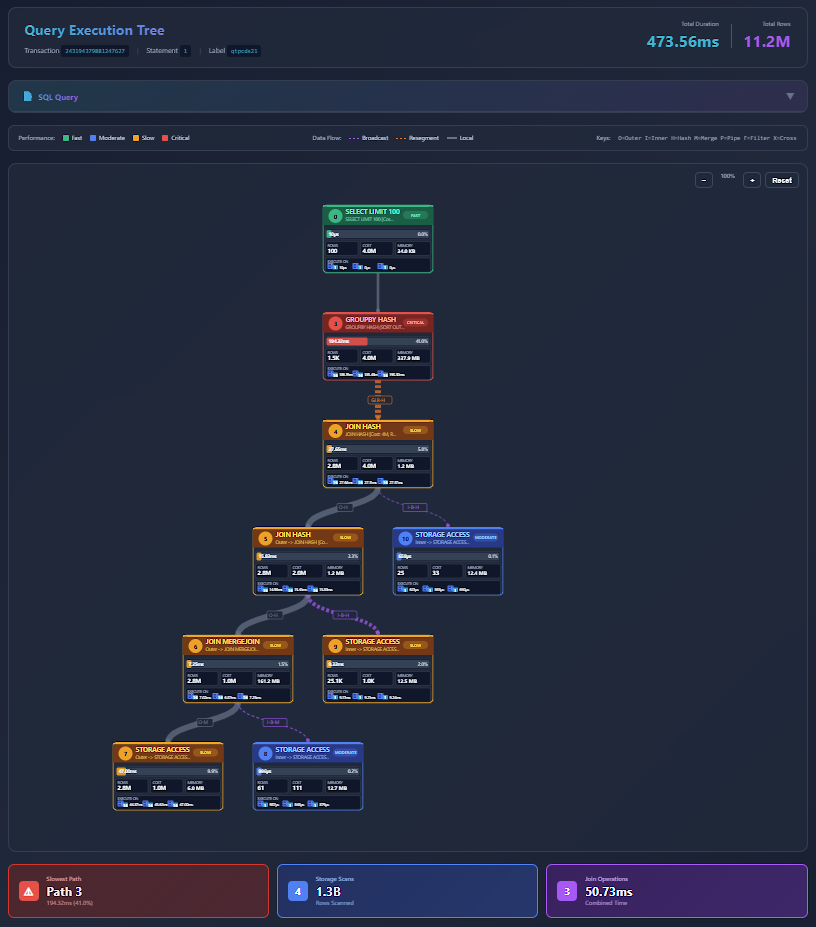
Export query profile data
You can export all profile tables as a compressed tarball (.tar.gz) for sharing or further analysis.
- Ask the LLM to export the profiling data.
- The system generates the profile export details and a download link for the profile tarball (.tar.gz).
- Open the link in a browser to download the tarball (.tar.gz) to share or analyze offline.
Import and analyze query profiles
You can import profile data from other clusters or tools for analysis in your current environment. You can also import a tarball (.tar.gz) into VCluster using Query Profile and use the target schema and key ID to analyze using the MCP Server Query Profiling tools. For more information about Query Profile in the VCluster UI, see Query Profile.