This is the multi-page printable view of this section.
Click here to print.
Return to the regular view of this page.
MCP server
MCP server is a secure, JWT-authenticated server that implements Model Context Protocol (MCP) for database interactions between your database and AI agents.
MCP server is a secure, JWT-authenticated server that implements Model Context Protocol (MCP) for database interactions between your database and AI agents. It provides MCP tools for executing queries, managing job queues, and interacting with the database through APIs.
Prerequisites
System requirements
- Operating System: Linux (Ubuntu/RHEL/CentOS).
- Vertica: Already running and accessible.
- VCluster Web Service running: required to retrieve node and cluster information. When using the default configuration, starting the MCP server automatically starts the VCluster Web Service.
Note
- The MCP server is not supported on Kubernetes in the 26.1 release, but will be supported in later releases.
Network requirements
The following ports must be accessible through the firewall:
- 8667: Default port for MCP server. Must be open for HTTPS connection.
- 8665: Default for VCluster services.
Note
The MCP server must have network access to your database cluster to route SQL queries to your subcluster or sandbox. For optimal operational performance, deploy the MCP server on a dedicated host that does not run Vertica processes.
Database access
- Valid database credentials.
- Database user with appropriate permissions to execute intended queries.
- Network connectivity to the database server.
Required files and directories
Ensure the following files and directories exist before starting the MCP server:
- SSL Certificate (default location:
/opt/vertica/config/vcluster_server/):
server.pemserver.keyrootca.pem
- Configuration Directory (this is auto-created if it is missing):
/opt/vertica/config//opt/vertica/config/mcp_server/
- Log Directory (this is auto-created if it is missing):
Starting the MCP server
Run the following command to start the MCP server:
/opt/vertica/bin/manage_vcluster_server.sh start
This starts both the MCP server and VCluster server.
To start only the MCP server:
/opt/vertica/bin/manage_vcluster_server.sh start mcp_server
Note
You can customize your MCP server configuration by editing /opt/vertica/config/mcp_server.yaml.
Log files for the MCP server are located by default at /opt/vertica/log/mcp_server.log and /opt/vertica/log/mcp_audit.log.
All tools available in the VCluster server are also available through the MCP server.
Obtaining JWT tokens
After starting the MCP server, JWT tokens are required for authentication. Each token contains encrypted database credentials and user information. You can either use the interactive generator to create tokens or input parameters in the command line.
Generating a token using the interactive generator
Run the following and respond to the prompts:
$ /opt/vertica/bin/vertica_mcp_server --generate-token
Missing required parameters for non-interactive mode (--userid and --dbpass).
Falling back to interactive token generation...

═══════════════════════════════════════════════════════════════
              JWT Token Generator for MCP Server
                (with LevelDB Storage & VCluster)
═══════════════════════════════════════════════════════════════

Enter User ID: mcp_admin
Enter Database User: dbadmin
Enter Database Password:
Enter Expiration (days from now, default 365):
Enter Description (optional):
Enter VCluster Roles (comma-separated, allowed: 'admin', 'operator', 'viewer'; optional): admin
Generating JWT token...

✓ Token generated successfully!

Token Details:
  User ID:      mcp_admin
  DB User:      dbadmin
  Expires:      2027-06-09 06:03:12 EDT
  Valid Days:   365 days
  Roles:        [admin]
  Storage:      /opt/vertica/config/mcp_server/userdb

JWT Token:
<JWT_TOKEN>

You can now use this token in your MCP client requests:
  curl -k -X POST https://localhost:8667/mcp \
    -H "Content-Type: application/json" \
    -H "X-Api-Key: <JWT_TOKEN>" \
    -d '{...}'
Run (with all parameters specified):
$ /opt/vertica/bin/vertica_mcp_server --generate-token \
>   --userid my_mcp_viewer \
>   --dbuser mydbuser \
>   --dbpass mypassword \
>   --description "my viewer" \
>   --roles "viewer"

✓ Token generated successfully!

Token Details:
  User ID:      my_mcp_viewer
  DB User:      mydbuser
  Expires:      2027-06-09 10:35:38 EDT
  Valid Days:   365 days
  Roles:        [viewer]
  Storage:      /opt/vertica/config/mcp_server/userdb

JWT Token:
<JWT_TOKEN>

You can now use this token in your MCP client requests:
  curl -k -X POST https://localhost:8667/mcp \
    -H "Content-Type: application/json" \
    -H "X-Api-Key: <JWT_TOKEN>" \
    -d '{...}'
Multiple tokens per user
A user can have multiple tokens registered in the MCP server. For example, to use different AI clients with separate tokens. Each token requires a unique user_id in the token registry, while sharing the same database username and password. The VCluster server role can be the same or different for each token.
For example, user Bob can register two tokens:
user_id: bob_claude: Mapped to Bob's database credentials with an operator role.user_id: bob_gemini: Mapped to the same credentials with a viewer role.
Admin tokens are an exception. To obtain full admin privileges, the user_id must be set to admin. Only one admin token can be registered at a time, consistent with how database admin privileges are managed. An admin user can still create additional tokens with other user IDs to perform non-admin tasks.
Token security best practices
- Use short expiration times for sensitive environments (30-90 days).
- Store tokens securely - treat them like passwords.
- Never commit tokens to version control.
- Rotate tokens regularly - regenerate before expiration.
- Use HTTPS only - never send tokens over unencrypted connections.
- Monitor audit logs - review authentication attempts.
VCluster server roles and permissions
The MCP server uses VCluster server role-based access control (RBAC) to manage user permissions. Each JWT token is associated with a database user account, and the VCluster server role. MCP user inherits all database privileges from the mapped database user account while VCluster server role assigned to that MCP user determines what VCluster operations they can perform through the MCP server.
Role overview
The following table provides a brief overview of VCluster server roles:
|
Role |
Description |
|
admin |
Full access to all VCluster server operations, including query execution, VCluster management, job queue operations, and user management. Inherits all database privileges from the mapped database user. |
|
operator |
Can view VCluster status, start/stop VCluster, and manage job queue operations. Cannot scale/configure VCluster or manage users. |
|
viewer |
Read-only access to view VCluster status and monitor job queue operations, providing subcluster and sandbox information that can be used to redirect queries issued via the MCP server to specific subclusters or sandboxes. Cannot perform administrative tasks. |
Note
Assign the operator role only to trusted users, as it allows them to start and stop the cluster.
Role permissions overview
The following table summarizes the operations available for each role:
|
Operation |
admin |
operator |
viewer |
|
Execute SQL queries |
✓ |
✓ |
✓ |
|
View schema/catalog |
✓ |
✓ |
✓ |
|
VCluster status / list |
✓ |
✓ |
✓ |
|
VCluster start/stop |
✓ |
✓ |
✗ |
|
VCluster scale/config |
✓ |
✗ |
✗ |
|
Create/manage MCP users |
✓ |
✗ |
✗ |
|
Job queue operations |
✓ |
✓ |
✓ |
Post-upgrade steps
If you upgraded from Vertica 26.1 with an existing MCP server configuration, perform the following steps:
- Stop the MCP Server if it was already started.
- Delete the MCP Server configuration directory
/opt/vertica/config/mcp_server. This ensures the new VCluster server roles are enforced in the MCP server.
- Generate a new token for each existing MCP server user to apply the updated VCluster server roles included in the MCP token.
- Start the MCP Server.
- Use the new token to connect to the MCP server.
1 - Claude Desktop example
Examples for configuring and using the OpenText Analytics Database MCP server with Claude Desktop.
This page provides examples for configuring the OpenText™ Analytics Database MCP server with Claude Desktop.
Configuring MCP server with Claude Desktop
Claude Desktop can connect to your MCP server to enable database query capabilities within Claude conversations.
Prerequisites
- Claude Desktop installed (latest version).
- MCP server running and accessible.
- Valid JWT token for authentication.
- Certificates to access VCluster server from the database administrator. For database adminstrators, the default certificates are located at
/opt/vertica/config/vcluster_server/.
- NPX tool mcp-remote (
npm install -g mcp-remote).
Configuration
The Claude Desktop configuration file location varies by OS:
- macOS:
~/Library/Application Support/Claude/claude_desktop_config.json
- Windows:
%APPDATA%\Claude\claude_desktop_config.json
- Linux:
~/.config/Claude/claude_desktop_config.json
Edit the configuration file and add your MCP server. Example configuration:
{
  "mcpServers": {
    "vertica-mcp-server": {
      "command": "npx",
      "args": [
        "mcp-remote",
        "https://ip-address/mcp",
        "--insecure",
        "--tls-skip-verify",
        "--cert",
        "<path_to_certificate>\\certfile.pem",
        "--key",
        "<path_to_key_file>\\keyfile.key",
        "--ca-cert".
        "<path_to_ca_cert>\\ca.pem",
        "--header",
        "X-API-Key:${API_KEY_VALUE}"
        ],
      "env": {
        "NODE_TLS_REJECT_UNAUTHORIZED": "0",
        "API_KEY_VALUE": "replace with your API key"
      }
    }
  }
}
Verifying the configuration
- Restart Claude Desktop after saving the configuration (make sure kill all background processes)
- Check Claude's MCP status - look for your server in the MCP panel
- Test with a simple query:
SELECT version()
2 - Curl examples
Examples for using the OpenText Analytics Database MCP server with curl for testing and automation.
This page provides curl examples for testing and automating interactions with the OpenText™ Analytics Database MCP server. This is provided as a developer guide for interacting with the APIs.
Using the MCP server with curl
For testing and automation, you can interact with the MCP server directly using curl.
All MCP requests use JSON-RPC 2.0 format:
curl -k -X POST https://localhost:8667/mcp \
  -H "Content-Type: application/json" \
  -H "X-Api-Key: YOUR_JWT_TOKEN" \
  -d '{
    "jsonrpc": "2.0",
    "method": "METHOD_NAME",
    "params": {
      "key": "value"
    },
    "id": 1
  }'
Initialize connection
First, initialize the MCP session:
curl -k -X POST https://localhost:8667/mcp \
  -H "Content-Type: application/json" \
  -H "X-Api-Key: eyJhbGciOiJIUzI1NiIsInR5cCI6IkpXVCJ9..." \
  -d '{
    "jsonrpc": "2.0",
    "method": "initialize",
    "params": {
      "protocolVersion": "2024-11-05",
      "capabilities": {
        "roots": {
          "listChanged": true
        }
      },
      "clientInfo": {
        "name": "curl-client",
        "version": "1.0.0"
      }
    },
    "id": 1
  }'
Response:
{
  "jsonrpc": "2.0",
  "id": 1,
  "result": {
    "protocolVersion": "2024-11-05",
    "serverInfo": {
      "name": "vertica-mcp-server",
      "version": "1.0.0"
    },
    "capabilities": {
      "tools": {},
      "resources": {},
      "prompts": {}
    }
  }
}
Discover what tools are available:
curl -k -X POST https://localhost:8667/mcp \
  -H "Content-Type: application/json" \
  -H "X-Api-Key: eyJhbGciOiJIUzI1NiIsInR5cCI6IkpXVCJ9..." \
  -d '{
    "jsonrpc": "2.0",
    "method": "tools/list",
    "params": {},
    "id": 2
  }'
Response:
{
  "jsonrpc": "2.0",
  "id": 2,
  "result": {
    "tools": [
      {
        "name": "execute_query",
        "description": "Execute SQL queries against Vertica database",
        "inputSchema": {
          "type": "object",
          "properties": {
            "query": {
              "type": "string",
              "description": "SQL query to execute"
            },
            "subcluster": {
              "type": "string",
              "description": "Optional subcluster name"
            }
          },
          "required": ["query"]
        }
      },
      {
        "name": "submit_queue_query",
        "description": "Submit long-running query to job queue"
      },
      {
        "name": "list_jobs",
        "description": "List all jobs in the queue"
      }
    ]
  }
}
Execute a query
Run a simple SQL query:
curl -k -X POST https://localhost:8667/mcp \
  -H "Content-Type: application/json" \
  -H "X-Api-Key: eyJhbGciOiJIUzI1NiIsInR5cCI6IkpXVCJ9..." \
  -d '{
    "jsonrpc": "2.0",
    "method": "tools/call",
    "params": {
      "name": "execute_query",
      "arguments": {
        "query": "SELECT version()"
      }
    },
    "id": 3
  }'
Response:
{
  "jsonrpc": "2.0",
  "id": 3,
  "result": {
    "content": [
      {
        "type": "text",
        "text": "{\"columns\":[\"version\"],\"rows\":[{\"version\":\"Vertica Analytic Database v24.3.0-0\"}],\"count\":1}"
      }
    ]
  }
}
Execute query with subcluster routing
Route query to a specific subcluster:
curl -k -X POST https://localhost:8667/mcp \
  -H "Content-Type: application/json" \
  -H "X-Api-Key: eyJhbGciOiJIUzI1NiIsInR5cCI6IkpXVCJ9..." \
  -d '{
    "jsonrpc": "2.0",
    "method": "tools/call",
    "params": {
      "name": "execute_query",
      "arguments": {
        "query": "SELECT node_name, subcluster_name FROM nodes",
        "subcluster": "analytics_cluster"
      }
    },
    "id": 4
  }'
Submit long-running query to queue
For complex analytics queries that take longer to complete:
curl -k -X POST https://localhost:8667/mcp \
  -H "Content-Type: application/json" \
  -H "X-Api-Key: eyJhbGciOiJIUzI1NiIsInR5cCI6IkpXVCJ9..." \
  -d '{
    "jsonrpc": "2.0",
    "method": "tools/call",
    "params": {
      "name": "submit_queue_query",
      "arguments": {
        "query": "SELECT customer_id, SUM(amount) FROM sales GROUP BY customer_id",
        "description": "Monthly sales by customer"
      }
    },
    "id": 5
  }'
Response:
{
  "jsonrpc": "2.0",
  "id": 5,
  "result": {
    "content": [
      {
        "type": "text",
        "text": "Job submitted successfully. Job ID: 550e8400-e29b-41d4-a716-446655440000"
      }
    ]
  }
}
Check job status
curl -k -X POST https://localhost:8667/mcp \
  -H "Content-Type: application/json" \
  -H "X-Api-Key: eyJhbGciOiJIUzI1NiIsInR5cCI6IkpXVCJ9..." \
  -d '{
    "jsonrpc": "2.0",
    "method": "tools/call",
    "params": {
      "name": "get_job",
      "arguments": {
        "job_id": "550e8400-e29b-41d4-a716-446655440000"
      }
    },
    "id": 6
  }'
List all jobs
curl -k -X POST https://localhost:8667/mcp \
  -H "Content-Type: application/json" \
  -H "X-Api-Key: eyJhbGciOiJIUzI1NiIsInR5cCI6IkpXVCJ9..." \
  -d '{
    "jsonrpc": "2.0",
    "method": "tools/call",
    "params": {
      "name": "list_jobs",
      "arguments": {}
    },
    "id": 7
  }'
Cancel a job
curl -k -X POST https://localhost:8667/mcp \
  -H "Content-Type: application/json" \
  -H "X-Api-Key: eyJhbGciOiJIUzI1NiIsInR5cCI6IkpXVCJ9..." \
  -d '{
    "jsonrpc": "2.0",
    "method": "tools/call",
    "params": {
      "name": "cancel_job",
      "arguments": {
        "job_id": "550e8400-e29b-41d4-a716-446655440000"
      }
    },
    "id": 8
  }'
Health check
Check server health without authentication:
curl -k https://localhost:8667/health
Response:
{
  "status": "healthy",
  "total_pools": 3,
  "max_pools": 100
}
Using jq for pretty output
Format JSON responses with jq:
curl -k -X POST https://localhost:8667/mcp \
  -H "Content-Type: application/json" \
  -H "X-Api-Key: eyJhbGciOiJIUzI1NiIsInR5cCI6IkpXVCJ9..." \
  -d '{
    "jsonrpc": "2.0",
    "method": "tools/call",
    "params": {
      "name": "execute_query",
      "arguments": {
        "query": "SELECT table_name FROM tables LIMIT 5"
      }
    },
    "id": 1
  }' | jq '.'
Bash script example
Create a reusable script for queries:
#!/bin/bash
# mcp_query.sh

API_KEY="eyJhbGciOiJIUzI1NiIsInR5cCI6IkpXVCJ9..."
SERVER="https://localhost:8667/mcp"
QUERY="$1"

if [ -z "$QUERY" ]; then
    echo "Usage: $0 'SQL QUERY'"
    exit 1
fi

curl -k -X POST "$SERVER" \
  -H "Content-Type: application/json" \
  -H "X-Api-Key: $API_KEY" \
  -d "{
    \"jsonrpc\": \"2.0\",
    \"method\": \"tools/call\",
    \"params\": {
      \"name\": \"execute_query\",
      \"arguments\": {
        \"query\": \"$QUERY\"
      }
    },
    \"id\": 1
  }" | jq -r '.result.content[0].text'
Usage:
chmod +x mcp_query.sh
./mcp_query.sh "SELECT COUNT(*) FROM customers"
3 - Query profiling
The Query Profiling feature in MCP Server enables deep analysis of SQL queries, visualization of execution plans, and export of detailed query profile data.
The Query Profiling feature in MCP Server enables deep analysis of SQL queries, visualization of execution plans, and export of detailed query profile data. These tools help you understand query performance, resource usage, and execution flow across OpenText™ Analytics Database nodes and subclusters.
Key features
- Profile storage in tables: Save query profiles in persistent tables within a specified schema, or use temporary tables for ad-hoc analysis.
- Large Language Model (LLM)-driven analysis: Analyze queries using the MCP server's LLM, which processes operator statistics and performance aggregates (such as execution time and resource usage) computed by profiling tools.
- Interactive plan tree visualization: Visualize query plan trees, including data flow volumes and execution times per node, with interactive HTML output.
- Export/import profile data: Export all profile tables as a compressed tarball (.tar.gz) for sharing or offline analysis, and import them into other clusters or tools.
- Subcluster and sandbox support: Profile query execution on specific subclusters or sandboxes by routing requests to the desired subcluster or sandbox.
- Prompt support: Configure and execute analysis prompts with flexible input parameters to tailor profiling to your specific needs.
Profiling workflows
Query profiling supports two distinct workflows:
- Profile and analyze using prompts – A guided, step-by-step approach where the LLM orchestrates the entire workflow, including job monitoring and analysis generation.
- Direct tool access – Ask the LLM to use specific profiling tools directly without the built-in prompts, giving you fine-grained control over each step.
Both approaches produce the same profiling results that can be visualized, exported, and imported. Choose the approach that best fits your workflow.
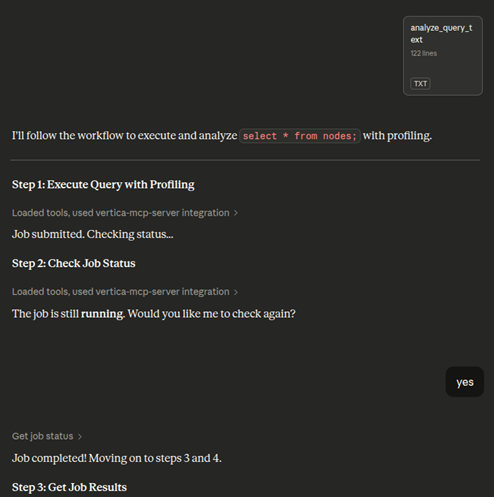
Profile and analyze a query using prompts
-
In the LLM, click Add Connectors, select Add from vertica-mcp-server, and then click Analyze Query.
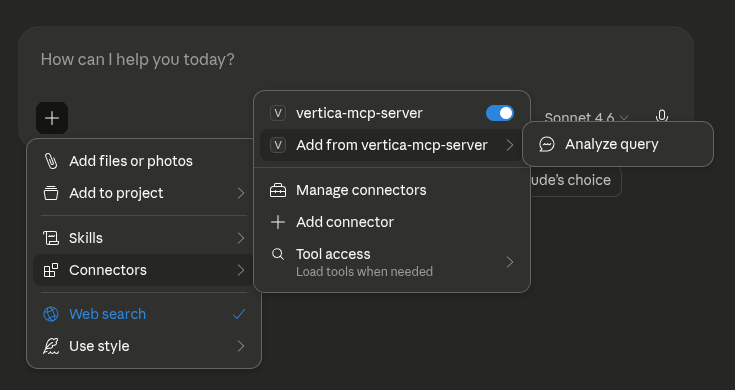
-
To begin profiling a SQL query, enter the required prompt details and click Add prompt:
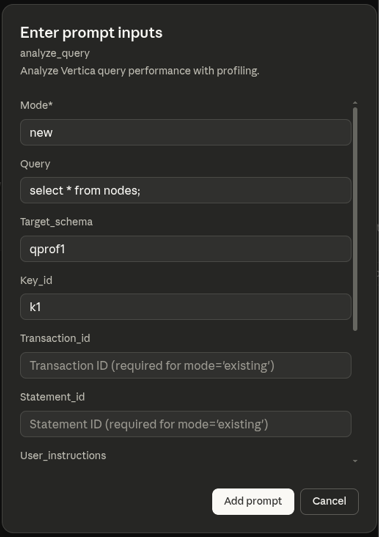
- Mode: Set to
new to execute and profile a new query, or existing to analyze a previously executed query by providing its transaction ID and statement ID.
- Query: The query you want to profile (for example,
select avg(price) from sales;).
- Target_schema: The schema where results will be stored (for example,
qprof1). A new schema is automatically created if it does not already exist.
- Key_id: A unique identifier for this profiling run (for example,
k1). Profile table names have this ID appended (for example, qprof_query_profiles_k1).
- Transaction_id: The transaction id for an existing query.
- Statement_id: The statement id for an existing query.
- User_instructions: Additional instructions to customize the analysis.
- Analysis_scope: Specify the depth of analysis (
basic or detailed). Defaults is basic.
- Subcluster: The subcluster where the query should be executed.
- Sandbox: The sandbox where the query should be executed. If both subcluster and sandbox are specified, sandbox is ignored.
Note
- Transaction ID and Statement ID: Provide
Transaction_id and Statement_id to profile an already-executed query, or provide Query with Mode=new to execute and profile a new query. These fields are required when using Mode=existing, and should be left empty when using Mode=new.
- Key ID: If you leave the Key ID blank for mode
existing, the system auto-generates a timestamp-based identifier. Using an explicit Key ID makes it easier to reference and retrieve your profiling results later.
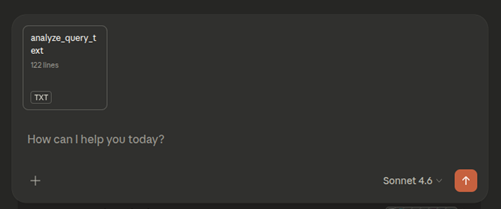
-
Click analyze_query_text in the chat to view the analysis workflow and tools the LLM will use.
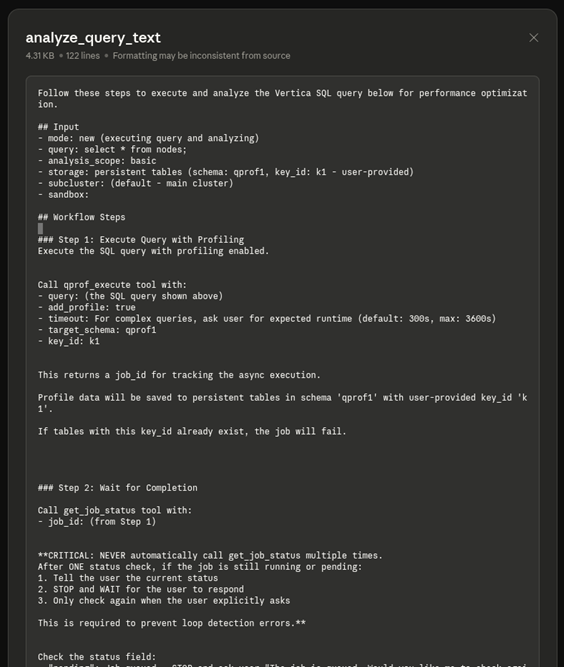
Review workflow steps
The analysis workflow displays the following steps:
- Execute query: The
qprof_execute tool runs the query with profiling enabled.
- Generate job ID: A
job_id is created to track the asynchronous execution.
- Monitor completion: The LLM checks the job status once. If still running, it pauses and waits for your confirmation before checking again to prevent infinite loops.
Execute, monitor, and review analysis
When processing your analysis, the LLM performs these steps:
- Submit and monitor: The job is submitted and checked for completion. If still running, the LLM pauses and requests confirmation before checking again.
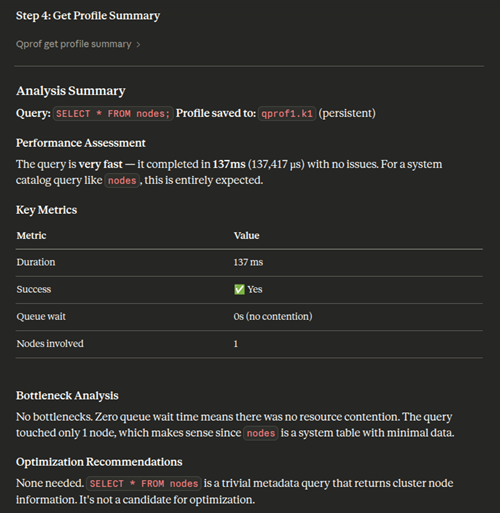
- Generate summary: Once the job completes, the LLM produces a comprehensive profile analysis, including performance assessment, key metrics (duration, success, queue wait time, nodes involved), bottleneck analysis, and optimization recommendations.
Profile storage
Profile data persists in the specified database schema and tables.
Analyze query profiles directly
Alternatively, you can ask the LLM to use specific profiling tools without the built-in prompts. This approach gives you direct control and works independently of the prompt-based workflow.
To use these tools, ask the LLM directly in the chat. For example, "Analyze this query profile using qprof_get_operator_stats" or "Get a summary of my query execution".
You can also analyze existing query profiles saved from previous runs. Provide the schema and key ID where the profile data is stored. For example: "Give me a summary of the query profile that is saved in the schema xyz with key slow_query". This is useful for analyzing historical query executions without re-executing them.
Available tools:
qprof_get_profile_summary: Get a high-level summary of the query execution, including duration, status, and resource usage.qprof_get_events: Retrieve warnings, optimization hints, and execution issues.qprof_get_resources: Examine resource pool acquisition details and queue wait times.qprof_get_steps: See a detailed breakdown of execution phases and timing.qprof_get_operator_stats: Analyze operator-level performance metrics (for example, slowest operators, memory usage).qprof_get_path_stats: View aggregated statistics at the query plan path level.qprof_get_plan: Get the raw EXPLAIN plan for the query.qprof_get_plan_tree: Retrieve the complete query plan tree with structure, metrics, and operator details. This is best suited for LLM or programmatic analysis.
Each tool provides a focused view or set of metrics to help you understand and troubleshoot query performance.
Visualize, export, and import results
The following capabilities work with both profiling approaches above. Use them to interact with and share your profiling data.
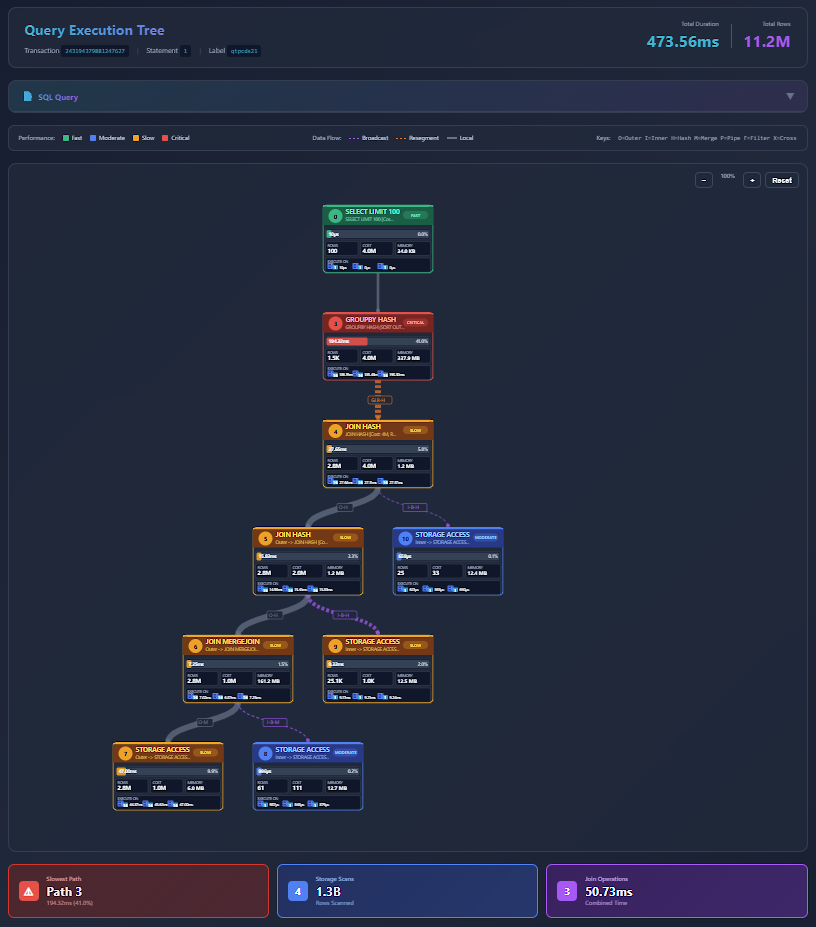
Visualize query profile tree
You can visualize the query execution tree by asking the LLM to generate an interactive visualization:
- Ask the LLM to visualize the query profile tree. Optionally, provide your MCP server IP and port.
- The LLM generates an HTML file saved on the MCP server and provides a link to view it. To access the link, ensure you have network access to the MCP server's IP address and port (accounting for any port mappings in your environment).
- Open the provided link in a browser to view the visualization.
- The visualization tree displays all the details of the query profile. You can zoom in and out and interact with the query tree to analyze query execution.
Note
The query profile tree is generated as an HTML file on the MCP server rather than sent directly to your agent. This approach significantly reduces token usage. Alternatively, you can request an embedded object format to load the tree directly in agents such as Claude Desktop, though this option requires more tokens.
Export query profile data
You can export all profile tables as a compressed tarball (.tar.gz) for sharing or further analysis.
- Ask the LLM to export the profiling data.
- The system generates the profile export details and a download link for the profile tarball (.tar.gz).
- Open the link in a browser to download the tarball (.tar.gz) to share or analyze offline.
Import and analyze query profiles
You can import profile data from other clusters or tools for analysis in your current environment. You can also import a tarball (.tar.gz) into VCluster using Query Profile and use the target schema and key ID to analyze using the MCP Server Query Profiling tools. For more information about Query Profile in the VCluster UI, see Query Profile.