Monitoring existing infrastructure using MC
Use Management Console to monitor the health of your Vertica databases and clusters. Click the Infrastructure button on the Home page to see the Databases and Clusters page. Then click the cluster of interest to view the health of the nodes in that cluster and the key information associated with the cluster such as:
-
Vertica version
-
Number of hosts
-
CPU type
-
Last updated date
-
Node list.
You can also zoom in and out for better view of this page.
On the Databases and Clusters page or the Home page, click the database which you want to monitor, to go to its Overview page:
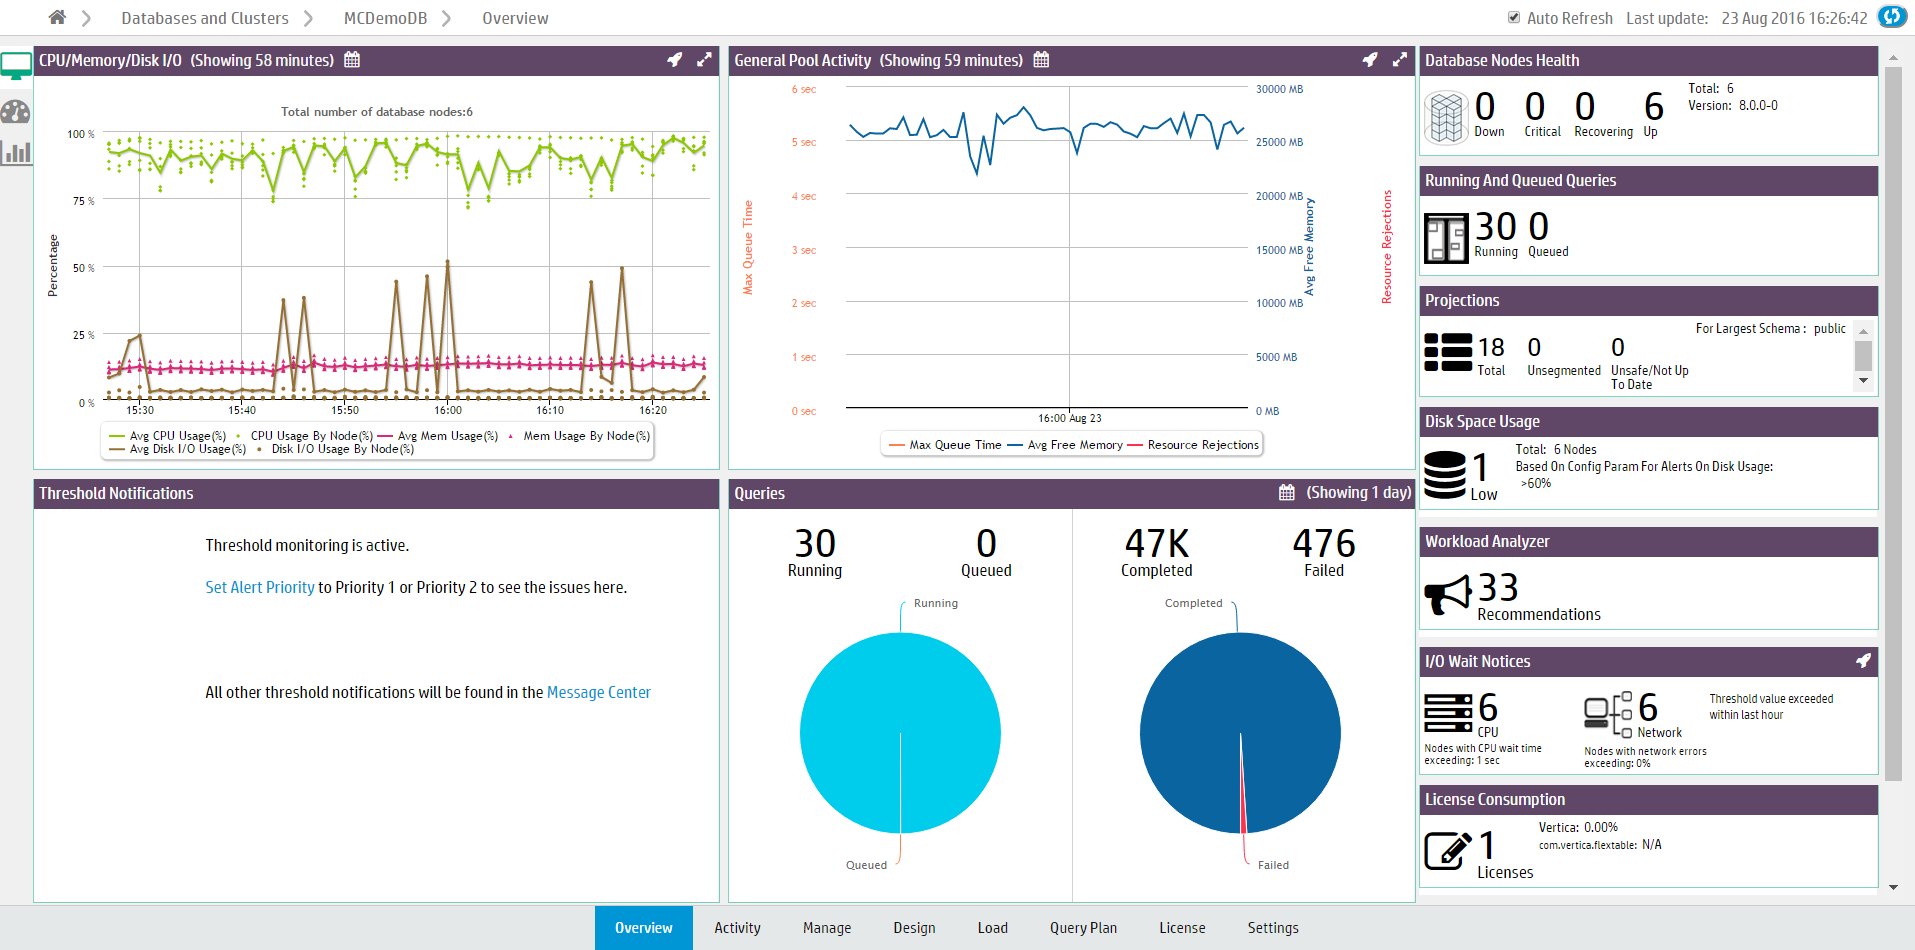
You can perform the following tasks from the Overview page:
-
View Quick Stats to get instant alerts and information about your cluster's status.
-
View Status Summary that provides a general overview of the status of your cluster (as shown in preceding figure).
-
Analyze System Health using a comprehensive summary of your system resource usage and node information, with configurable statistics that allow you to specify acceptable ranges of resource usage.
-
Use Query Synopsis to monitor system query activity and resource pool usage.
For Eon mode databases, the Status Summary and Query Synopsis pages allow you to display information for the entire database. If subclusters are defined, you can also display information for a specific subcluster or node, or the nodes not assigned to a subcluster.
Additionally, you can perform the following tasks from the Overview page:
- Monitoring cluster nodes with MC
- Monitoring cluster CPU and Memory with MC
- Monitoring cluster performance with MC
Monitoring system resources
On the main window, you can click the database, and navigate to the MC Activity tab to monitor system resources such as:
Monitoring node and MC user activity
You can use the MC Manage page to monitor node activity. When you click the node you want to investigate, the Node Detail page opens and provides:
-
Summary information for the node
-
Resources consumed by the node for last three hours
You can also browse and export log-level data from AgentTools and Vertica log files. MC retains a maximum of 2000 log records. See Monitoring node activity with MC for further details.
Use MC Diagnostics tab and navigate to Audit Log page to manage MC User activity. See Monitoring MC user activity using audit log.
Monitoring messages in databases managed by MC
You can view critical database related messages from MC Message Center. The MC Message Center reports on several critical database-related conditions using a color code to indicate the message severity. For further details, see Monitoring database messages and alerts with MC.
You can also search and sort database messages, mark messages read or unread and delete them. You can filter messages by message type, and export messages. For additional information, refer to Message center and Exporting MC-managed database messages and logs.
Monitoring and configuring resource pools
Use the MC Activity page to monitor resource pools. Select the resource pool you want to monitor. MC displays the following charts for the selected pool:
-
Resource Usages in Pool
-
Memory Usage in Node and Subclusters
-
Average Query Execution and Query Time in Pool
-
Resource Rejections in Pool
If you are a database administrator, you can click the database you want on the main window. You can then use the MC Settings tab to view and edit the resource pool parameters. Only the database administrator can monitor and configure the resource pools in Management Console.
See Monitoring resource pools with MC for further information.