This is the multi-page printable view of this section.
Click here to print.
Return to the regular view of this page.
Getting started with MC
Use Management Console to monitor the performance of your Vertica clusters.
Use Management Console to monitor the performance of your Vertica clusters. This tool provides a graphical view of your Vertica database cluster, nodes, network status, and detailed monitoring charts and graphs.
MC allows you to:
-
Create, import, and connect to Vertica databases.
-
Manage your Vertica database and clusters.
-
Receive and view messages regarding the health and performance of your Vertica database and clusters.
-
View diagnostics and support information for Management Console.
-
Manage application and user settings for Management Console.
MC installation process
To install MC, complete these tasks:
-
Follow the steps listed in Installing Management Console.
-
After you have installed MC, configure it according to the instructions in Configuring Management Console.
1 - Connecting to MC
To connect to Management Console:.
To connect to Management Console:
-
Open a supported web browser.
-
Enter the IP address or host name of the host on which you installed MC (or any cluster node if you installed Vertica first), followed by the MC port you assigned when you configured MC. For example:
Enter the IP address and port:
https://10.20.30.40:5450/
Enter the host name and port:
https://hostname:5450/
-
When the MC logon dialog appears, enter your MC username and password and click Log in.
Note
When MC users log in to the MC interface, MC checks their privileges on Vertica
Data collector (DC) tables on MC-monitored databases. Based on DC table privileges, along with the role assigned the MC user, each user's access to the MC's Overview, Activity and Node details pages could be limited. See
Users, roles, and privileges in MC for more information.
If you do not have an MC username/password, contact your MC administrator.
Managing client connections
Each client session to MC uses a connection from MaxClientSessions, a database configuration parameter. This parameter determines the maximum number of sessions that can run on a single database cluster node. Sometimes multiple MC users, mapped to the same database account, are concurrently monitoring the Overview and Activity pages.
Tip
You can increase the value for
MaxClientSessions on an MC-monitored database to account for extra sessions. See
Managing sessions for details.
2 - Management Console toolbar and navigation
How to navigate the Management console.
The toolbar and left navigation pane are available in all areas of the Management Console (MC).
The toolbar provides icons for quick access to important MC features:

You can view Message Center notifications, change the MC user interface (UI) text language, access Vertica resources, and access user account options.
Message Center quick view
The Message Center quick view is the bell icon on the left. The number in the red circle slightly above the bell icon indicates the current number of alerts. To view these alerts, select the bell icon to open the following quick view window:
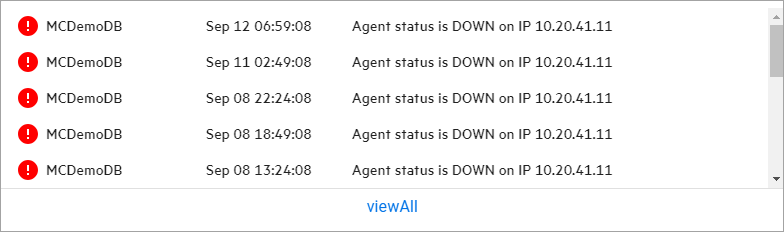
Select viewAll to go to the Message Center. For additional details, see Monitoring database messages and alerts with MC.
Language selector
The language selector is the globe icon and language description located to the right of the Message Center bell icon. It lets you select the current language that the MC uses for UI text.
To change languages, select the globe icon or language description, and select a language from the dropdown:

By default, the MC displays UI text in English - United States. To add new languages, you must configure the MC with a set of language files. For details, see Localizing user interface text.
The user account menu provides quick links to Vertica resources, password management for local users, and a Log out option:
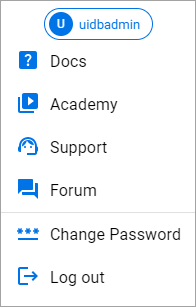
For details about managing passwords, see User authentication in MC.
Navigation pane
The Management Console (MC) left navigation pane provides access to system-level MC options and section-specific options in a single, multi-level component. Each system-level option has section-specific options that display to the right of the selected system-level option.
System-level options
The system-level navigation pane provides access to MC options from any area within the MC:
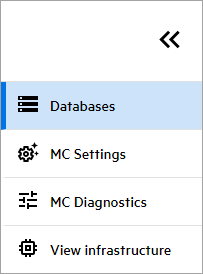
This pane provides the following options:
To expand or collapse the system-level navigation, select the double arrows located above the options.
Section-specific options
When you select a system-level option, the navigation displays a menu that lists options for the system-level option. For example, the following image shows the options avialable for the system-level MC Settings:
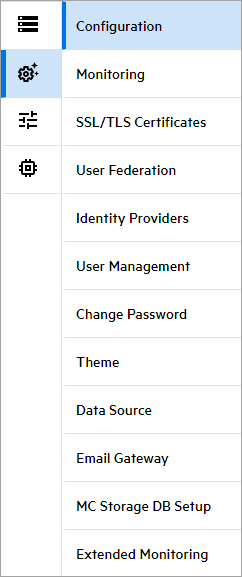
When section-specific options are displayed, the system-level pane collapses. To view the expanded system-level options, hover the cursor over the collapsed pane.
3 - Management Console home page
After you connect to MC and sign in, the Home page displays.
After you log in to the MC, the Databases page displays. Your assigned roles and privileges determine what information you can view and which areas you can access.
The following image is an example of what the MC SUPER administrator views after login:
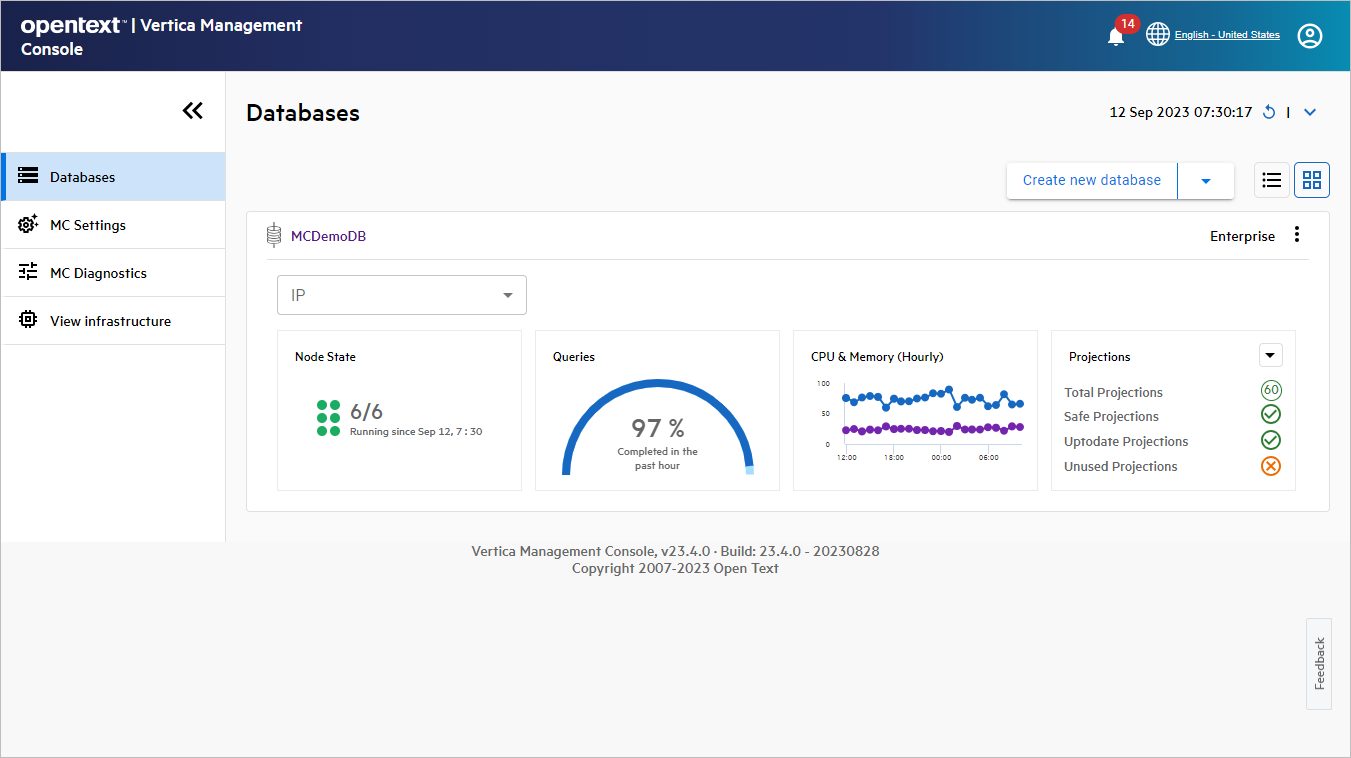
Databases overview
The Databases page displays a dynamic dashboard that describes the health and important statistics for all databases that the MC manages. If you have not yet created or imported a database with the MC, this page lists no databases.
Dashboard refresh
The MC provides dashboard refresh options so you can view the most recent information about your databases:

The refresh section consists of the following:
- Timestamp that displays the date and time of the most recent dashboard refresh.
- Manual refresh icon that refreshes the dashboard as needed.
- Auto Refresh feature, which is available from the down arrow to the right of the manual refresh icon. You can select the down arrow, then select the Auto Refresh box so that the MC refreshes the dashboard every two minutes.
Database actions
You can perform database actions with the dropdown directly below the refresh options. The following image shows the expanded dropdown:
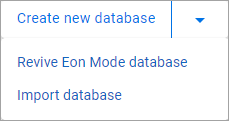
The Create new database option is always displayed. The dropdown lists the following database actions:
Note
Your environment determines the options available in the dropdown. For example, if you deploy only an Enterprise database, the Revive Eon Mode database option is not in the list.
Database views
The MC provides information about your databases in detailed or condensed views. To select the view, use the icons to the right of the database actions dropdown:

The left button displays the Condensed view, and the right button displays the Detailed view. Both views provide the following features:
- If the database contains multiple subclusters, the subclusters are grouped together in a single tile. Within that database tile, there is a row that displays information for each subcluster. The default subcluster is displayed in the top row of each database tile.
- You can select the database name in the top-left of the database tile and go to its Overview page.
- The IP dropdown lists the IP addresses of each node in the database. Select an IP address from the list to monitor the node activity.
- The vertical ellipses in the top-right of each database tile provides the following options:
Detailed view
By default, the MC displays database information in the detailed view. The following image shows two databases, and the first database has two subclusters:
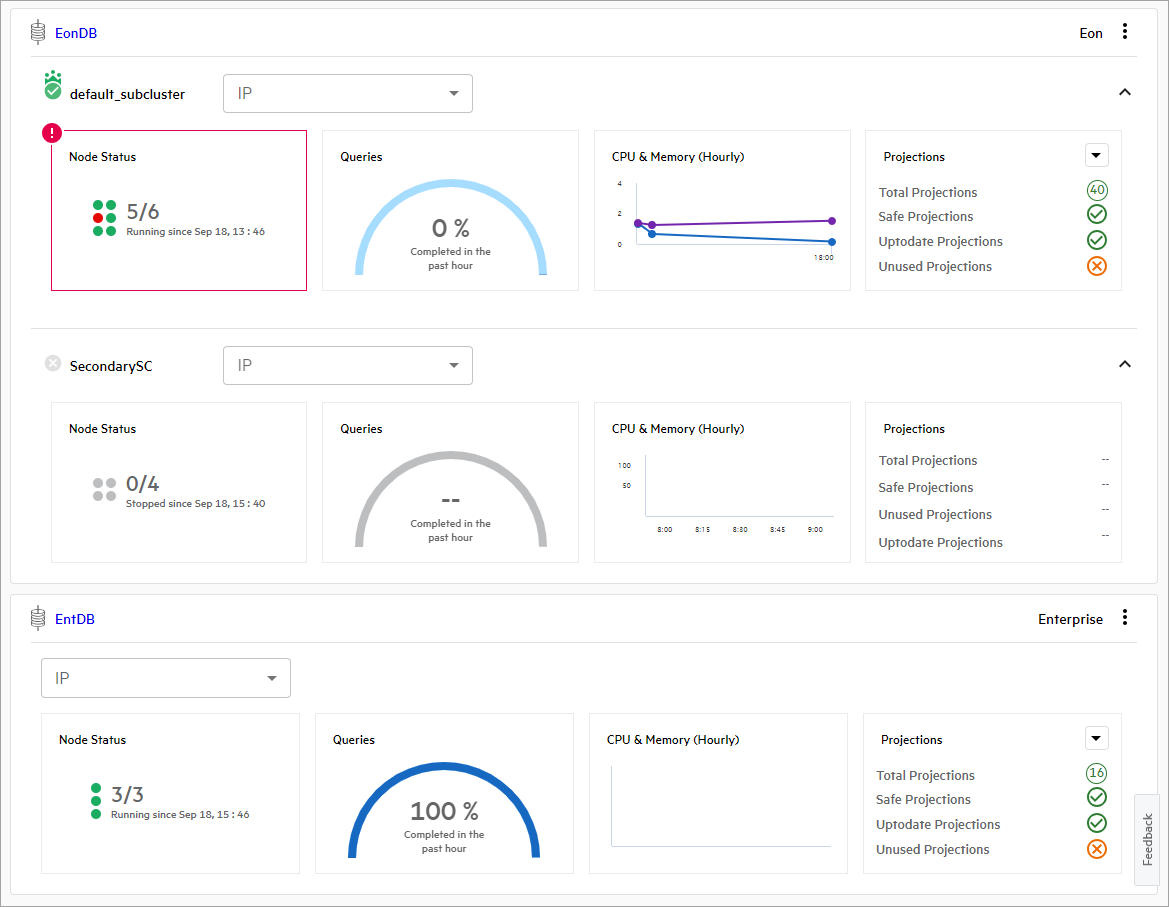
Each subcluster row contains four tiles that display the following information:
-
Node State: Graphic representation of the node state for the cluster. This tile displays how many nodes are in the UP state and when the database was last started or stopped. Select this tile to go to the database's Manage page to view the subcluster layout.
Each circle represents a database node, and its color represents its state:
- Green: Node is healthy and UP.
- Yellow: Critical state and needs attention.
- Red: Node is DOWN.
- Gray: Cluster is stopped, and the node is DOWN.
-
Queries: Query success rate for the past hour.
Select this tile to go to the Query Monitoring page.
-
CPU & Memory (Hourly): Database CPU and memory usage for the past hour.
Select this tile to go to the Overview page.
-
Projections: Details about the database projections. Select the down arrow to view the projections for a specific schema.
Select this tile to go to the Table Utilization page in the Activity section.
If there are multiple subclusters in a database, you can toggle the arrow in the top-right of the subcluster row to collapse or expand the subcluster row.
Condensed view
The condensed view displays minimal information about each database and its subclusters. If you have multiple databases, this view lets you view more information on the screen simultaneously. The following image shows two databases, and the first database has two subclusters:
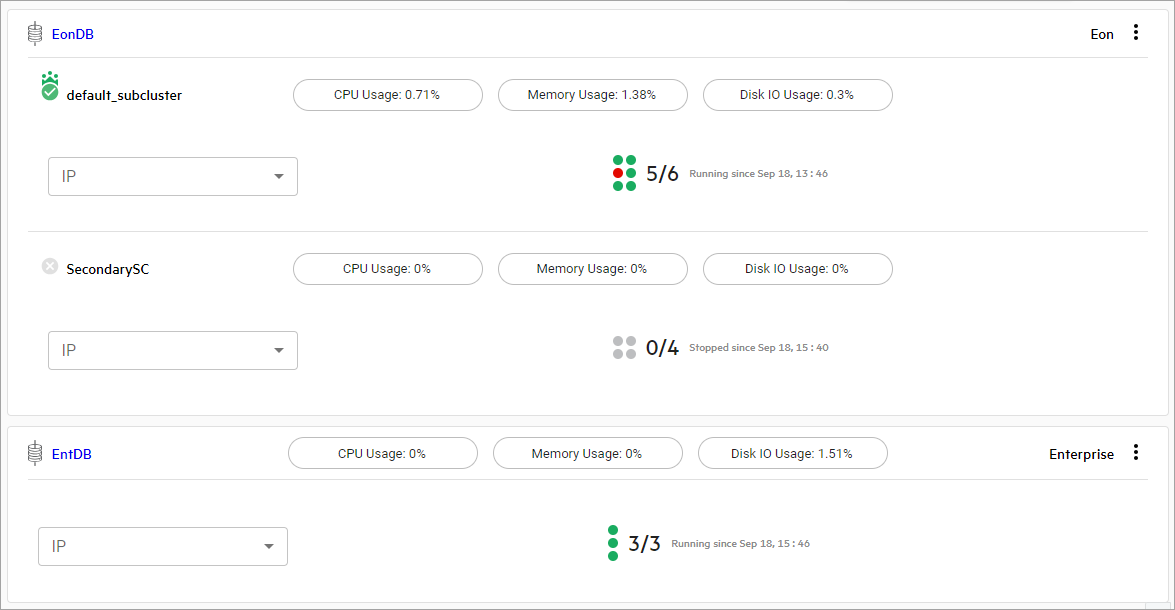
To view a description of the current status of your database, hover your cursor over the subcluster name.
Each subcluster row contains buttons that display important cluster information. You can select one fo the following buttons to go to the Overview page and view detailed information about the cluster:
- CPU Usage
- Memory Usage
- Disk IO Usage
Below the buttons, there is a graphic representation of the node state for the subcluster and a timestamp that describes when the subcluster last started or stopped.
4 - Creating a cluster using MC
After you install and configure MC, you can use Management Console to install a Vertica cluster on hosts where Vertica software has not been installed.
Enterprise Mode only
After you install and configure MC, you can use Management Console to install a Vertica cluster on hosts where Vertica software has not been installed. The Cluster Installation assistant lets you specify the hosts you want to include in your Vertica cluster, loads the Vertica software onto the hosts, validates the hosts, and assembles the nodes into a cluster.
Complete the following tasks:
-
Prepare the hosts - Prepare each host that will become a node in the cluster.
-
Create a private key file - MC needs password-less SSH to connect to hosts and install Vertica software. Create a private key to enable MC access to the hosts.
-
Use the MC cluster installation wizard - Use the wizard to install a Vertica cluster on hosts that do not have Vertica software already installed on them.
-
Validate hosts and create the cluster - Host validation is the process where the MC runs tests against each host in a proposed cluster. You must validate hosts before the MC can install Vertica on each host.
After you successfully create a cluster using MC, see Create a database on a cluster.
4.1 - Prepare the hosts
This topic applies only to on-premises installations.
This topic applies only to on-premises installations.
Before you can install a Vertica cluster using the MC, you must prepare each host that will become a node in the cluster. The cluster creation process runs validation tests against each host before it attempts to install the Vertica software. These tests ensure that the host is correctly configured to run Vertica.
Validate the hosts
The validation tests provide:
-
Warnings and error messages when they detect a configuration setting that conflicts with the Vertica requirements or any performance issue
-
Suggestions for configuration changes when they detect an issue
Note
The validation tests do not automatically fix all problems they encounter.
All hosts must pass validation before the cluster can be created.
If you accepted the default configuration options when installing the OS on your host, then the validation tests will likely return errors, since some of the default options used on Linux systems conflict with Vertica requirements. See Operating system configuration overview for details on OS settings. To speed up the validation process you can perform the following steps on the prospective hosts before you attempt to validate the hosts. These steps are based on Red Hat Enterprise Linux and CentOS systems, but other supported platforms have similar settings.
4.2 - Create a private key file
Before you can install a cluster, Management Console must be able to access the hosts on which you plan to install Vertica.
Before you can install a cluster, Management Console must be able to access the hosts on which you plan to install Vertica. MC uses password-less SSH to connect to the hosts and install Vertica software using a private key file.
If you already have a private key file that allows access to all hosts in the potential cluster, you can use it in the cluster creation wizard.
Note
The private key file is required to complete the MC cluster installation wizard.
Create a private key file
-
Log into the server as root or as a user with sudo privileges.
-
Change to your home directory.
$ cd ~
-
Create an .ssh directory if one does not already exist.
$ mkdir .ssh
-
Generate a passwordless private key/public key pair.
$ ssh-keygen -q -t rsa -f ~/.ssh/vid_rsa -N ''
This command creates two files: vid_rsa and vid_rsa.pub. The vid_rsa file is the private key file that you upload to the MC so that it can access nodes on the cluster and install Vertica. The vid_rsa.pub file is copied to all other hosts so that they can be accessed by clients using the vid_rsa file.
-
Make your .ssh directory readable and writable only by yourself.
$ chmod 700 /root/.ssh
-
Change to the .ssh directory.
$ cd ~/.ssh
-
Edit sshd.config as follows to disable password authentication for root:
PermitRootLogin without-password
-
Concatenate the public key into to the file vauthorized_keys2.
$ cat vid_rsa.pub >> vauthorized_keys2
-
If the host from which you are creating the public key will also be in the cluster, copy the public key into the local-hosts authorized key file:
cat vid_rsa.pub >> authorized_keys
-
Make the files in your .ssh directory readable and writable only by yourself.
$ chmod 600 ~/.ssh/*
-
Create the .ssh directory on the other nodes.
$ ssh <host> "mkdir /root/.ssh"
-
Copy the vauthorized key file to the other nodes.
$ scp -r /root/.ssh/vauthorized_keys2 <host>:/root/.ssh/.
-
On each node, concatenate the vauthorized_keys2 public key to the authorized_keys file and make the file readable and writable only by the owner.
$ ssh <host> "cd /root/.ssh/;cat vauthorized_keys2 >> authorized_keys; chmod 600 /root/.ssh/authorized_keys"
-
On each node, remove the vauthorized_keys2 file.
$ ssh -i /root/.ssh/vid_rsa <host> "rm /root/.ssh/vauthorized_keys2"
-
Copy the vid_rsa file to the workstation from which you will access the MC cluster installation wizard. This file is required to install a cluster from the MC.
A complete example of the commands for creating the public key and allowing access to three hosts from the key is below. The commands are being initiated from the docg01 host, and all hosts will be included in the cluster (docg01 - docg03):
ssh docg01
cd ~/.ssh
ssh-keygen -q -t rsa -f ~/.ssh/vid_rsa -N ''
cat vid_rsa.pub > vauthorized_keys2
cat vid_rsa.pub >> authorized_keys
chmod 600 ~/.ssh/*
scp -r /root/.ssh/vauthorized_keys2 docg02:/root/.ssh/.
scp -r /root/.ssh/vauthorized_keys2 docg03:/root/.ssh/.
ssh docg02 "cd /root/.ssh/;cat vauthorized_keys2 >> authorized_keys; chmod 600 /root/.ssh/authorized_keys"
ssh docg03 "cd /root/.ssh/;cat vauthorized_keys2 >> authorized_keys; chmod 600 /root/.ssh/authorized_keys"
ssh -i /root/.ssh/vid_rsa docg02 "rm /root/.ssh/vauthorized_keys2"
ssh -i /root/.ssh/vid_rsa docg03 "rm /root/.ssh/vauthorized_keys2"
rm ~/.ssh/vauthorized_keys2
4.3 - Use the MC cluster installation wizard
The Cluster Installation Wizard guides you through the steps required to install a Vertica cluster on hosts that do not already have Vertica software installed.
The Cluster Installation Wizard guides you through the steps required to install a Vertica cluster on hosts that do not already have Vertica software installed.
Note
If you are using MC with the Vertica AMI on Amazon Web Services, note that the Create Cluster and Import Cluster options are not supported.
Prerequisites
Before you proceed, make sure you:
-
Installed and configured Management Console.
-
Prepared the hosts that you will include in the Vertica database cluster.
-
Created the private key (pem) file and copied it to your local machine.
-
Obtained a copy of your Vertica license if you are installing the Premium Edition. If you are using the Community Edition, a license key is not required.
-
Downloaded the Vertica server RPM (or DEB file).
-
Have read/copy permissions on files stored on the local browser host that you will transfer to the host on which MC is installed.
Permissions on files to transfer to MC
On your local workstation, you must have at least read/write privileges on files you'll upload to MC through the Cluster Installation Wizard. These files include the Vertica server package, the license key (if needed), the private key file, and an optional CSV file of IP addresses.
Create a Vertica cluster using MC
-
Connect to Management Console and log in as an MC administrator.
-
On MC's Home page, click the Provisioning task. The Provisioning dialog appears.
-
Click Create new database.
-
The Create Cluster wizard opens. Provide the following information:
-
Cluster name—A label for the cluster. Choose a name that is unique within MC. IF you do not enter a name here, MC assigns a random unique cluster name. You can edit the name later when you view the cluster on the Infrastructure page. Note that this name is an alias that exists only in MC. If you reimport the cluster, you would need to edit the cluster name again to reestablish this name.
-
Vertica Admin User—The user that is created on each of the nodes when they are installed, typically 'dbadmin'. This user has access to Vertica and is also an OS user on the host.
-
Password for the Vertica Admin User—The password you enter (required) is set for each node when MC installs Vertica.
Note
MC does not support an empty password for the administrative user.
-
Vertica Admin Path—Storage location for catalog files, which defaults to /home/dbadmin unless you specified a different path during MC configuration (or later on MC's Settings page).
Important
The Vertica Admin Path must be the same as the Linux database administrator's home directory. If you specify a path that is not the Linux dbadmin's home directory, MC returns an error.
-
Click Next and specify the private key file and host information:
-
Click Browse and navigate to the private key file (vid_rsa) that you created earlier.
Note
You can change the private key file at the beginning of the validation stage by clicking the name of the private key file in the bottom-left corner of the page. However, you cannot change the private key file after validation has begun unless the first host fails validation due to an SSH login error.
-
Include the host IP addresses. You have three options:
Specify later (but include number of nodes). This option allows you to specify the number of nodes, but not the specific IPs. You can specify the specific IPs before you validate hosts.
Import IP addresses from local file. You can specify the hosts in a CSV file using either IP addresses or host names.
Enter a range of IP addresses. You can specify a range of IPs to use for new nodes. For example 192.168.1.10 to 192.168.1.30. The range of IPs must be on the same or contiguous subnets.
-
Click Next and select the software and license:
-
Vertica Software. If one or more Vertica packages have been uploaded, you can select one from the list. Otherwise, select Upload a new local vertica binary file and browse to a Vertica server file on your local system.
-
Vertica License. Click Browse and navigate to a local copy of your Vertica license if you are installing the Premium Edition. Community Edition versions require no license key.
-
Click Next. The Create cluster page opens. If you did not specify the IP addresses, select each host icon and provide an IP address by entering the IP in the box and clicking Apply for each host you add.
You are now ready to Validate hosts and create the cluster.
4.4 - Validate hosts and create the cluster
Host validation is the process where the MC runs tests against each host in a proposed cluster.
Host validation is the process where the MC runs tests against each host in a proposed cluster.
You can validate hosts only after you have completed the cluster installation wizard. You must validate hosts before the MC can install Vertica on each host.
At any time during the validation process, but before you create the cluster, you can add and remove hosts by clicking the appropriate button in the upper left corner of the page on MC. A Create Cluster button appears when all hosts that appear in the node list are validated.
How to validate hosts
To validate one or more hosts:
-
Connect to Management Console and log in as an MC administrator.
-
On the MC Home page, click the Databases and Clusters task.
-
In the list of databases and clusters, select the cluster on which you have recently run the cluster installation wizard (Creating... appears under the cluster) and click View.
-
Validate one or several hosts:
-
To validate a single host, click the host icon, then click Validate Host.
-
To validate all hosts at the same time, click All in the Node List, then click Validate Host.
-
To validate more than one host, but not all of them, Ctrl+click the host numbers in the node list, then click Validate Host.
-
Wait while validation proceeds.
The validation step takes several minutes to complete. The tests run in parallel for each host, so the number of hosts does not necessarily increase the amount of time it takes to validate all the hosts if you validate them at the same time. Hosts validation results in one of three possible states:
-
Green check mark—The host is valid and can be included in the cluster.
-
Orange triangle—The host can be added to the cluster, but warnings were generated. Click the tests in the host validation window to see details about the warnings.
-
Red X—The host is not valid. Click the tests in the host validation window that have red X's to see details about the errors. You must correct the errors re-validate or remove the host before MC can create the cluster.
To remove an invalid host: Highlight the host icon or the IP address in the Node List and click Remove Host.
All hosts must be valid before you can create the cluster. Once all hosts are valid, a Create Cluster button appears near the top right corner of the page.
How to create the cluster
-
Click Create Cluster to install Vertica on each host and assemble the nodes into a cluster.
The process, done in parallel, takes a few minutes as the software is copied to each host and installed.
-
Wait for the process to complete. When the Success dialog opens, you can do one of the following:
See Creating a Database on a Cluster for details on creating a database on the new cluster.
4.5 - Create a database on a cluster
After you use the MC Cluster Installation Wizard to create a Vertica cluster, you can create a database on that cluster through the MC interface.
After you use the MC Cluster Installation Wizard to create a Vertica cluster, you can create a database on that cluster through the MC interface. You can create the database on all cluster nodes or on a subset of nodes.
If a database had been created using the Administration Tools on any of the nodes, MC detects (autodiscovers) that database and displays it on the Manage (Cluster Administration) page so you can import it into the MC interface and begin monitoring it.
MC allows only one database running on a cluster at a time, so you might need to stop a running database before you can create a new one.
The following procedure describes how to create a database on a cluster that you created using the MC Cluster Installation Wizard. To create a database on a cluster that you created by running the install_vertica script, see Creating an Empty Database.
Create a database on a cluster
To create a new empty database on a new cluster:
-
If you are already on the Databases and Clusters page, skip to the next step. Otherwise:
-
Connect to MC and sign in as an MC administrator.
-
On the Home page, select View Infrastructure.
-
If no databases exist on the cluster, continue to the next step. Otherwise:
-
If a database is running on the cluster on which you want to add a new database, select the database and click Stop.
-
Wait for the running database to have a status of Stopped.
-
Click the cluster on which you want to create the new database and click Create Database.
-
The Create Database wizard opens. Provide the following information:
-
Database name and password. See Creating a database name and password for rules.
-
Optionally click Advanced to open the advanced settings and change the port, and catalog path, and data path. By default the MC application/web server port is 5450 and paths are /home/dbadmin, or whatever you defined for the paths when you ran the cluster creation wizard. Do not use the default agent port 5444 as a new setting for the MC application/web server port. See MC Settings > Configuration for port values.
-
Click Continue.
-
Select nodes to include in the database.
The Database Configuration window opens with the options you provided and a graphical representation of the nodes appears on the page. By default, all nodes are selected to be part of this database (denoted by a green check mark). You can optionally click each node and clear Include host in new database to exclude that node from the database. Excluded nodes are gray. If you change your mind, click the node and select the Include check box.
-
Click Create in the Database Configuration window to create the database on the nodes.
The creation process takes a few moments and then the database is started and a Success message appears.
-
Click OK to close the success message.
The Database Manager page opens and displays the database nodes. Nodes not included in the database are gray.
5 - Monitoring existing infrastructure using MC
Use Management Console to monitor the health of your Vertica databases and clusters.
Use Management Console to monitor the health of your Vertica databases and clusters. Click the Infrastructure button on the Home page to see the Databases and Clusters page. Then click the cluster of interest to view the health of the nodes in that cluster and the key information associated with the cluster such as:
-
Vertica version
-
Number of hosts
-
CPU type
-
Last updated date
-
Node list.
You can also zoom in and out for better view of this page.
On the Databases and Clusters page or the Home page, click the database which you want to monitor, to go to its Overview page:
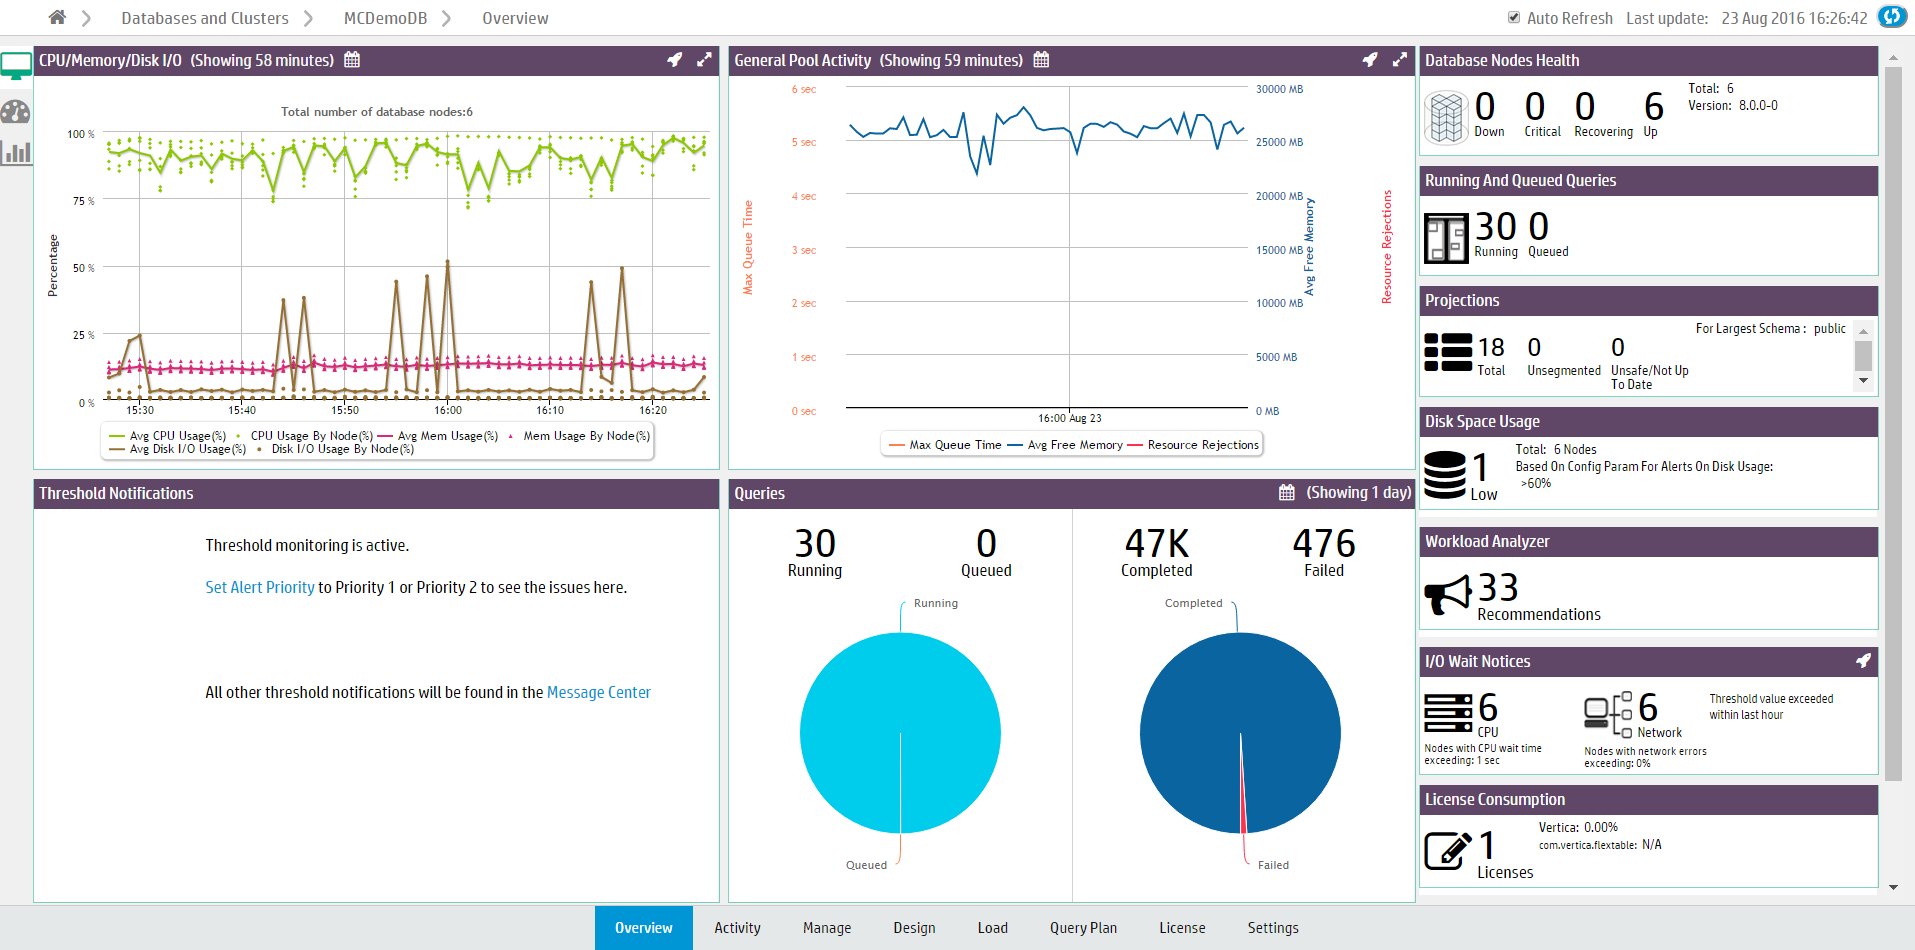
You can perform the following tasks from the Overview page:
-
View Quick Stats to get instant alerts and information about your cluster's status.
-
View Status Summary that provides a general overview of the status of your cluster (as shown in preceding figure).
-
Analyze System Health using a comprehensive summary of your system resource usage and node information, with configurable statistics that allow you to specify acceptable ranges of resource usage.
-
Use Query Synopsis to monitor system query activity and resource pool usage.
For Eon mode databases, the Status Summary and Query Synopsis pages allow you to display information for the entire database. If subclusters are defined, you can also display information for a specific subcluster or node, or the nodes not assigned to a subcluster.
Additionally, you can perform the following tasks from the Overview page:
Monitoring system resources
On the main window, you can click the database, and navigate to the MC Activity tab to monitor system resources such as:
Monitoring node and MC user activity
You can use the MC Manage page to monitor node activity. When you click the node you want to investigate, the Node Detail page opens and provides:
You can also browse and export log-level data from AgentTools and Vertica log files. MC retains a maximum of 2000 log records. See Monitoring node activity with MC for further details.
Use MC Diagnostics tab and navigate to Audit Log page to manage MC User activity. See Monitoring MC user activity using audit log.
Monitoring messages in databases managed by MC
You can view critical database related messages from MC Message Center. The MC Message Center reports on several critical database-related conditions using a color code to indicate the message severity. For further details, see Monitoring database messages and alerts with MC.
You can also search and sort database messages, mark messages read or unread and delete them. You can filter messages by message type, and export messages. For additional information, refer to Message center and Exporting MC-managed database messages and logs.
Monitoring and configuring resource pools
Use the MC Activity page to monitor resource pools. Select the resource pool you want to monitor. MC displays the following charts for the selected pool:
-
Resource Usages in Pool
-
Memory Usage in Node and Subclusters
-
Average Query Execution and Query Time in Pool
-
Resource Rejections in Pool
If you are a database administrator, you can click the database you want on the main window. You can then use the MC Settings tab to view and edit the resource pool parameters. Only the database administrator can monitor and configure the resource pools in Management Console.
See Monitoring resource pools with MC for further information.