Management Console home page
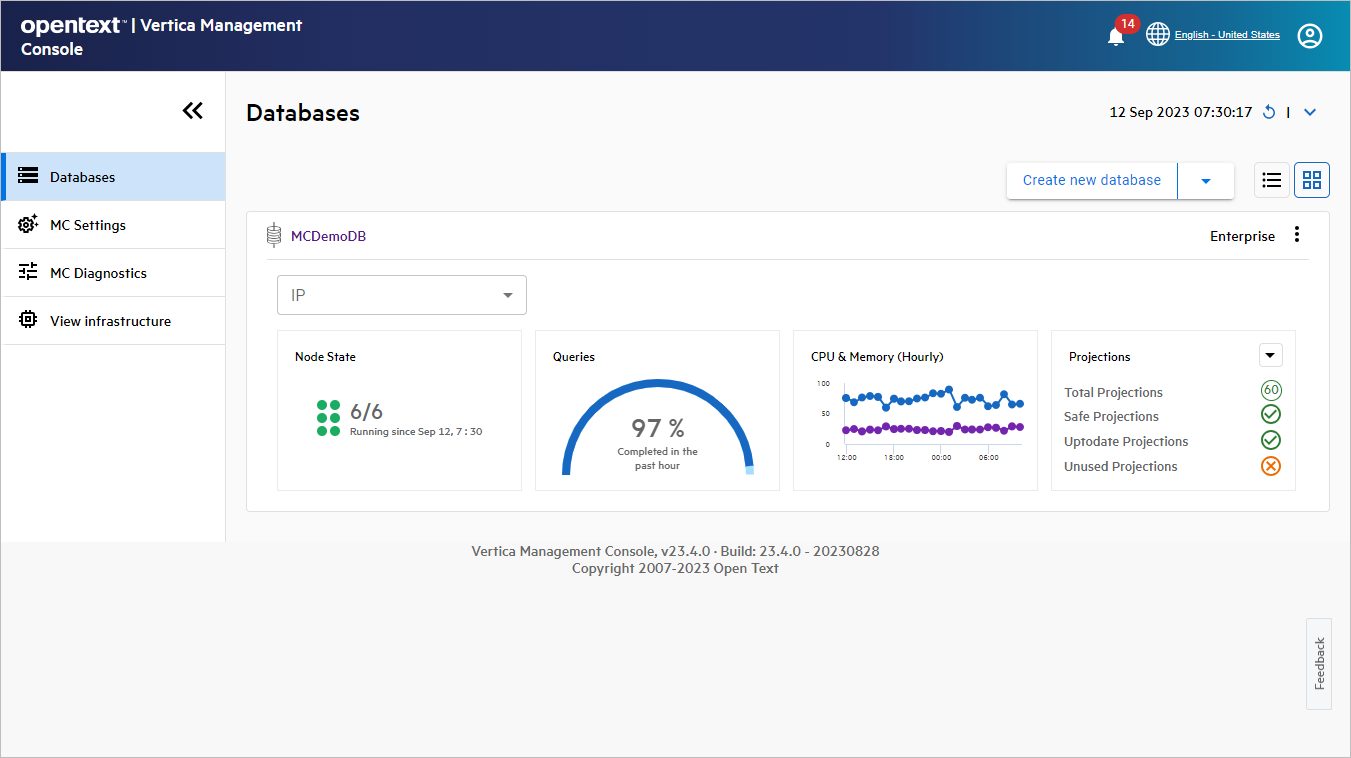
After you log in to the MC, the Databases page displays. Your assigned roles and privileges determine what information you can view and which areas you can access.
The following image is an example of what the MC SUPER administrator views after login:
Databases overview
The Databases page displays a dynamic dashboard that describes the health and important statistics for all databases that the MC manages. If you have not yet created or imported a database with the MC, this page lists no databases.
Dashboard refresh
The MC provides dashboard refresh options so you can view the most recent information about your databases:

The refresh section consists of the following:
- Timestamp that displays the date and time of the most recent dashboard refresh.
- Manual refresh icon that refreshes the dashboard as needed.
- Auto Refresh feature, which is available from the down arrow to the right of the manual refresh icon. You can select the down arrow, then select the Auto Refresh box so that the MC refreshes the dashboard every two minutes.
Database actions
You can perform database actions with the dropdown directly below the refresh options. The following image shows the expanded dropdown:
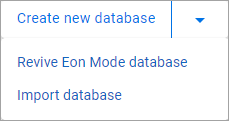
The Create new database option is always displayed. The dropdown lists the following database actions:
- Revive Eon Mode database. For details, see the revive documentation for your cloud provider.
- Import database.
Note
Your environment determines the options available in the dropdown. For example, if you deploy only an Enterprise database, the Revive Eon Mode database option is not in the list.Database views
The MC provides information about your databases in detailed or condensed views. To select the view, use the icons to the right of the database actions dropdown:

The left button displays the Condensed view, and the right button displays the Detailed view. Both views provide the following features:
- If the database contains multiple subclusters, the subclusters are grouped together in a single tile. Within that database tile, there is a row that displays information for each subcluster. The default subcluster is displayed in the top row of each database tile.
- You can select the database name in the top-left of the database tile and go to its Overview page.
- The IP dropdown lists the IP addresses of each node in the database. Select an IP address from the list to monitor the node activity.
- The vertical ellipses in the top-right of each database tile provides the following options:
- Manage Database to go to the Manage page to view your subcluster layout.
- Execute Query to go the Query Execution page.
Detailed view
By default, the MC displays database information in the detailed view. The following image shows two databases, and the first database has two subclusters:
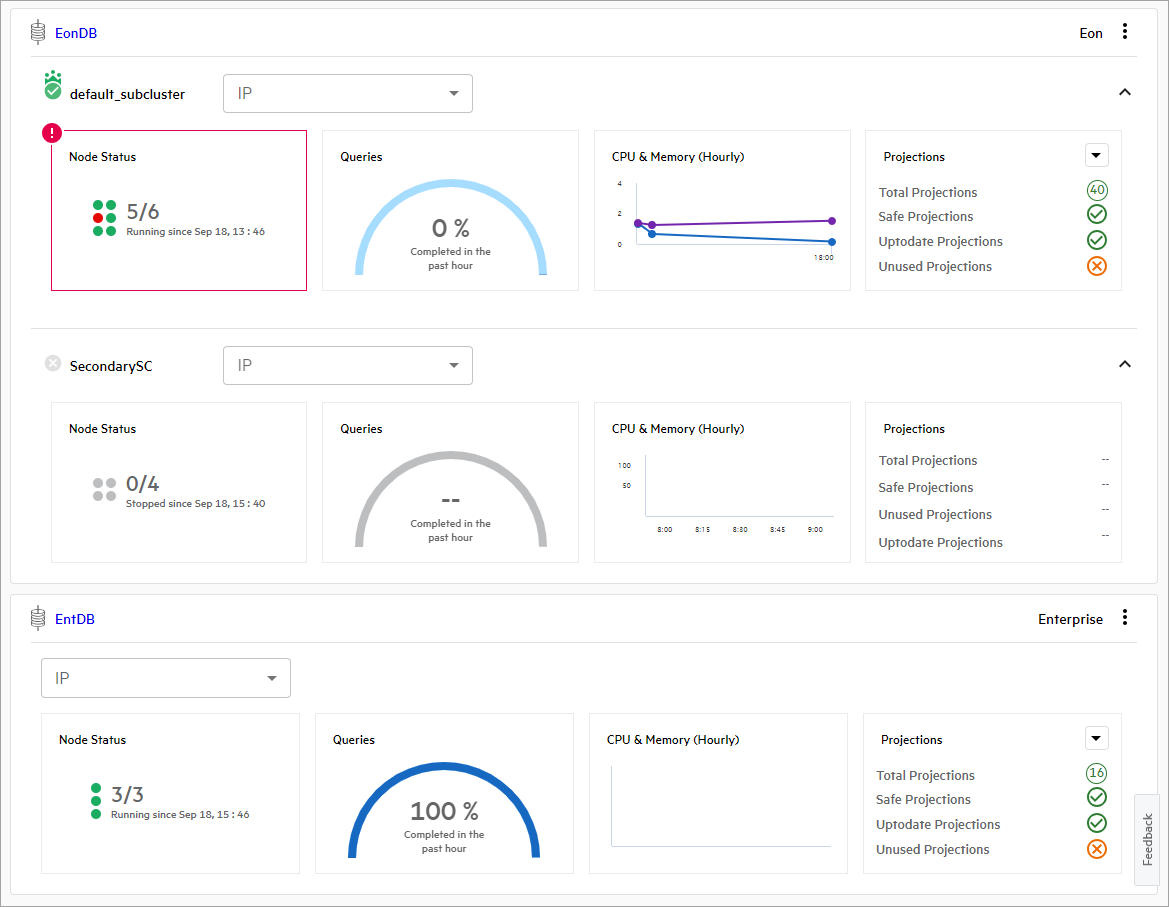
Each subcluster row contains four tiles that display the following information:
-
Node State: Graphic representation of the node state for the cluster. This tile displays how many nodes are in the UP state and when the database was last started or stopped. Select this tile to go to the database's Manage page to view the subcluster layout.
Each circle represents a database node, and its color represents its state:
- Green: Node is healthy and UP.
- Yellow: Critical state and needs attention.
- Red: Node is DOWN.
- Gray: Cluster is stopped, and the node is DOWN.
-
Queries: Query success rate for the past hour.
Select this tile to go to the Query Monitoring page.
-
CPU & Memory (Hourly): Database CPU and memory usage for the past hour.
Select this tile to go to the Overview page.
-
Projections: Details about the database projections. Select the down arrow to view the projections for a specific schema.
Select this tile to go to the Table Utilization page in the Activity section.
If there are multiple subclusters in a database, you can toggle the arrow in the top-right of the subcluster row to collapse or expand the subcluster row.
Condensed view
The condensed view displays minimal information about each database and its subclusters. If you have multiple databases, this view lets you view more information on the screen simultaneously. The following image shows two databases, and the first database has two subclusters:
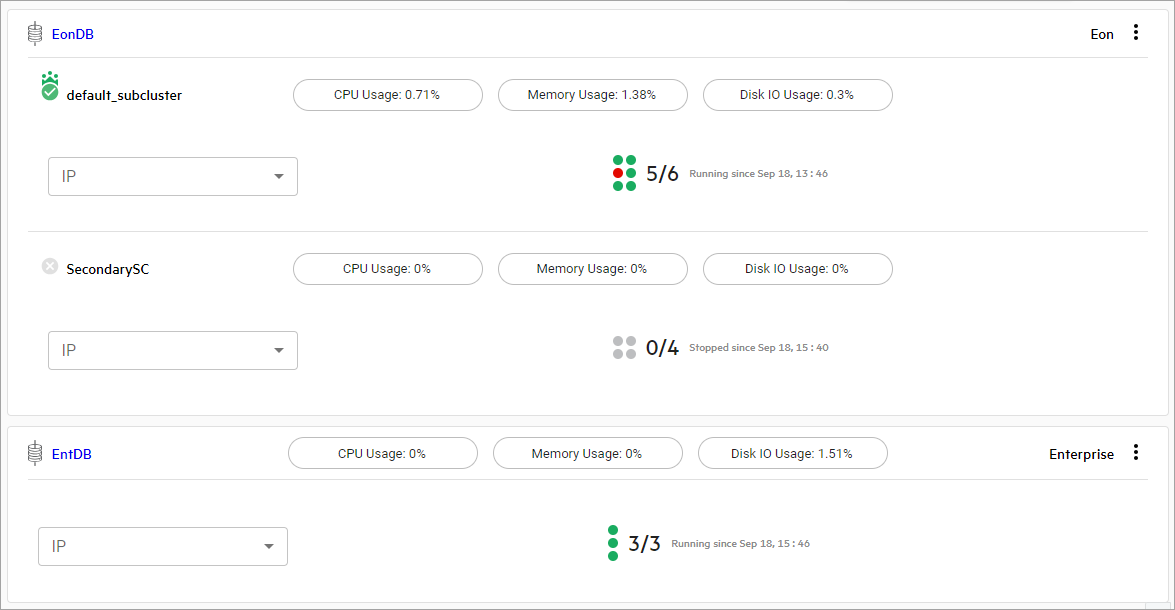
To view a description of the current status of your database, hover your cursor over the subcluster name.
Each subcluster row contains buttons that display important cluster information. You can select one fo the following buttons to go to the Overview page and view detailed information about the cluster:
- CPU Usage
- Memory Usage
- Disk IO Usage
Below the buttons, there is a graphic representation of the node state for the subcluster and a timestamp that describes when the subcluster last started or stopped.