Management Console home page
After you connect to MC and sign in, the Home page displays. This page is the entry point to all Vertica database clusters and users managed by MC. Information on this page, as well as throughout the MC interface, will appear or be hidden, based on the permissions (access levels) of the user who is logged in. The following image is what an MC super administrator sees.
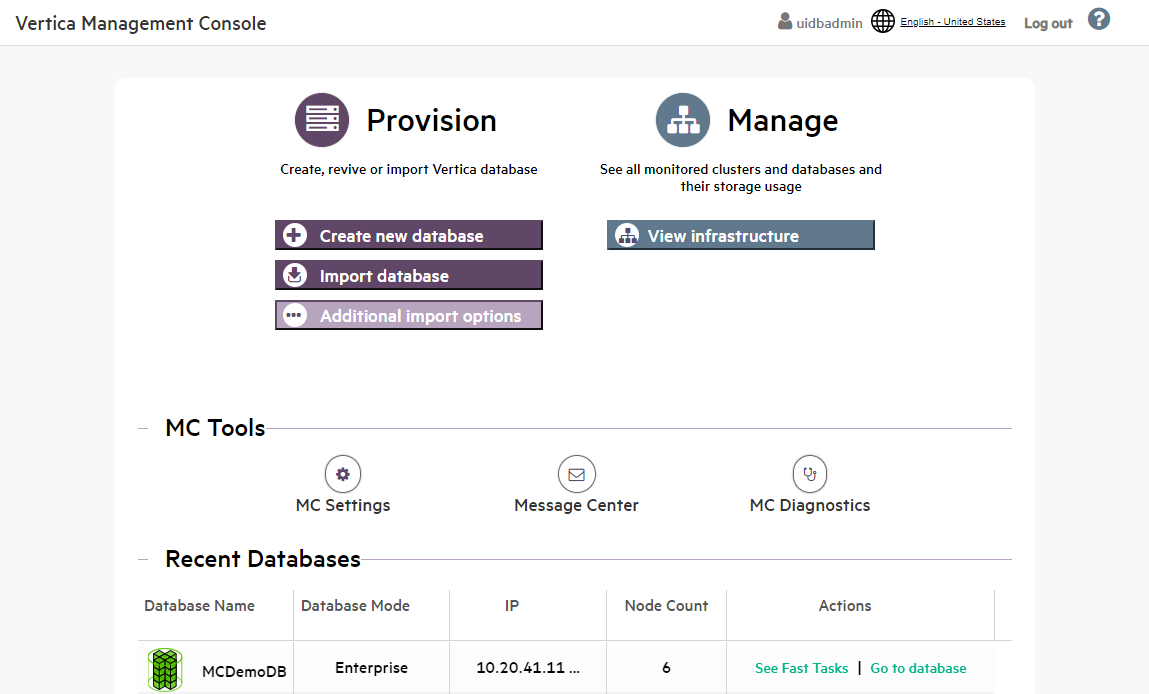
Operations you can perform in Management Console are grouped into the following areas:
-
Provision. Create new Vertica databases, or import existing ones to manage and monitor with MC. You can also import a Vertica cluster that resides in a Hadoop environment. See Managing database clusters.
-
Manage. View all the clusters and databases monitored by MC, stop and remove databases, and view details about databases and clusters. See Viewing cluster infrastructure.
MC tools
-
MC Settings. Configure MC and user settings, as well as use the MC interface to install Vertica on a cluster of hosts. See Management Console settings.
-
Message Center. View, sort, and search database messages and optionally export messages to a file. See Monitoring Database Messages in MC.
-
MC Diagnostics. View and resolve MC-related issues, as well as browse Vertica agent and audit logs. See Troubleshooting with MC diagnostics.
Recent databases
The Recent Databases section displays all databases that you created on or imported into MC. An empty space under Recent Databases means that you have not yet created or imported a database into the MC interface, or do not have permission to view any databases managed by MC.
Recent Databases lists each database name, its number of nodes, and two actions: Fast Tasks and Go to Database.
Fast tasks
Fast Tasks are key tasks you can perform on that database using MC. The Fast Tasks page provides the following options:
-
Manage and View Your Vertica Database. See the monitoring dashboard for your database. Explore the tabs below your dashboard, which provide more ways to manage the database.
-
Connect to your Vertica Database Using SQL. Use Management Console to run SQL queries on your database from within your browser.
-
Load Your Data into Vertica Database. The Data Load Activity page allows you to monitor and perform data loading jobs. To load data from an S3 bucket into pre-existing tables in your database, select the Instance tab and click New S3 Data Load.
If you installed Management Console with Provisioning through the AWS Marketplace, you had the option to install a database pre-loaded with example clickstream analytic data. If you did so, the Fast Tasks page lists two additional links:
-
Play with Example Data in Your Vertica Database (PDF). This PDF guide provides instructions and example SQL queries you can use in Vertica to analyze the example data.
-
Vertica Workbook for Tableau (PDF). This PDF guide provides instructions on how to analyze the example data pre-loaded into Vertica, using a Tableau dashboard.
Go to database
View the Overview page, which displays a dynamic dashboard of your database's health and activity. Explore the tabs below your dashboard, which provide more ways to manage the database.
You can install and manage multiple databases with MC, but you can have only one database running on a single cluster at a time. UP databases appear in green and DOWN databases are red.