This section describes how to manage the Vertica database. It includes the following topics:
This is the multi-page printable view of this section. Click here to print.
Managing the database
This section describes how to manage the Vertica database.
- 1: Managing nodes
- 1.1: Stop Vertica on a node
- 1.2: Restart Vertica on a node
- 1.3: Setting node type
- 1.4: Active standby nodes
- 1.4.1: Creating an active standby node
- 1.4.2: Replace a node with an active standby node
- 1.4.3: Revert active standby nodes
- 1.5: Large cluster
- 1.5.1: Planning a large cluster
- 1.5.2: Enabling large cluster
- 1.5.3: Changing the number of control nodes and realigning
- 1.5.4: Monitoring large clusters
- 1.6: Multiple databases on a cluster
- 1.7: Fault groups
- 1.7.1: About the fault group script
- 1.7.2: Creating a fault group input file
- 1.7.3: Creating fault groups
- 1.7.4: Monitoring fault groups
- 1.7.5: Dropping fault groups
- 1.8: Terrace routing
- 1.9: Elastic cluster
- 1.9.1: Scaling factor
- 1.9.2: Viewing scaling factor settings
- 1.9.3: Setting the scaling factor
- 1.9.4: Local data segmentation
- 1.9.5: Elastic cluster best practices
- 1.10: Adding nodes
- 1.10.1: Adding hosts to a cluster
- 1.10.2: Adding nodes to a database
- 1.10.3: Add nodes to a cluster in AWS
- 1.11: Removing nodes
- 1.11.1: Automatic eviction of unhealthy nodes
- 1.11.2: Lowering K-Safety to enable node removal
- 1.11.3: Removing nodes from a database
- 1.11.4: Removing hosts from a cluster
- 1.11.5: Remove nodes from an AWS cluster
- 1.12: Replacing nodes
- 1.12.1: Replacing a host using the same name and IP address
- 1.12.2: Replacing a failed node using a node with a different IP address
- 1.12.3: Replacing a functioning node using a different name and IP address
- 1.12.4: Using the administration tools to replace nodes
- 1.13: Rebalancing data across nodes
- 1.13.1: Rebalancing data using the administration tools UI
- 1.13.2: Rebalancing data using SQL functions
- 1.14: Redistributing configuration files to nodes
- 1.15: Stopping and starting nodes on MC
- 1.16: Upgrading your operating system on nodes in your Vertica cluster
- 1.17: Reconfiguring node messaging
- 1.17.1: re_ip command
- 1.17.2: Restarting a node with new host IPs
- 1.18: Adjusting Spread Daemon timeouts for virtual environments
- 2: Managing disk space
- 2.1: Adding disk space to a node
- 2.2: Replacing failed disks
- 2.3: Catalog and data files
- 2.4: Understanding the catalog directory
- 2.5: Reclaiming disk space from deleted table data
- 3: Memory usage reporting
- 4: Memory trimming
- 5: Tuple mover
- 5.1: Mergeout
- 5.1.1: Mergeout request types and precedence
- 5.1.2: Scheduled mergeout
- 5.1.3: User-invoked mergeout
- 5.1.4: Partition mergeout
- 5.1.5: Deletion marker mergeout
- 5.1.6: Disabling mergeout on specific tables
- 5.1.7: Purging ROS containers
- 5.1.8: Mergeout strata algorithm
- 5.2: Managing the tuple mover
- 6: Managing workloads
- 6.1: Resource manager
- 6.2: Resource pool architecture
- 6.2.1: Defining secondary resource pools
- 6.2.2: Querying resource pool settings
- 6.2.3: User resource allocation
- 6.2.4: Query budgeting
- 6.3: Managing resources at query run time
- 6.3.1: Setting runtime priority for the resource pool
- 6.3.2: Changing runtime priority of a running query
- 6.3.3: Manually moving queries to different resource pools
- 6.4: Restoring resource manager defaults
- 6.5: Best practices for managing workload resources
- 6.5.1: Basic principles for scalability and concurrency tuning
- 6.5.2: Setting a runtime limit for queries
- 6.5.3: Handling session socket blocking
- 6.5.4: Managing workloads with resource pools and user profiles
- 6.5.4.1: Periodic batch loads
- 6.5.4.2: CEO query
- 6.5.4.3: Preventing runaway queries
- 6.5.4.4: Restricting resource usage of ad hoc query application
- 6.5.4.5: Setting a hard limit on concurrency for an application
- 6.5.4.6: Handling mixed workloads: batch versus interactive
- 6.5.4.7: Setting priorities on queries issued by different users
- 6.5.4.8: Continuous load and query
- 6.5.4.9: Prioritizing short queries at run time
- 6.5.4.10: Dropping the runtime priority of long queries
- 6.5.5: Tuning built-in pools
- 6.5.5.1: Restricting Vertica to take only 60% of memory
- 6.5.5.2: Tuning for recovery
- 6.5.5.3: Tuning for refresh
- 6.5.5.4: Tuning tuple mover pool settings
- 6.5.5.5: Tuning for machine learning
- 6.5.6: Reducing query run time
- 6.5.7: Managing workload resources in an Eon Mode database
- 6.6: Managing system resource usage
- 6.6.1: Managing sessions
- 6.6.2: Managing load streams
- 7: HTTPS service
- 7.1: HTTPS endpoints
- 7.2: Prometheus metrics
1 - Managing nodes
Vertica provides the ability to add, remove, and replace nodes on a live cluster that is actively processing queries.
Vertica provides the ability to add, remove, and replace nodes on a live cluster that is actively processing queries. This ability lets you scale the database without interrupting users.
In this section
1.1 - Stop Vertica on a node
In some cases, you need to take down a node to perform maintenance tasks, or upgrade hardware.
In some cases, you need to take down a node to perform maintenance tasks, or upgrade hardware. You can do this with one of the following:
-
Command line admintools stop_node
Important
Before removing a node from a cluster, check that the cluster has the minimum number of nodes required to comply with K-safety. If necessary, temporarily lower the database K-safety level.Administration tools
-
Run Administration Tools, select Advanced Menu, and click OK.
-
Select Stop Vertica on Host and click OK.
-
Choose the host that you want to stop and click OK.
-
Return to the Main Menu, select View Database Cluster State, and click OK. The host you previously stopped should appear DOWN.
-
You can now perform maintenance.
See Restart Vertica on a Node for details about restarting Vertica on a node.
Command line
You can use the command line tool stop_node to stop Vertica on one or more nodes. stop_node takes one or more node IP addresses as arguments. For example, the following command stops Vertica on two nodes:
$ admintools -t stop_node -s 192.0.2.1,192.0.2.2
1.2 - Restart Vertica on a node
After stopping a node to perform maintenance tasks such as upgrading hardware, you need to restart the node so it can reconnect with the database cluster.
After stopping a node to perform maintenance tasks such as upgrading hardware, you need to restart the node so it can reconnect with the database cluster.
-
Run Administration Tools. From the Main Menu select Restart Vertica on Host and click OK.
-
Select the database and click OK.
-
Select the host that you want to restart and click OK.
Note
This process may take a few moments. -
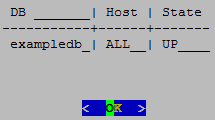
Return to the Main Menu, select View Database Cluster State, and click OK. The host you restarted now appears as UP, as shown.
1.3 - Setting node type
When you create a node, Vertica automatically sets its type to PERMANENT.
When you create a node, Vertica automatically sets its type to PERMANENT. This enables Vertica to use this node to store data. You can change a node's type with
ALTER NODE, to one of the following:
-
PERMANENT: (default): A node that stores data.
-
EPHEMERAL: A node that is in transition from one type to another—typically, from PERMANENT to either STANDBY or EXECUTE.
-
STANDBY: A node that is reserved to replace any node when it goes down. A standby node stores no segments or data until it is called to replace a down node. When used as a replacement node, Vertica changes its type to PERMANENT. For more information, see Active standby nodes.
-
EXECUTE: A node that is reserved for computation purposes only. An execute node contains no segments or data.
Note
STANDBY and EXECUTE node types are supported only in Enterprise Mode.1.4 - Active standby nodes
An active standby node exists is a node in an Enterprise Mode database that is available to replace any failed node.
An active standby node exists is a node in an Enterprise Mode database that is available to replace any failed node. Unlike permanent Vertica nodes, an standby node does not perform computations or contain data. If a permanent node fails, an active standby node can replace the failed node, after the failed node exceeds the failover time limit. After replacing the failed node, the active standby node contains the projections and performs all calculations of the node it replaced.
In this section
1.4.1 - Creating an active standby node
You can create active standby nodes in an Enterprise Mode database at the same time that you create the database, or later.
You can create active standby nodes in an Enterprise Mode database at the same time that you create the database, or later.
Note
When you create an active standby node, be sure to add any necessary storage locations. For more information, refer to Adding Storage Locations.Creating an active standby node in a new database
-
Create a database, including the nodes that you intend to use as active standby nodes.
-
Using vsql, connect to a node other than the node that you want to use as an active standby node.
-
Use ALTER NODE to convert the node from a permanent node to an active standby node. For example:
=> ALTER NODE v_mart_node5 STANDBY;After you issue the ALTER NODE statement, the affected node goes down and restarts as an active standby node.
Creating an active standby node in an existing database
When you create a node to be used as an active standby node, change the new node to ephemeral status as quickly as possible to prevent the cluster from moving data to it.
-
Important
Do not rebalance the database at this stage. -
Using vsql, connect to any other node.
-
Use ALTER NODE to convert the new node from a permanent node to an ephemeral node. For example:
=> ALTER NODE v_mart_node5 EPHEMERAL; -
Rebalance the cluster to remove all data from the ephemeral node.
-
Use ALTER NODE on the ephemeral node to convert it to an active standby node. For example:
=> ALTER NODE v_mart_node5 STANDBY;
1.4.2 - Replace a node with an active standby node
A failed node on an Enterprise Mode database can be replaced with an active standby node automatically, or manually.
A failed node on an Enterprise Mode database can be replaced with an active standby node automatically, or manually.
Important
A node must be down before it can be replaced with an active standby node. Attempts to replace a node that is up return with an error.Automatic replacement
You can configure automatic replacement of failed nodes with parameter FailoverToStandbyAfter. If enabled, this parameter specifies the length of time that an active standby node waits before taking the place of a failed node. If possible, Vertica selects a standby node from the same fault group as the failed node. Otherwise, Vertica randomly selects an available active standby node.
Manual replacement
As an administrator, you can manually replace a failed node with ALTER NODE:
-
Connect to the database with Administration Tools or vsql.
-
Replace the node with ALTER NODE...REPLACE. The REPLACE option can specify a standby node. If REPLACE is unqualified, then Vertica selects a standby node from the same fault group as the failed node, if one is available; otherwise, it randomly selects an available active standby node.
1.4.3 - Revert active standby nodes
When a down node in an Enterprise Mode database is ready for reactivation, you can restore it by reverting its replacement to standby status.
When a down node in an Enterprise Mode database is ready for reactivation, you can restore it by reverting its replacement to standby status. You can perform this operation on individual nodes or the entire database, with ALTER NODE and ALTER DATABASE, respectively:
-
Connect to the database with Administration Tools or via vsql.
-
Revert the standby nodes.
-
Individually with ALTER NODE:
ALTER NODE node-name RESET; -
Collectively across the database cluster with ALTER DATABASE:
ALTER DATABASE DEFAULT RESET STANDBY;
-
If a down node cannot resume operation, Vertica ignores the reset request and leaves the standby node in place.
1.5 - Large cluster
Vertica uses the Spread service to broadcast control messages between database nodes.
Vertica uses the Spread service to broadcast control messages between database nodes. This service can limit the growth of a Vertica database cluster. As you increase the number of cluster nodes, the load on the Spread service also increases as more participants exchange messages. This increased load can slow overall cluster performance. Also, network addressing limits the maximum number of participants in the Spread service to 120 (and often far less). In this case, you can use large cluster to overcome these Spread limitations.
When large cluster is enabled, a subset of cluster nodes, called control nodes, exchange messages using the Spread service. Other nodes in the cluster are assigned to one of these control nodes, and depend on them for cluster-wide communication. Each control node passes messages from the Spread service to its dependent nodes. When a dependent node needs to broadcast a message to other nodes in the cluster, it passes the message to its control node, which in turn sends the message out to its other dependent nodes and the Spread service.

By setting up dependencies between control nodes and other nodes, you can grow the total number of database nodes, and remain in compliance with the Spread limit of 120 nodes.
Note
Technically, when large cluster is disabled, all of the nodes in the cluster are control nodes. In this case, all nodes connect to Spread. When large cluster is enabled, some nodes become dependent on control nodes.A downside of the large cluster feature is that if a control node fails, its dependent nodes are cut off from the rest of the database cluster. These nodes cannot participate in database activities, and Vertica considers them to be down as well. When the control node recovers, it re-establishes communication between its dependent nodes and the database, so all of the nodes rejoin the cluster.
Note
The Spread service demon runs as an independent process on the control node host. It is not part of the Vertica process. If the Vertica process goes down on the node—for example, you use admintools to stop the Vertica process on the host—Spread continues to run. As long as the Spread demon runs on the control node, the node's dependents can communicate with the database cluster and participate in database activity. Normally, the control node only goes down if the node's host has an issue—or example, you shut it down, it becomes disconnected from the network, or a hardware failure occurs.Large cluster and database growth
When your database has large cluster enabled, Vertica decides whether to make a newly added node into a control or a dependent node as follows:
-
In Enterprise Mode, if the number of control nodes configured for the database cluster is greater than the current number of nodes it contains, Vertica makes the new node a control node. In Eon Mode, the number of control nodes is set at the subcluster level. If the number of control nodes set for the subcluster containing the new node is less than this setting, Vertica makes the new node a control node.
-
If the Enterprise Mode cluster or Eon Mode subcluster has reached its limit on control nodes, a new node becomes a dependent of an existing control node.
When a newly-added node is a dependent node, Vertica automatically assigns it to a control node. Which control node it chooses is guided by the database mode:
-
Enterprise Mode database: Vertica assigns the new node to the control node with the least number of dependents. If you created fault groups in your database, Vertica chooses a control node in the same fault group as the new node. This feature lets you use fault groups to organize control nodes and their dependents to reflect the physical layout of the underlying host hardware. For example, you might want dependent nodes to be in the same rack as their control nodes. Otherwise, a failure that affects the entire rack (such as a power supply failure) will not only cause nodes in the rack to go down, but also nodes in other racks whose control node is in the affected rack. See Fault groups for more information.
-
Eon Mode database: Vertica always adds new nodes to a subcluster. Vertica assigns the new node to the control node with the fewest dependent nodes in that subcluster. Every subcluster in an Eon Mode database with large cluster enabled has at least one control node. Keeping dependent nodes in the same subcluster as their control node maintains subcluster isolation.
Important
In versions of Vertica prior to 10.0.1, nodes in an Eon Mode database with large cluster enabled were not necessarily assigned a control node in their subcluster. If you have upgraded your Eon Mode database from a version of Vertica earlier than 10.0.1 and have large cluster enabled, realign the control nodes in your database. This process reassigns dependent nodes and fixes any cross-subcluster control node dependencies. See Realigning Control Nodes and Reloading Spread for more information.Spread's upper limit of 120 participants can cause errors when adding a subcluster to an Eon Mode database. If your database cluster has 120 control nodes, attempting to create a subcluster fails with an error. Every subcluster must have at least one control node. When your cluster has 120 control nodes , Vertica cannot create a control node for the new subcluster. If this error occurs, you must reduce the number of control nodes in your database cluster before adding a subcluster.
When to enable large cluster
Vertica automatically enables large cluster in two cases:
-
The database cluster contains 120 or more nodes. This is true for both Enterprise Mode and Eon Mode.
-
You create an Eon Mode subcluster (either a primary subcluster or a secondary subcluster) with an initial node count of 16 or more.
Vertica does not automatically enable large cluster if you expand an existing subcluster to 16 or more nodes by adding nodes to it.
Note
You can prevent Vertica from automatically enabling large cluster when you create a subcluster with 16 or more nodes by setting the control-set-size parameter to -1. See Creating subclusters for details.
You can choose to manually enable large cluster mode before Vertica automatically enables it. Your best practice is to enable large cluster when your database cluster size reaches a threshold:
-
For cloud-based databases, enable large cluster when the cluster contains 16 or more nodes. In a cloud environment, your database uses point-to-point network communications. Spread scales poorly in point-to-point communications mode. Enabling large cluster when the database cluster reaches 16 nodes helps limit the impact caused by Spread being in point-to-point mode.
-
For on-premises databases, enable large cluster when the cluster reaches 50 to 80 nodes. Spread scales better in an on-premises environment. However, by the time the cluster size reaches 50 to 80 nodes, Spread may begin exhibiting performance issues.
In either cloud or on-premises environments, enable large cluster if you begin to notice Spread-related performance issues. Symptoms of Spread performance issues include:
-
The load on the spread service begins to cause performance issues. Because Vertica uses Spread for cluster-wide control messages, Spread performance issues can adversely affect database performance. This is particularly true for cloud-based databases, where Spread performance problems becomes a bottleneck sooner, due to the nature of network broadcasting in the cloud infrastructure. In on-premises databases, broadcast messages are usually less of a concern because messages usually remain within the local subnet. Even so, eventually, Spread usually becomes a bottleneck before Vertica automatically enables large cluster automatically when the cluster reaches 120 nodes.
-
The compressed list of addresses in your cluster is too large to fit in a maximum transmission unit (MTU) packet (1478 bytes). The MTU packet has to contain all of the addresses for the nodes participating in the Spread service. Under ideal circumstances (when your nodes have the IP addresses 1.1.1.1, 1.1.1.2 and so on) 120 addresses can fit in this packet. This is why Vertica automatically enables large cluster if your database cluster reaches 120 nodes. In practice, the compressed list of IP addresses will reach the MTU packet size limit at 50 to 80 nodes.
1.5.1 - Planning a large cluster
There are two factors you should consider when planning to expand your database cluster to the point that it needs to use large cluster:.
There are two factors you should consider when planning to expand your database cluster to the point that it needs to use large cluster:
-
How many control nodes should your database cluster have?
-
How should those control nodes be distributed?
Determining the number of control nodes
When you manually enable large cluster or add enough nodes to trigger Vertica to enable it automatically, a subset of the cluster nodes become control nodes. In subclusters with fewer than 16 nodes, all nodes are control nodes. In many cases, you can set the number of control nodes to the square root of the total number of nodes in the entire Enterprise Mode cluster, or in Eon Mode subclusters with more than 16 nodes. However, this formula for calculating the number of control is not guaranteed to always meet your requirements.
When choosing the number of control nodes in a database cluster, you must balance two competing considerations:
-
If a control node fails or is shut down, all nodes that depend on it are cut off from the database. They are also down until the control node rejoins the database. You can reduce the impact of a control node failure by increasing the number of control nodes in your cluster.
-
The more control nodes in your cluster, the greater the load on the spread service. In cloud environments, increased complexity of the network environment broadcast can contribute to high latency. This latency can cause messages sent over the spread service to take longer to reach all of the nodes in the cluster.
In a cloud environment, experience has shown that 16 control nodes balances the needs of reliability and performance. In an Eon Mode database, you must have at least one control node per subcluster. Therefore, if you have more than 16 subclusters, you must have more than 16 control nodes.
In an Eon Mode database, whether on-premises or in the cloud, consider adding more control nodes to your primary subclusters than to secondary subclusters. Only nodes in primary subclusters are responsible for maintaining K-safety in an Eon Mode database. Therefore, a control node failure in a primary subcluster can have greater impact on your database than a control node failure in a secondary subcluster.
In an on-premises Enterprise Mode database, consider the physical layout of the hosts running your database when choosing the number of control nodes. If your hosts are spread across multiple server racks, you want to have enough control nodes to distribute them across the racks. Distributing the control nodes helps ensure reliability in the case of a failure that involves the entire rack (such as a power supply or network switch failure). You can configure your database so no node depends on a control node that is in a separate rack. Limiting dependency to within a rack prevents a failure that affects an entire rack from causing additional node loss outside the rack due to control node loss.
Selecting the number of control nodes based on the physical layout also lets you reduce network traffic across switches. By having dependent nodes on the same racks as their control nodes, the communications between them remain in the rack, rather that traversing a network switch.
You might need to increase the number of control nodes to evenly distribute them across your racks. For example, on-premises Enterprise Mode database has 64 total nodes, spread across three racks. The square root of the number of nodes yields 8 control nodes for this cluster. However, you cannot evenly distribute eight control nodes among the three racks. Instead, you can have 9 control nodes and evenly distribute three control nodes per rack.
Influencing control node placement
After you determine the number of nodes for your cluster, you need to determine how to distribute them among the cluster nodes. Vertica chooses which nodes become control nodes. You can influence how Vertica chooses the control nodes and which nodes become their dependents. The exact process you use depends on your database's mode:
-
Enterprise Mode on-premises database: Define fault groups to influence control node placement. Dependent nodes are always in the same fault group as their control node. You usually define fault groups that reflect the physical layout of the hosts running your database. For example, you usually define one or more fault groups for the nodes in a single rack of servers. When the fault groups reflect your physical layout, Vertica places control nodes and dependents in a way that can limit the impact of rack failures. See Fault groups for more information.
-
Eon Mode database: Use subclusters to control the placement of control nodes. Each subcluster must have at least one control node. Dependent nodes are always in the same subcluster as their control nodes. You can set the number of control nodes for each subcluster. Doing so lets you assign more control nodes to primary subclusters, where it's important to minimize the impact of a control node failure.
How Vertica chooses a default number of control nodes
Vertica can automatically choose the number of control nodes in the entire cluster (when in Enterprise Mode) or for a subcluster (when in Eon Mode). It sets a default value in these circumstances:
-
When you pass the
defaultkeyword to the--large-clusteroption of theinstall_verticascript (see Enable Large Cluster When Installing Vertica). -
Vertica automatically enables large cluster when your database cluster grows to 120 or more nodes.
-
Vertica automatically enables large cluster for an Eon Mode subcluster if you create it with more than 16 nodes. Note that Vertica does not enable large cluster on a subcluster you expand past the 16 node limit. It only enables large clusters that start out larger than 16 nodes.
The number of control nodes Vertica chooses depends on what triggered Vertica to set the value.
If you pass the --large-cluster default option to the
install_vertica script, Vertica sets the number of control nodes to the square root of the number of nodes in the initial cluster.
If your database cluster reaches 120 nodes, Vertica enables large cluster by making any newly-added nodes into dependents. The default value for the limit on the number of control nodes is 120. When you reach this limit, any newly-added nodes are added as dependents. For example, suppose you have a 115 node Enterprise Mode database cluster where you have not manually enabled large cluster. If you add 10 nodes to this cluster, Vertica adds 5 of the nodes as control nodes (bringing you up to the 120-node limit) and the other 5 nodes as dependents.
Important
You should manually enable large cluster before your database reaches 120 nodes.In an Eon Mode database, each subcluster has its own setting for the number of control nodes. Vertica only automatically sets the number of control nodes when you create a subcluster with more than 16 nodes initially. When this occurs, Vertica sets the number of control nodes for the subcluster to the square root of the number of nodes in the subcluster.
For example, suppose you add a new subcluster with 25 nodes in it. This subcluster starts with more than the 16 node limit, so Vertica sets the number of control nodes for subcluster to 5 (which is the square root of 25). Five of the nodes are added as control nodes, and the remaining 20 are added as dependents of those five nodes.
Even though each subcluster has its own setting for the number of control nodes, an Eon Mode database cluster still has the 120 node limit on the total number of control nodes that it can have.
1.5.2 - Enabling large cluster
Vertica enables the large cluster feature automatically when:.
Vertica enables the large cluster feature automatically when:
-
The total number of nodes in the database cluster exceeds 120.
-
You create an Eon Mode subcluster with more than 16 nodes.
In most cases, you should consider manually enabling large cluster before your cluster size reaches either of these thresholds. See Planning a large cluster for guidance on when to enable large cluster.
You can enable large cluster on a new Vertica database, or on an existing database.
Enable large cluster when installing Vertica
You can enable large cluster when installing Vertica onto a new database cluster. This option is useful if you know from the beginning that your database will benefit from large cluster.
The install_vertica script's
--large-cluster argument enables large cluster during installation. It takes a single integer value between 1 and 120 that specifies the number of control nodes to create in the new database cluster. Alternatively, this option can take the literal argument default. In this case, Vertica enables large cluster mode and sets the number of control nodes to the square root of the number nodes you provide in the
--hosts argument. For example, if --hosts specifies 25 hosts and --large-cluster is set to default, the install script creates a database cluster with 5 control nodes.
The --large-cluster argument has a slightly different effect depending on the database mode you choose when creating your database:
-
Enterprise Mode:
--large-clustersets the total number of control nodes for the entire database cluster. -
Eon Mode :
--large-clustersets the number of control nodes in the initial default subcluster. This setting has no effect on subclusters that you create later.
Note
You cannot use --large-cluster to set the number of control nodes in your initial database to be higher than the number of you pass in the --hosts argument. The installer sets the number of control nodes to whichever is the lower value: the value you pass to the --large-cluster option or the number of hosts in the --hosts option.
You can set the number of control nodes to be higher than the number of nodes currently in an existing database, with the meta-function SET_CONTROL_SET_SIZE function. You choose to set a higher number to preallocate control nodes when planning for future expansion. For details, see Changing the number of control nodes and realigning.
After the installation process completes, use the Administration tools or the [%=Vertica.MC%] to create a database. See Create an empty database for details.
If your database is on-premises and running in Enterprise Mode, you usually want to define fault groups that reflect the physical layout of your hosts. They let you define which hosts are in the same server racks, and are dependent on the same infrastructure (such power supplies and network switches). With this knowledge, Vertica can realign the control nodes to make your database better able to cope with hardware failures. See Fault groups for more information.
After creating a database, any nodes that you add are, by default, dependent nodes. You can change the number of control nodes in the database with the meta-function SET_CONTROL_SET_SIZE.
Enable large cluster in an existing database
You can manually enable large cluster in an existing database. You usually choose to enable large cluster manually before your database reaches the point where Vertica automatically enables it. See When To Enable Large Cluster for an explanation of when you should consider enabling large cluster.
Use the meta-function SET_CONTROL_SET_SIZE to enable large cluster and set the number of control nodes. You pass this function an integer value that sets the number of control nodes in the entire Enterprise Mode cluster, or in an Eon Mode subcluster.
1.5.3 - Changing the number of control nodes and realigning
You can change the number of control nodes in the entire database cluster in Enterprise Mode, or the number of control nodes in a subcluster in Eon Mode.
You can change the number of control nodes in the entire database cluster in Enterprise Mode, or the number of control nodes in a subcluster in Eon Mode. You may choose to change the number of control nodes in a cluster or subcluster to reduce the impact of control node loss on your database. See Planning a large cluster to learn more about when you should change the number of control nodes in your database.
You change the number of control nodes by calling the meta-function SET_CONTROL_SET_SIZE. If large cluster was not enabled before the call to SET_CONTROL_SET_SIZE, the function enables large cluster in your database. See Enabling large cluster for more information.
When you call SET_CONTROL_SET_SIZE in an Enterprise Mode database, it sets the number of control nodes in the entire database cluster. In an Eon Mode database, you must supply SET_CONTROL_SET_SIZE with the name of a subcluster in addition to the number of control nodes. The function sets the number of control nodes for that subcluster. Other subclusters in the database cluster are unaffected by this call.
Before changing the number of control nodes in an Eon Mode subcluster, verify that the subcluster is running. Changing the number of control nodes of a subcluster while it is down can cause configuration issues that prevent nodes in the subcluster from starting.
Note
You can set the number of control nodes to a value that is higher than the number of nodes currently in the cluster or subcluster. When the number of control nodes is higher than the current node count, newly-added nodes become control nodes until the number of nodes in the cluster or subcluster reaches the number control nodes you set.
You may choose to set the number of control nodes higher than the current node count to plan for future expansion. For example, suppose you have a 4-node subcluster in an Eon Mode database that you plan to expand in the future. You determine that you want limit the number of control nodes in this cluster to 8, even if you expand it beyond that size. In this case, you can choose to set the control node size for the subcluster to 8 now. As you add new nodes to the subcluster, they become control nodes until the size of the subcluster reaches 8. After that point, Vertica assigns newly-added nodes as a dependent of an existing control node in the subcluster.
Realigning control nodes and reloading spread
After you call the SET_CONTROL_SET_SIZE function, there are several additional steps you must take before the new setting takes effect.
Important
Follow these steps if you have upgraded your large-cluster enabled Eon Mode database from a version prior to 10.0.1. Earlier versions of Vertica did not restrict control node assignments to be within the same subcluster. When you realign the control nodes after an upgrade, Vertica configures each subcluster to have at least one control node, and assigns nodes to a control node in their own subcluster.-
Call the REALIGN_CONTROL_NODES function. This function tells Vertica to re-evaluate the assignment of control nodes and their dependents in your cluster or subcluster. When calling this function in an Eon Mode database, you must supply the name of the subcluster where you changed the control node settings.
-
Call the RELOAD_SPREAD function. This function updates the control node assignment information in configuration files and triggers Spread to reload.
-
Restart the nodes affected by the change in control nodes. In an Enterprise Mode database, you must restart the entire database to ensure all nodes have updated configuration information. In Eon Mode, restart the subcluster or subclusters affected by your changes. You must restart the entire Eon Mode database if you changed a critical subcluster (such as the only primary subcluster).
Note
You do not need to restart nodes if the earlier steps didn't change control node assignments. This case usually only happens when you set the number of control nodes in an Eon Mode subcluster to higher than the subcluster's current node count, and all nodes in the subcluster are already control nodes. In this case, no control nodes are added or removed, so node dependencies do not change. Because the dependencies did not change, the nodes do not need to reload the Spread configuration. -
In an Enterprise Mode database, call START_REBALANCE_CLUSTER to rebalance the cluster. This process improves your database's fault tolerance by shifting buddy projection assignments to limit the impact of a control node failure. You do not need to take this step in an Eon Mode database.
Enterprise Mode example
The following example makes 4 out of the 8 nodes in an Enterprise Mode database into control nodes. It queries the LARGE_CLUSTER_CONFIGURATION_STATUS system table which shows control node assignments for each node in the database. At the start, all nodes are their own control nodes. See Monitoring large clusters for more information the system tables associated with large cluster.
=> SELECT * FROM V_CATALOG.LARGE_CLUSTER_CONFIGURATION_STATUS;
    node_name     | spread_host_name | control_node_name
------------------+------------------+-------------------
 v_vmart_node0001 | v_vmart_node0001 | v_vmart_node0001
 v_vmart_node0002 | v_vmart_node0002 | v_vmart_node0002
 v_vmart_node0003 | v_vmart_node0003 | v_vmart_node0003
 v_vmart_node0004 | v_vmart_node0004 | v_vmart_node0004
 v_vmart_node0005 | v_vmart_node0005 | v_vmart_node0005
 v_vmart_node0006 | v_vmart_node0006 | v_vmart_node0006
 v_vmart_node0007 | v_vmart_node0007 | v_vmart_node0007
 v_vmart_node0008 | v_vmart_node0008 | v_vmart_node0008
(8 rows)

=> SELECT SET_CONTROL_SET_SIZE(4);
 SET_CONTROL_SET_SIZE
----------------------
 Control size set
(1 row)

=> SELECT REALIGN_CONTROL_NODES();
                       REALIGN_CONTROL_NODES
---------------------------------------------------------------
 The new control node assignments can be viewed in vs_nodes.
 Check vs_cluster_layout to see the proposed new layout. Reboot
 all the nodes and call rebalance_cluster now

(1 row)

=> SELECT RELOAD_SPREAD(true);
 RELOAD_SPREAD
---------------
 Reloaded
(1 row)

=> SELECT SHUTDOWN();
After restarting the database, the final step is to rebalance the cluster and query the LARGE_CLUSTER_CONFIGURATION_STATUS table to see the current control node assignments:
=> SELECT START_REBALANCE_CLUSTER();
 START_REBALANCE_CLUSTER
-------------------------
 REBALANCING
(1 row)

=> SELECT * FROM V_CATALOG.LARGE_CLUSTER_CONFIGURATION_STATUS;
    node_name     | spread_host_name | control_node_name
------------------+------------------+-------------------
 v_vmart_node0001 | v_vmart_node0001 | v_vmart_node0001
 v_vmart_node0002 | v_vmart_node0002 | v_vmart_node0002
 v_vmart_node0003 | v_vmart_node0003 | v_vmart_node0003
 v_vmart_node0004 | v_vmart_node0004 | v_vmart_node0004
 v_vmart_node0005 | v_vmart_node0001 | v_vmart_node0001
 v_vmart_node0006 | v_vmart_node0002 | v_vmart_node0002
 v_vmart_node0007 | v_vmart_node0003 | v_vmart_node0003
 v_vmart_node0008 | v_vmart_node0004 | v_vmart_node0004
(8 rows)
Eon Mode example
The following example configures 4 control nodes in an 8-node secondary subcluster named analytics. The primary subcluster is not changed. The primary differences between this example and the previous Enterprise Mode example is the need to specify a subcluster when calling SET_CONTROL_SET_SIZE, not having to restart the entire database, and not having to call START_REBALANCE_CLUSTER.
=>  SELECT * FROM V_CATALOG.LARGE_CLUSTER_CONFIGURATION_STATUS;
      node_name       |   spread_host_name   |  control_node_name
----------------------+----------------------+----------------------
 v_verticadb_node0001 | v_verticadb_node0001 | v_verticadb_node0001
 v_verticadb_node0002 | v_verticadb_node0002 | v_verticadb_node0002
 v_verticadb_node0003 | v_verticadb_node0003 | v_verticadb_node0003
 v_verticadb_node0004 | v_verticadb_node0004 | v_verticadb_node0004
 v_verticadb_node0005 | v_verticadb_node0005 | v_verticadb_node0005
 v_verticadb_node0006 | v_verticadb_node0006 | v_verticadb_node0006
 v_verticadb_node0007 | v_verticadb_node0007 | v_verticadb_node0007
 v_verticadb_node0008 | v_verticadb_node0008 | v_verticadb_node0008
 v_verticadb_node0009 | v_verticadb_node0009 | v_verticadb_node0009
 v_verticadb_node0010 | v_verticadb_node0010 | v_verticadb_node0010
 v_verticadb_node0011 | v_verticadb_node0011 | v_verticadb_node0011
(11 rows)


=> SELECT subcluster_name,node_name,is_primary,control_set_size FROM
   V_CATALOG.SUBCLUSTERS;
  subcluster_name   |      node_name       | is_primary | control_set_size
--------------------+----------------------+------------+------------------
 default_subcluster | v_verticadb_node0001 | t          |               -1
 default_subcluster | v_verticadb_node0002 | t          |               -1
 default_subcluster | v_verticadb_node0003 | t          |               -1
 analytics          | v_verticadb_node0004 | f          |               -1
 analytics          | v_verticadb_node0005 | f          |               -1
 analytics          | v_verticadb_node0006 | f          |               -1
 analytics          | v_verticadb_node0007 | f          |               -1
 analytics          | v_verticadb_node0008 | f          |               -1
 analytics          | v_verticadb_node0009 | f          |               -1
 analytics          | v_verticadb_node0010 | f          |               -1
 analytics          | v_verticadb_node0011 | f          |               -1
(11 rows)

=> SELECT SET_CONTROL_SET_SIZE('analytics',4);
 SET_CONTROL_SET_SIZE
----------------------
 Control size set
(1 row)

=> SELECT REALIGN_CONTROL_NODES('analytics');
                      REALIGN_CONTROL_NODES
-----------------------------------------------------------------------------
 The new control node assignments can be viewed in vs_nodes. Call
reload_spread(true). If the subcluster is critical, restart the database.
Otherwise, restart the subcluster

(1 row)

=> SELECT RELOAD_SPREAD(true);
 RELOAD_SPREAD
---------------
 Reloaded
(1 row)
At this point, the analytics subcluster needs to restart. You have several options to restart it. See Starting and stopping subclusters for details. This example uses the admintools command line to stop and start the subcluster.
$ admintools -t stop_subcluster -d verticadb -c analytics -p password
*** Forcing subcluster shutdown ***
Verifying subcluster 'analytics'
    Node 'v_verticadb_node0004' will shutdown
    Node 'v_verticadb_node0005' will shutdown
    Node 'v_verticadb_node0006' will shutdown
    Node 'v_verticadb_node0007' will shutdown
    Node 'v_verticadb_node0008' will shutdown
    Node 'v_verticadb_node0009' will shutdown
    Node 'v_verticadb_node0010' will shutdown
    Node 'v_verticadb_node0011' will shutdown
Shutdown subcluster command successfully sent to the database

$ admintools -t restart_subcluster -d verticadb -c analytics -p password
*** Restarting subcluster for database verticadb ***
    Restarting host [10.11.12.19] with catalog [v_verticadb_node0004_catalog]
    Restarting host [10.11.12.196] with catalog [v_verticadb_node0005_catalog]
    Restarting host [10.11.12.51] with catalog [v_verticadb_node0006_catalog]
    Restarting host [10.11.12.236] with catalog [v_verticadb_node0007_catalog]
    Restarting host [10.11.12.103] with catalog [v_verticadb_node0008_catalog]
    Restarting host [10.11.12.185] with catalog [v_verticadb_node0009_catalog]
    Restarting host [10.11.12.80] with catalog [v_verticadb_node0010_catalog]
    Restarting host [10.11.12.47] with catalog [v_verticadb_node0011_catalog]
    Issuing multi-node restart
    Starting nodes:
        v_verticadb_node0004 (10.11.12.19) [CONTROL]
        v_verticadb_node0005 (10.11.12.196) [CONTROL]
        v_verticadb_node0006 (10.11.12.51) [CONTROL]
        v_verticadb_node0007 (10.11.12.236) [CONTROL]
        v_verticadb_node0008 (10.11.12.103)
        v_verticadb_node0009 (10.11.12.185)
        v_verticadb_node0010 (10.11.12.80)
        v_verticadb_node0011 (10.11.12.47)
    Starting Vertica on all nodes. Please wait, databases with a large catalog may take a while to initialize.
    Node Status: v_verticadb_node0004: (DOWN) v_verticadb_node0005: (DOWN) v_verticadb_node0006: (DOWN)
                     v_verticadb_node0007: (DOWN) v_verticadb_node0008: (DOWN) v_verticadb_node0009: (DOWN)
                     v_verticadb_node0010: (DOWN) v_verticadb_node0011: (DOWN)
    Node Status: v_verticadb_node0004: (DOWN) v_verticadb_node0005: (DOWN) v_verticadb_node0006: (DOWN)
                     v_verticadb_node0007: (DOWN) v_verticadb_node0008: (DOWN) v_verticadb_node0009: (DOWN)
                     v_verticadb_node0010: (DOWN) v_verticadb_node0011: (DOWN)
    Node Status: v_verticadb_node0004: (INITIALIZING) v_verticadb_node0005: (INITIALIZING) v_verticadb_node0006:
                     (INITIALIZING) v_verticadb_node0007: (INITIALIZING) v_verticadb_node0008: (INITIALIZING)
                     v_verticadb_node0009: (INITIALIZING) v_verticadb_node0010: (INITIALIZING) v_verticadb_node0011: (INITIALIZING)
    Node Status: v_verticadb_node0004: (UP) v_verticadb_node0005: (UP) v_verticadb_node0006: (UP)
                     v_verticadb_node0007: (UP) v_verticadb_node0008: (UP) v_verticadb_node0009: (UP)
                     v_verticadb_node0010: (UP) v_verticadb_node0011: (UP)
Syncing catalog on verticadb with 2000 attempts.
Once the subcluster restarts, you can query the system tables to see the control node configuration:
=>  SELECT * FROM V_CATALOG.LARGE_CLUSTER_CONFIGURATION_STATUS;
      node_name       |   spread_host_name   |  control_node_name
----------------------+----------------------+----------------------
 v_verticadb_node0001 | v_verticadb_node0001 | v_verticadb_node0001
 v_verticadb_node0002 | v_verticadb_node0002 | v_verticadb_node0002
 v_verticadb_node0003 | v_verticadb_node0003 | v_verticadb_node0003
 v_verticadb_node0004 | v_verticadb_node0004 | v_verticadb_node0004
 v_verticadb_node0005 | v_verticadb_node0005 | v_verticadb_node0005
 v_verticadb_node0006 | v_verticadb_node0006 | v_verticadb_node0006
 v_verticadb_node0007 | v_verticadb_node0007 | v_verticadb_node0007
 v_verticadb_node0008 | v_verticadb_node0004 | v_verticadb_node0004
 v_verticadb_node0009 | v_verticadb_node0005 | v_verticadb_node0005
 v_verticadb_node0010 | v_verticadb_node0006 | v_verticadb_node0006
 v_verticadb_node0011 | v_verticadb_node0007 | v_verticadb_node0007
(11 rows)

=> SELECT subcluster_name,node_name,is_primary,control_set_size FROM subclusters;
  subcluster_name   |      node_name       | is_primary | control_set_size
--------------------+----------------------+------------+------------------
 default_subcluster | v_verticadb_node0001 | t          |               -1
 default_subcluster | v_verticadb_node0002 | t          |               -1
 default_subcluster | v_verticadb_node0003 | t          |               -1
 analytics          | v_verticadb_node0004 | f          |                4
 analytics          | v_verticadb_node0005 | f          |                4
 analytics          | v_verticadb_node0006 | f          |                4
 analytics          | v_verticadb_node0007 | f          |                4
 analytics          | v_verticadb_node0008 | f          |                4
 analytics          | v_verticadb_node0009 | f          |                4
 analytics          | v_verticadb_node0010 | f          |                4
 analytics          | v_verticadb_node0011 | f          |                4
(11 rows)
Disabling large cluster
To disable large cluster, call SET_CONTROL_SET_SIZE with a value of -1. This value is the default for non-large cluster databases. It tells Vertica to make all nodes into control nodes.
In an Eon Mode database, to fully disable large cluster you must to set the number of control nodes to -1 in every subcluster that has a set number of control nodes. You can see which subclusters have a set number of control nodes by querying the CONTROL_SET_SIZE column of the V_CATALOG.SUBCLUSTERS system table.
The following example resets the number of control nodes set in the previous Eon Mode example.
=> SELECT subcluster_name,node_name,is_primary,control_set_size FROM subclusters;
  subcluster_name   |      node_name       | is_primary | control_set_size
--------------------+----------------------+------------+------------------
 default_subcluster | v_verticadb_node0001 | t          |               -1
 default_subcluster | v_verticadb_node0002 | t          |               -1
 default_subcluster | v_verticadb_node0003 | t          |               -1
 analytics          | v_verticadb_node0004 | f          |                4
 analytics          | v_verticadb_node0005 | f          |                4
 analytics          | v_verticadb_node0006 | f          |                4
 analytics          | v_verticadb_node0007 | f          |                4
 analytics          | v_verticadb_node0008 | f          |                4
 analytics          | v_verticadb_node0009 | f          |                4
 analytics          | v_verticadb_node0010 | f          |                4
 analytics          | v_verticadb_node0011 | f          |                4
(11 rows)


=> SELECT SET_CONTROL_SET_SIZE('analytics',-1);
 SET_CONTROL_SET_SIZE
----------------------
 Control size set
(1 row)

=> SELECT REALIGN_CONTROL_NODES('analytics');
                       REALIGN_CONTROL_NODES
---------------------------------------------------------------------------------------
 The new control node assignments can be viewed in vs_nodes. Call reload_spread(true).
 If the subcluster is critical, restart the database. Otherwise, restart the subcluster

(1 row)

=> SELECT RELOAD_SPREAD(true);
 RELOAD_SPREAD
---------------
 Reloaded
(1 row)

-- After restarting the analytics subcluster...

=> SELECT * FROM V_CATALOG.LARGE_CLUSTER_CONFIGURATION_STATUS;
      node_name       |   spread_host_name   |  control_node_name
----------------------+----------------------+----------------------
 v_verticadb_node0001 | v_verticadb_node0001 | v_verticadb_node0001
 v_verticadb_node0002 | v_verticadb_node0002 | v_verticadb_node0002
 v_verticadb_node0003 | v_verticadb_node0003 | v_verticadb_node0003
 v_verticadb_node0004 | v_verticadb_node0004 | v_verticadb_node0004
 v_verticadb_node0005 | v_verticadb_node0005 | v_verticadb_node0005
 v_verticadb_node0006 | v_verticadb_node0006 | v_verticadb_node0006
 v_verticadb_node0007 | v_verticadb_node0007 | v_verticadb_node0007
 v_verticadb_node0008 | v_verticadb_node0008 | v_verticadb_node0008
 v_verticadb_node0009 | v_verticadb_node0009 | v_verticadb_node0009
 v_verticadb_node0010 | v_verticadb_node0010 | v_verticadb_node0010
 v_verticadb_node0011 | v_verticadb_node0011 | v_verticadb_node0011
(11 rows)

=> SELECT subcluster_name,node_name,is_primary,control_set_size FROM subclusters;
  subcluster_name   |      node_name       | is_primary | control_set_size
--------------------+----------------------+------------+------------------
 default_subcluster | v_verticadb_node0001 | t          |               -1
 default_subcluster | v_verticadb_node0002 | t          |               -1
 default_subcluster | v_verticadb_node0003 | t          |               -1
 analytics          | v_verticadb_node0004 | f          |               -1
 analytics          | v_verticadb_node0005 | f          |               -1
 analytics          | v_verticadb_node0006 | f          |               -1
 analytics          | v_verticadb_node0007 | f          |               -1
 analytics          | v_verticadb_node0008 | f          |               -1
 analytics          | v_verticadb_node0009 | f          |               -1
 analytics          | v_verticadb_node0010 | f          |               -1
 analytics          | v_verticadb_node0011 | f          |               -1
(11 rows)
1.5.4 - Monitoring large clusters
Monitor large cluster traits by querying the following system tables:.
Monitor large cluster traits by querying the following system tables:
-
V_CATALOG.LARGE_CLUSTER_CONFIGURATION_STATUS—Shows the current spread hosts and the control designations in the catalog so you can see if they match.
-
V_MONITOR.CRITICAL_HOSTS—Lists the hosts whose failure would cause the database to become unsafe and force a shutdown.
Tip
The CRITICAL_HOSTS view is especially useful for large cluster arrangements. For non-large clusters, query the CRITICAL_NODES table. -
In an Eon Mode database, the CONTROL_SET_SIZE column of the V_CATALOG.SUBCLUSTERS system table shows the number of control nodes set for each subcluster.
You might also want to query the following system tables:
-
V_CATALOG.FAULT_GROUPS—Shows fault groups and their hierarchy in the cluster.
-
V_CATALOG.CLUSTER_LAYOUT—Shows the relative position of the actual arrangement of the nodes participating in the database cluster and the fault groups that affect them.
1.6 - Multiple databases on a cluster
Vertica allows you to manage your database workloads by running multiple databases on a single cluster.
Vertica allows you to manage your database workloads by running multiple databases on a single cluster. However, databases cannot share the same node while running.
Example
If you have an 8-node cluster, with database 1 running on nodes 1, 2, 3, 4 and database 2 running on nodes 5, 6, 7, 8, you cannot create a new database in this cluster because all nodes are occupied. But if you stop database 1, you can create a database 3 using nodes 1, 2, 3, 4. Or if you stop both databases 1 and 2, you can create a database 3 using nodes 3, 4, 5, 6. In this latter case, database 1 and database 2 cannot be restarted unless you stop database 3, as they occupy the same nodes.
1.7 - Fault groups
You cannot create fault groups for an Eon Mode database.
Note
You cannot create fault groups for an Eon Mode database. Rather, Vertica automatically creates fault groups on a large cluster Eon database; these fault groups are configured around the control nodes and their dependents of each subcluster. These fault groups are managed internally by Vertica and are not accessible to users.Fault groups let you configure an Enterprise Mode database for your physical cluster layout. Sharing your cluster topology lets you use terrace routing to reduce the buffer requirements of large queries. It also helps to minimize the risk of correlated failures inherent in your environment, usually caused by shared resources.
Vertica automatically creates fault groups around control nodes (servers that run spread) in large cluster arrangements, placing nodes that share a control node in the same fault group. Automatic and user-defined fault groups do not include ephemeral nodes because such nodes hold no data.
Consider defining your own fault groups specific to your cluster's physical layout if you want to:
-
Use terrace routing to reduce the buffer requirements of large queries.
-
Reduce the risk of correlated failures. For example, by defining your rack layout, Vertica can better tolerate a rack failure.
-
Influence the placement of control nodes in the cluster.
Vertica supports complex, hierarchical fault groups of different shapes and sizes. The database platform provides a fault group script (DDL generator), SQL statements, system tables, and other monitoring tools.
See High availability with fault groups for an overview of fault groups with a cluster topology example.
1.7.1 - About the fault group script
To help you define fault groups on your cluster, Vertica provides a script named fault_group_ddl_generator.py in the /opt//scripts directory.
To help you define fault groups on your cluster, Vertica provides a script named fault_group_ddl_generator.py in the
/opt/vertica/scripts directory. This script generates the SQL statements you need to run to create fault groups.
The fault_group_ddl_generator.py script does not create fault groups for you, but you can copy the output to a file. Then, when you run the helper script, you can use \i or vsql–f commands to pass the cluster topology to Vertica.
The fault group script takes the following arguments:
-
The database name
-
The fault group input file
For example:
$ python /opt/vertica/scripts/fault_group_ddl_generator.py VMartdb fault_grp_input.out
See also
1.7.2 - Creating a fault group input file
Use a text editor to create a fault group input file for the targeted cluster.
Use a text editor to create a fault group input file for the targeted cluster.
The following example shows how you can create a fault group input file for a cluster that has 8 racks with 8 nodes on each rack—for a total of 64 nodes in the cluster.
-
On the first line of the file, list the parent (top-level) fault groups, delimited by spaces.
rack1 rack2 rack3 rack4 rack5 rack6 rack7 rack8 -
On the subsequent lines, list the parent fault group followed by an equals sign (=). After the equals sign, list the nodes or fault groups delimited by spaces.
<parent> = <child_1> <child_2> <child_n...>Such as:
rack1 = v_vmart_node0001 v_vmart_node0002 v_vmart_node0003 v_vmart_node0004
rack2 = v_vmart_node0005 v_vmart_node0006 v_vmart_node0007 v_vmart_node0008
rack3 = v_vmart_node0009 v_vmart_node0010 v_vmart_node0011 v_vmart_node0012
rack4 = v_vmart_node0013 v_vmart_node0014 v_vmart_node0015 v_vmart_node0016
rack5 = v_vmart_node0017 v_vmart_node0018 v_vmart_node0019 v_vmart_node0020
rack6 = v_vmart_node0021 v_vmart_node0022 v_vmart_node0023 v_vmart_node0024
rack7 = v_vmart_node0025 v_vmart_node0026 v_vmart_node0027 v_vmart_node0028
rack8 = v_vmart_node0029 v_vmart_node0030 v_vmart_node0031 v_vmart_node0032
After the first row of parent fault groups, the order in which you write the group descriptions does not matter. All fault groups that you define in this file must refer back to a parent fault group. You can indicate the parent group directly or by specifying the child of a fault group that is the child of a parent fault group.
Such as:
rack1 rack2 rack3 rack4 rack5 rack6 rack7 rack8
rack1 = v_vmart_node0001 v_vmart_node0002 v_vmart_node0003 v_vmart_node0004
rack2 = v_vmart_node0005 v_vmart_node0006 v_vmart_node0007 v_vmart_node0008
rack3 = v_vmart_node0009 v_vmart_node0010 v_vmart_node0011 v_vmart_node0012
rack4 = v_vmart_node0013 v_vmart_node0014 v_vmart_node0015 v_vmart_node0016
rack5 = v_vmart_node0017 v_vmart_node0018 v_vmart_node0019 v_vmart_node0020
rack6 = v_vmart_node0021 v_vmart_node0022 v_vmart_node0023 v_vmart_node0024
rack7 = v_vmart_node0025 v_vmart_node0026 v_vmart_node0027 v_vmart_node0028
rack8 = v_vmart_node0029 v_vmart_node0030 v_vmart_node0031 v_vmart_node0032
After you create your fault group input file, you are ready to run the fault_group_ddl_generator.py. This script generates the DDL statements you need to create fault groups in Vertica.
If your Vertica database is co-located on a Hadoop cluster, and that cluster uses more than one rack, you can use fault groups to improve performance. See Configuring rack locality.
See also
Creating fault groups1.7.3 - Creating fault groups
When you define fault groups, Vertica distributes data segments across the cluster.
When you define fault groups, Vertica distributes data segments across the cluster. This allows the cluster to be aware of your cluster topology so it can tolerate correlated failures inherent in your environment, such as a rack failure. For an overview, see High Availability With Fault Groups.
Important
Defining fault groups requires careful and thorough network planning, and a solid understanding of your network topology.Prerequisites
To define a fault group, you must have:
-
Superuser privileges
-
An existing database
Run the fault group script
-
As the database administrator, run the
fault_group_ddl_generator.pyscript:python /opt/vertica/scripts/fault_group_ddl_generator.py databasename fault-group-inputfile > sql-filenameFor example, the following command writes the Python script output to the SQL file
fault_group_ddl.sql.$ python /opt/vertica/scripts/fault_group_ddl_generator.py VMart fault_groups_VMart.out > fault_group_ddl.sqlAfter the script returns, you can run the SQL file, instead of multiple DDL statements individually.
Tip
Consider saving the input file so you can modify fault groups later—for example, after expanding the cluster or changing the distribution of control nodes. -
Using vsql, run the DDL statements in
fault_group_ddl.sqlor execute the commands in the file using vsql.=> \i fault_group_ddl.sql -
If large cluster is enabled, realign control nodes with REALIGN_CONTROL_NODES. Otherwise, skip this step.
=> SELECT REALIGN_CONTROL_NODES(); -
Save cluster changes to the Spread configuration file by calling RELOAD_SPREAD:
=> SELECT RELOAD_SPREAD(true); -
Use Administration tools to restart the database.
-
Save changes to the cluster's data layout by calling REBALANCE_CLUSTER:
=> SELECT REBALANCE_CLUSTER();
See also
1.7.4 - Monitoring fault groups
You can monitor fault groups by querying Vertica system tables or by logging in to the Management Console (MC) interface.
You can monitor fault groups by querying Vertica system tables or by logging in to the Management Console (MC) interface.
Monitor fault groups using system tables
Use the following system tables to view information about fault groups and cluster vulnerabilities, such as the nodes the cluster cannot lose without the database going down:
-
V_CATALOG.FAULT_GROUPS: View the hierarchy of all fault groups in the cluster.
-
V_CATALOG.CLUSTER_LAYOUT: Observe the arrangement of the nodes participating in the data business and the fault groups that affect them. Ephemeral nodes do not appear in the cluster layout ring because they hold no data.
Monitoring fault groups using Management Console
An MC administrator can monitor and highlight fault groups of interest by following these steps:
-
Click the running database you want to monitor and click Manage in the task bar.
-
Open the Fault Group View menu, and select the fault groups you want to view.
-
(Optional) Hide nodes that are not in the selected fault group to focus on fault groups of interest.
Nodes assigned to a fault group each have a colored bubble attached to the upper-left corner of the node icon. Each fault group has a unique color.If the number of fault groups exceeds the number of colors available, MC recycles the colors used previously.
Because Vertica supports complex, hierarchical fault groups of different shapes and sizes, MC displays multiple fault group participation as a stack of different-colored bubbles. The higher bubbles represent a lower-tiered fault group, which means that bubble is closer to the parent fault group, not the child or grandchild fault group.
For more information about fault group hierarchy, see High Availability With Fault Groups.
1.7.5 - Dropping fault groups
When you remove a fault group from the cluster, be aware that the drop operation removes the specified fault group and its child fault groups.
When you remove a fault group from the cluster, be aware that the drop operation removes the specified fault group and its child fault groups. Vertica places all nodes under the parent of the dropped fault group. To see the current fault group hierarchy in the cluster, query system table
FAULT_GROUPS.
Drop a fault group
Use the DROP FAULT GROUP statement to remove a fault group from the cluster. The following example shows how you can drops the group2 fault group:
=> DROP FAULT GROUP group2;
DROP FAULT GROUP
Drop all fault groups
Use the ALTER DATABASE statement to drop all fault groups, along with any child fault groups, from the specified database cluster.
The following command drops all fault groups from the current database.
=> ALTER DATABASE DEFAULT DROP ALL FAULT GROUP;
ALTER DATABASE
Add nodes back to a fault group
To add a node back to a fault group, you must manually reassign it to a new or existing fault group. To do so, use the CREATE FAULT GROUP and ALTER FAULT GROUP..ADD NODE statements.
See also
1.8 - Terrace routing
Before you apply terrace routing to your database, be sure you are familiar with large cluster and fault groups.
Important
Before you apply terrace routing to your database, be sure you are familiar with large cluster and fault groups.Terrace routing can significantly reduce message buffering on a large cluster database. The following sections describe how Vertica implements terrace routing on Enterprise Mode and Eon Mode databases.
Terrace routing on Enterprise Mode
Terrace routing on an Enterprise Mode database is implemented through fault groups that define a rack-based topology. In a large cluster with terrace routing disabled, nodes in a Vertica cluster form a fully connected network, where each non-dependent (control) node sends messages across the database cluster through connections with all other non-dependent nodes, both within and outside its own rack/fault group:
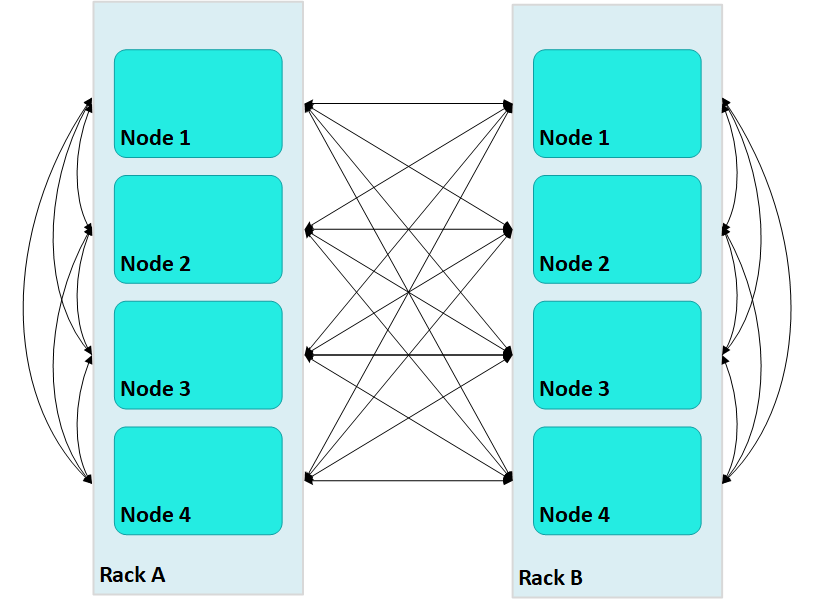
In this case, large Vertica clusters can require many connections on each node, where each connection incurs its own network buffering requirements. The total number of buffers required for each node is calculated as follows:
(numRacks * numRackNodes) - 1
In a two-rack cluster with 4 nodes per rack as shown above, this resolves to 7 buffers for each node.
With terrace routing enabled, you can considerably reduce large cluster network buffering. Each nth node in a rack/fault group is paired with the corresponding nth node of all other fault groups. For example, with terrace routing enabled, messaging in the same two-rack cluster is now implemented as follows:
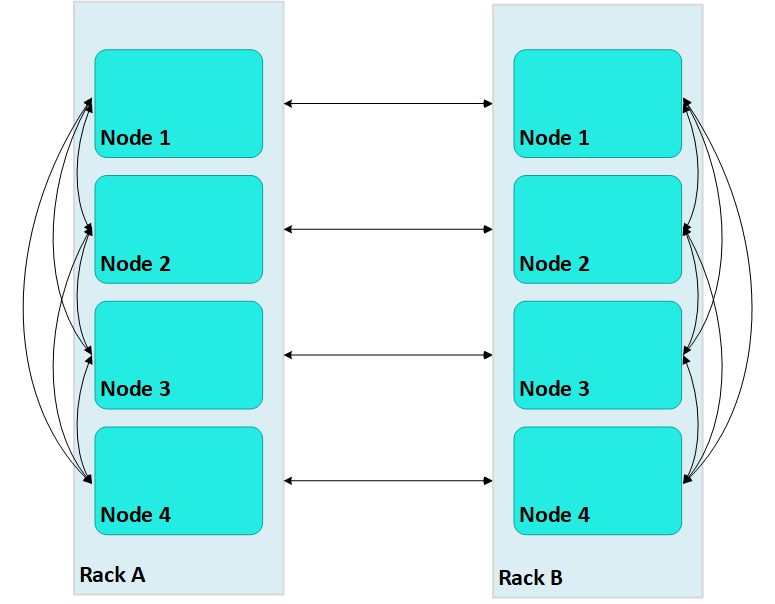
Thus, a message that originates from node 2 on rack A (A2) is sent to all other nodes on rack A; each rack A node then conveys the message to its corresponding node on rack B—A1 to B1, A2 to B2, and so on.
With terrace routing enabled, each node of a given rack avoids the overhead of maintaining message buffers to all other nodes. Instead, each node is only responsible for maintaining connections to:
-
All other nodes of the same rack (
numRackNodes- 1) -
One node on each of the other racks (
numRacks- 1)
Thus, the total number of message buffers required for each node is calculated as follows:
(numRackNodes-1) + (numRacks-1)
In a two-rack cluster with 4 nodes as shown earlier, this resolves to 4 buffers for each node.
Terrace routing trades time (intra-rack hops) for space (network message buffers). As a cluster expands with additional racks and nodes, the argument favoring this trade off becomes increasingly persuasive:
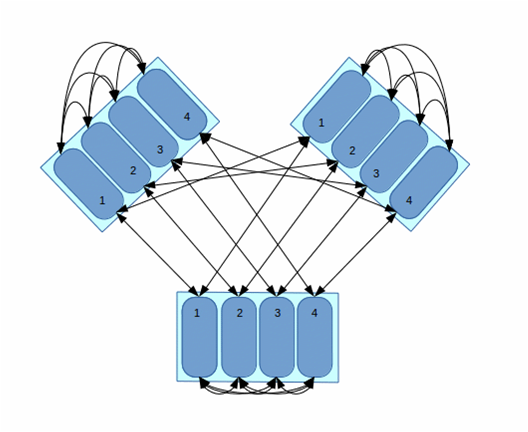
In this three-rack cluster with 4 nodes per rack, without terrace routing the number of buffers required by each node would be 11. With terrace routing, the number of buffers per node is 5. As a cluster expands with the addition of racks and nodes per rack, the disparity between buffer requirements widens. For example, given a six-rack cluster with 16 nodes per rack, without terrace routing the number of buffers required per node is 95; with terrace routing, 20.
Enabling terrace routing
Terrace routing depends on fault group definitions that describe a cluster network topology organized around racks and their member nodes. As noted earlier, when terrace routing is enabled, Vertica first distributes data within the rack/fault group; it then uses nth node-to-nth node mappings to forward this data to all other racks in the database cluster.
You enable (or disable) terrace routing for any Enterprise Mode large cluster that implements rack-based fault groups through configuration parameter TerraceRoutingFactor. To enable terrace routing, set this parameter as follows:
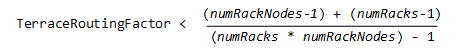
where:
-
numRackNodes: Number of nodes in a rack -
numRacks: Number of racks in the cluster
For example:
| #Racks | Nodes/rack | #Connections |
Terrace routing enabled if TerraceRoutingFactor less than: | |
|---|---|---|---|---|
| Without terrace routing | With terrace routing | |||
| 2 | 16 | 31 | 16 | 1.94 |
| 4 | 16 | 63 | 18 | 3.5 |
| 6 | 16 | 95 | 20 | 4.75 |
| 8 | 16 | 127 | 22 | 5.77 |
By default, TerraceRoutingFactor is set to 2, which generally ensures that terrace routing is enabled for any Enterprise Mode large cluster that implements rack-based fault groups. Vertica recommends enabling terrace routing for any cluster that contains 64 or more nodes, or if queries often require excessive buffer space.
To disable terrace routing, set TerraceRoutingFactor to a large integer such as 1000:
=> ALTER DATABASE DEFAULT SET TerraceRoutingFactor = 1000;
Terrace routing on Eon Mode
As in Enterprise Mode mode, terrace routing is enabled by default on an Eon Mode database, and is implemented through fault groups. However, you do not create fault groups for an Eon Mode database. Rather, Vertica automatically creates fault groups on a large cluster database; these fault groups are configured around the control nodes and their dependents of each subcluster. These fault groups are managed internally by Vertica and are not accessible to users.
1.9 - Elastic cluster
Elastic Cluster is an Enterprise Mode-only feature.
Note
Elastic Cluster is an Enterprise Mode-only feature. For scaling your database under Eon Mode, see Scaling your Eon Mode database.You can scale your cluster up or down to meet the needs of your database. The most common case is to add nodes to your database cluster to accommodate more data and provide better query performance. However, you can scale down your cluster if you find that it is over-provisioned, or if you need to divert hardware for other uses.
You scale your cluster by adding or removing nodes. Nodes can be added or removed without shutting down or restarting the database. After adding a node or before removing a node, Vertica begins a rebalancing process that moves data around the cluster to populate the new nodes or move data off nodes about to be removed from the database. During this process, nodes can exchange data that are not being added or removed to maintain robust intelligent K-safety. If Vertica determines that the data cannot be rebalanced in a single iteration due to lack of disk space, then the rebalance operation spans multiple iterations.
To help make data rebalancing due to cluster scaling more efficient, Vertica locally segments data storage on each node so it can be easily moved to other nodes in the cluster. When a new node is added to the cluster, existing nodes in the cluster give up some of their data segments to populate the new node. They also exchange segments to minimize the number of nodes that any one node depends upon. This strategy minimizes the number of nodes that might become critical when a node fails. When a node is removed from the cluster, its storage containers are moved to other nodes in the cluster (which also relocates data segments to minimize how many nodes might become critical when a node fails). This method of breaking data into portable segments is referred to as elastic cluster, as it facilitates enlarging or shrinking the cluster.
The alternative to elastic cluster is re-segmenting all projection data and redistributing it evenly among all database nodes any time a node is added or removed. This method requires more processing and more disk space, as it requires all data in all projections to be dumped and reloaded.
Elastic cluster scaling factor
In a new installation, each node has a scaling factor that specifies the number of local segments (see Scaling factor). Rebalance efficiently redistributes data by relocating local segments provided that, after nodes are added or removed, there are sufficient local segments in the cluster to redistribute the data evenly (determined by MAXIMUM_SKEW_PERCENT). For example, if the scaling factor = 8, and there are initially 5 nodes, then there are a total of 40 local segments cluster-wide.
If you add two additional nodes (seven nodes) Vertica relocates five local segments on two nodes, and six such segments on five nodes, resulting in roughly a 16.7 percent skew. Rebalance relocates local segments only if the resulting skew is less than the allowed threshold, as determined by MAXIMUM_SKEW_PERCENT. Otherwise, segmentation space (and hence data, if uniformly distributed over this space) is evenly distributed among the seven nodes, and new local segment boundaries are drawn for each node, such that each node again has eight local segments.
Note
By default, the scaling factor only has an effect while Vertica rebalances the database. While rebalancing, each node breaks the projection segments it contains into storage containers, which it then moves to other nodes if necessary. After rebalancing, the data is recombined into ROS containers. It is possible to have Vertica always group data into storage containers. See Local data segmentation for more information.Enabling elastic cluster
You enable elastic cluster with ENABLE_ELASTIC_CLUSTER. Query the ELASTIC_CLUSTER system table to verify that elastic cluster is enabled:
=> SELECT is_enabled FROM ELASTIC_CLUSTER;
 is_enabled
------------
 t
(1 row)
1.9.1 - Scaling factor
To avoid an increased number of ROS containers, do not enable local segmentation and do not change the scaling factor.
To avoid an increased number of ROS containers, do not enable local segmentation and do not change the scaling factor.
1.9.2 - Viewing scaling factor settings
To view the scaling factor, query the ELASTIC_CLUSTER table:.
To view the scaling factor, query the ELASTIC_CLUSTER table:
=> SELECT scaling_factor FROM ELASTIC_CLUSTER;
scaling_factor
---------------
            4
(1 row)

=> SELECT SET_SCALING_FACTOR(6);
 SET_SCALING_FACTOR
--------------------
 SET
(1 row)

=> SELECT scaling_factor FROM ELASTIC_CLUSTER;
 scaling_factor
---------------
             6
(1 row)
1.9.3 - Setting the scaling factor
Use the SET_SCALING_FACTOR function to change your database's scaling factor.
The scaling factor determines the number of storage containers that Vertica uses to store each projection across the database during rebalancing when local segmentation is enabled. When setting the scaling factor, follow these guidelines:
-
The number of storage containers should be greater than or equal to the number of partitions multiplied by the number of local segments:
num-storage-containers>= (num-partitions*num-local-segments) -
Set the scaling factor high enough so rebalance can transfer local segments to satisfy the skew threshold, but small enough so the number of storage containers does not result in too many ROS containers, and cause ROS pushback. The maximum number of ROS containers (by default 1024) is set by configuration parameter ContainersPerProjectionLimit.
Use the SET_SCALING_FACTOR function to change your database's scaling factor. The scaling factor can be an integer between 1 and 32.
=> SELECT SET_SCALING_FACTOR(12);
SET_SCALING_FACTOR
--------------------
 SET
(1 row)
1.9.4 - Local data segmentation
By default, the scaling factor only has an effect when Vertica rebalances the database.
By default, the scaling factor only has an effect when Vertica rebalances the database. During rebalancing, nodes break the projection segments they contain into storage containers which they can quickly move to other nodes.
This process is more efficient than re-segmenting the entire projection (in particular, less free disk space is required), but it still has significant overhead, since storage containers have to be separated into local segments, some of which are then transferred to other nodes. This overhead is not a problem if you rarely add or remove nodes from your database.
However, if your database is growing rapidly and is constantly busy, you may find the process of adding nodes becomes disruptive. In this case, you can enable local segmentation, which tells Vertica to always segment its data based on the scaling factor, so the data is always broken into containers that are easily moved. Having the data segmented in this way dramatically speeds up the process of adding or removing nodes, since the data is always in a state that can be quickly relocated to another node. The rebalancing process that Vertica performs after adding or removing a node just has to decide which storage containers to relocate, instead of first having to first break the data into storage containers.
Local data segmentation increases the number of storage containers stored on each node. This is not an issue unless a table contains many partitions. For example, if the table is partitioned by day and contains one or more years. If local data segmentation is enabled, then each of these table partitions is broken into multiple local storage segments, which potentially results in a huge number of files which can lead to ROS "pushback." Consider your table partitions and the effect enabling local data segmentation may have before enabling the feature.
1.9.4.1 - Enabling and disabling local segmentation
To enable local segmentation, use the ENABLE_LOCAL_SEGMENTS function.
To enable local segmentation, use the ENABLE_LOCAL_SEGMENTS function. To disable local segmentation, use the DISABLE_LOCAL_SEGMENTATION function:
=> SELECT ENABLE_LOCAL_SEGMENTS();
ENABLE_LOCAL_SEGMENTS
-----------------------
 ENABLED
(1 row)


=> SELECT is_local_segment_enabled FROM elastic_cluster;
 is_enabled
------------
 t
(1 row)

=> SELECT DISABLE_LOCAL_SEGMENTS();
 DISABLE_LOCAL_SEGMENTS
------------------------
 DISABLED
(1 row)

=> SELECT is_local_segment_enabled FROM ELASTIC_CLUSTER;
 is_enabled
------------
 f
(1 row)
1.9.5 - Elastic cluster best practices
The following are some best practices with regard to local segmentation.
The following are some best practices with regard to local segmentation.
Note
You should always perform a database backup before and after performing any of the operations discussed in this topic. You need to back up before changing any elastic cluster or local segmentation settings to guard against a hardware failure causing the rebalance process to leave the database in an unusable state. You should perform a full backup of the database after the rebalance procedure to avoid having to rebalance the database again if you need to restore from a backup.When to enable local data segmentation
Local data segmentation can significantly speed up the process of resizing your cluster. You should enable local data segmentation if:
-
your database does not contain tables with hundreds of partitions.
-
the number of nodes in the database cluster is a power of two.
-
you plan to expand or contract the size of your cluster.
Local segmentation can result in an excessive number of storage containers with tables that have hundreds of partitions, or in clusters with a non-power-of-two number of nodes. If your database has these two features, take care when enabling local segmentation.
1.10 - Adding nodes
There are many reasons for adding one or more nodes to an installation of Vertica:.
There are many reasons for adding one or more nodes to an installation of Vertica:
- Increase system performance. Add additional nodes due to a high query load or load latency or increase disk space without adding storage locations to existing nodes.
Note
The database response time depends on factors such as type and size of the application query, database design, data size and data types stored, available computational power, and network bandwidth. Adding nodes to a database cluster does not necessarily improve the system response time for every query, especially if the response time is already short, e.g., less then 10 seconds, or the response time is not hardware bound.-
Make the database K-safe (K-safety=1) or increase K-safety to 2. See Failure recovery for details.
-
Swap a node for maintenance. Use a spare machine to temporarily take over the activities of an existing node that needs maintenance. The node that requires maintenance is known ahead of time so that when it is temporarily removed from service, the cluster is not vulnerable to additional node failures.
-
Replace a node. Permanently add a node to remove obsolete or malfunctioning hardware.
Important
If you install Vertica on a single node without specifying the IP address or host name (or you usedlocalhost), you cannot expand the cluster. You must reinstall Vertica and specify an IP address or host name that is not localhost/127.0.0.1.
Adding nodes consists of the following general tasks:
-
Vertica strongly recommends that you back up the database before you perform this significant operation because it entails creating new projections, refreshing them, and then deleting the old projections. See Backing up and restoring the database for more information.
The process of migrating the projection design to include the additional nodes could take a while; however during this time, all user activity on the database can proceed normally, using the old projections.
-
Configure the hosts you want to add to the cluster.
See Before you Install Vertica. You will also need to edit the hosts configuration file on all of the existing nodes in the cluster to ensure they can resolve the new host.
-
Add the hosts you added to the cluster (in step 3) to the database.
Note
When you add a "host" to the database, it becomes a "node." You can add nodes to your database using either the Administration tools or the Management Console (See Monitoring with MC).
You can also add nodes using the
admintoolscommand line, which allows you to preserve the specific order of the nodes you add.
After you add nodes to the database, Vertica automatically distributes updated configuration files to the rest of the nodes in the cluster and starts the process of rebalancing data in the cluster. See Rebalancing data across nodes for details.
1.10.1 - Adding hosts to a cluster
After you have backed up the database and configured the hosts you want to add to the cluster, you can now add hosts to the cluster using the script.
After you have backed up the database and configured the hosts you want to add to the cluster, you can now add hosts to the cluster using the
update_vertica script.
You cannot use the MC to add hosts to a cluster in an on-premises environment. However, after the hosts are added to the cluster, the MC does allow you to add the hosts to a database as nodes.
Prerequisites and restrictions
If you installed Vertica on a single node without specifying the IP address or hostname (you used localhost), it is not possible to expand the cluster. You must reinstall Vertica and specify an IP address or hostname.
Procedure to add hosts
From one of the existing cluster hosts, run the update_vertica script with a minimum of the --add-hosts host(s) parameter (where host(s) is the hostname or IP address of the system(s) that you are adding to the cluster) and the --rpm or --deb parameter:
# /opt/vertica/sbin/update_vertica --add-hosts host(s) --rpm package
Note
See Install Vertica with the installation script for the full list of parameters. You must also provide the same options you used when originally installing the cluster.The
update_vertica ** script uses all the same options as
install_vertica and:
-
Installs the Vertica RPM on the new host.
-
Performs post-installation checks, including RPM version and N-way network connectivity checks.
-
Modifies spread to encompass the larger cluster.
-
Configures the Administration Tools to work with the larger cluster.
Important Tips:
-
Consider using
--large-clusterwith more than 50 nodes. -
A host can be specified by the hostname or IP address of the system you are adding to the cluster. However, internally Vertica stores all host addresses as IP addresses.
-
Do not use include spaces in the hostname/IP address list provided with
--add-hostsif you specified more than one host. -
If a package is specified with
--rpm/--deb, and that package is newer than the one currently installed on the existing cluster, then, Vertica first installs the new package on the existing cluster hosts before the newly-added hosts. -
Use the same command line parameters for the database administrator username, password, and directory path you used when you installed the cluster originally. Alternatively, you can create a properties file to save the parameters during install and then re-using it on subsequent install and update operations. See Installing Vertica Silently.
-
If you are installing using sudo, the database administrator user (dbadmin) must already exist on the hosts you are adding and must be configured with passwords and home directory paths identical to the existing hosts. Vertica sets up passwordless ssh from existing hosts to the new hosts, if needed.
-
If you initially used the
--point-to-pointoption to configure spread to use direct, point-to-point communication between nodes on the subnet, then use the--point-to-pointoption whenever you runinstall_verticaorupdate_vertica. Otherwise, your cluster's configuration is reverted to the default (broadcast), which may impact future databases. -
The maximum number of spread daemons supported in point-to-point communication and broadcast traffic is 80. It is possible to have more than 80 nodes by using large cluster mode, which does not install a spread daemon on each node.
Examples
--add-hosts host01 --rpm
--add-hosts 192.168.233.101
--add-hosts host02,host03
1.10.2 - Adding nodes to a database
After you add one or more hosts to the cluster, you can add them as nodes to the database with one of the following:.
After you add one or more hosts to the cluster, you can add them as nodes to the database with one of the following:
-
admintoolscommand line, to ensure nodes are added in a specific order -
Administration Tools
-
Management Console
Command line
With the admintools db_add_node tool, you can control the order in which nodes are added to the database cluster. It specifies the hosts of new nodes with its -s or --hosts option, which takes a comma-delimited argument list. Vertica adds new nodes in the list-specified order. For example, the following command adds three nodes:
$ admintools -t db_add_node \
      -d VMart \
      -p 'password' \
      -s 192.0.2.1,192.0.2.2,192.0.2.3
Tip
When adding nodes to an Eon Mode database, you can also specify the subcluster that the new nodes should belong to. See Adding and removing nodes from subclusters for more information.Administration tools
You add nodes to a database with the Administration Tools as follows:
-
Open the Administration Tools.
-
On the Main Menu, select View Database Cluster State to verify that the database is running. If it is not, start it.
-
From the Main Menu, select Advanced Menu and click OK.
-
In the Advanced Menu, select Cluster Management and click OK.
-
In the Cluster Management menu, select Add Host(s) and click OK.
-
Select the database to which you want to add one or more hosts, and then select OK.
A list of unused hosts is displayed.
-
Select the hosts you want to add to the database and click OK.
-
When prompted, click Yes to confirm that you want to add the hosts.
-
When prompted, enter the password for the database, and then select OK.
-
When prompted that the hosts were successfully added, select OK.
-
Vertica now automatically starts the rebalancing process to populate the new node with data. When prompted, enter the path to a temporary directory that the Database Designer can use to rebalance the data in the database and select OK.
-
Either press Enter to accept the default K-safety value, or enter a new higher value for the database and select OK.
-
Select whether to rebalance the database immediately, or later. In both cases, Vertica creates a script, which you can use to rebalance at any time.
Review the summary of the rebalancing process and select Proceed.
If you choose to automatically rebalance, the rebalance process runs. If you chose to create a script, the script is generated and saved. In either case, you are shown a success screen.
-
Select OK to complete the Add Node process.
Management Console
To add nodes to an Eon Mode database using MC, see Add nodes to a cluster in AWS using Management Console.
To add hosts to an Enterprise Mode database using MC, see Adding hosts to a cluster
1.10.3 - Add nodes to a cluster in AWS
This section gives an overview on how to add nodes if you are managing your cluster using admintools.
This section gives an overview on how to add nodes if you are managing your cluster using admintools. Each main step points to another topic with the complete instructions.
Step 1: before you start
Before you add nodes to a cluster, verify that you have an AWS cluster up and running and that you have:
-
Created a database.
-
Defined a database schema.
-
Loaded data.
-
Run the Database Designer.
-
Connected to your database.
Step 2: launch new instances to add to an existing cluster
Perform the procedure in Configure and launch an instance to create new instances (hosts) that you then will add to your existing cluster. Be sure to choose the same details you chose when you created the original instances (VPC, placement group, subnet, and security group).
Step 3: include new instances as cluster nodes
You need the IP addresses when you run the install_vertica script to include new instances as cluster nodes.
If you are configuring Amazon Elastic Block Store (EBS) volumes, be sure to configure the volumes on the node before you add the node to your cluster.
To add the new instances as nodes to your existing cluster:
-
Connect to the instance that is assigned to the Elastic IP. See Connect to an instance if you need more information.
-
Run the Vertica installation script to add the new instances as nodes to your cluster. Specify the internal IP addresses for your instances and your
*.pemfile name.$ sudo /opt/vertica/sbin/install_vertica --add-hosts instance-ip --dba-user-password-disabled \ --point-to-point --data-dir /vertica/data --ssh-identity ~/name-of-pem.pem
Step 4: add the nodes
After you have added the new instances to your existing cluster, add them as nodes to your cluster, as described in Adding nodes to a database.
Step 5: rebalance the database
After you add nodes to a database, always rebalance the database.
1.11 - Removing nodes
Although less common than adding a node, permanently removing a node is useful if the host system is obsolete or over-provisioned.
Although less common than adding a node, permanently removing a node is useful if the host system is obsolete or over-provisioned.
Important
Before removing a node from a cluster, check that the cluster has the minimum number of nodes required to comply with K-safety. If necessary, temporarily lower the database K-safety level.1.11.1 - Automatic eviction of unhealthy nodes
To manage the health of the nodes in your cluster, Vertica performs regular health checks by sending and receiving "heartbeats." During a health check, each node in the cluster verifies read-write access to its catalog, catalog disk, and local storage locations ('TEMP, DATA', TEMP, DATA, and DEPOT).
To manage the health of the nodes in your cluster, Vertica performs regular health checks by sending and receiving "heartbeats." During a health check, each node in the cluster verifies read-write access to its catalog, catalog disk, and local storage locations ('TEMP, DATA', TEMP, DATA, and DEPOT). Upon verification, the node sends a heartbeat. If a node fails to send a heartbeat after five intervals (fails five health checks), then the node is evicted from the cluster.
You can control the time between each health check with the DatabaseHeartBeatInterval parameter. By default, DatabaseHeartBeatInterval is set to 120, which allows five 120-second intervals to pass without a heartbeat.
The amount of time allowed before an eviction is:
TOT = DHBI * 5
where TOT is the total time (in seconds) allowed without a heartbeat before eviction, and DHBI is equal to the value of DatabaseHeartBeatInterval.
If you set the DatabaseHeartBeatInterval too low, it can cause evictions in cases of brief node health issues. Sometimes, such premature evictions result in lower availability and performance of the Vertica database.
See also
DatabaseHeartbeatInterval in General parameters
1.11.2 - Lowering K-Safety to enable node removal
A database with a K-safety level of 1 requires at least three nodes to operate, and a database with a K-safety level 2 requires at least 5 nodes to operate.
A database with a K-safety level of 1 requires at least three nodes to operate, and a database with a K-safety level 2 requires at least 5 nodes to operate. You can check the cluster's current K-safety level as follows:
=> SELECT current_fault_tolerance FROM system;
 current_fault_tolerance
-------------------------
                       1
(1 row)
To remove a node from a cluster with the minimum number of nodes that it requires for K-safety, first lower the K-safety level with
MARK_DESIGN_KSAFE.
Caution
Lowering the K-safety level of a database to 0 eliminates Vertica's fault tolerance features. If you must reduce K-safety to 0, first back up the database.-
Connect to the database with Administration Tools or vsql.
-
Call the function
MARK_DESIGN_KSAFE:SELECT MARK_DESIGN_KSAFE(n);where
nis the new K-safety level for the database.
1.11.3 - Removing nodes from a database
In an Eon Mode database, you remove nodes from the subcluster that contains them, rather than from the database.
Note
In an Eon Mode database, you remove nodes from the subcluster that contains them, rather than from the database. See Removing Nodes for more information.As long as there are enough nodes remaining to satisfy the K-Safety requirements, you can remove the node from a database. You cannot drop nodes that are critical for K-safety. See Lowering K-Safety to enable node removal.
You can remove nodes from a database using one of the following:
-
Management Console interface
-
Administration Tools
Prerequisites
Before removing a node from the database, verify that the database complies with the following requirements:
-
It is running.
-
It has been backed up.
-
The database has the minimum number of nodes required to comply with K-safety. If necessary, temporarily lower the database K-safety level.
-
All of the nodes in your database must be either up or in active standby. Vertica reports the error "All nodes must be UP or STANDBY before dropping a node" if you attempt to remove a node while a database node is down. You will get this error, even if you are trying to remove the node that is down.
Management Console
Remove nodes with Management Console from its Manage page:
Remove database nodes as follows:
-
Choose the node to remove.
-
Click Remove node in the Node List.
The following restrictions apply:
-
You can only remove nodes that belong to the database cluster.
-
You cannot remove DOWN nodes.
When you remove a node, its state changes to STANDBY. You can later add STANDBY nodes back to the database.
Administration tools
To remove unused hosts from the database using Administration Tools:
-
Open the Administration Tools. See Using the administration tools for information about accessing the Administration Tools.
-
On the Main Menu, select View Database Cluster State to verify that the database is running. If the database is not running, start it.
-
From the Main Menu, choose Advanced Menu and choose OK.
-
In the Advanced menu, choose Cluster Management and choose OK.
-
In the Cluster Management menu, choose Remove Host(s) from Database and choose OK.
-
When warned that you must redesign your database and create projections that exclude the hosts you are going to drop, choose Yes.
-
Select the database from which you want to remove the hosts and choose OK.
A list of currently active hosts appears.
-
Select the hosts you want to remove from the database and choose OK.
-
When prompted, choose OK to confirm that you want to remove the hosts.
-
When informed that the hosts were successfully removed, choose OK.
-
If you removed a host from a Large Cluster configuration, open a vsql session and run realign_control_nodes:
SELECT realign_control_nodes();For more details, see REALIGN_CONTROL_NODES.
-
If this host is not used by any other database in the cluster, you can remove the host from the cluster. See Removing hosts from a cluster.
1.11.4 - Removing hosts from a cluster
If a host that you removed from the database is not used by any other database, you can remove it from the cluster with.
If a host that you removed from the database is not used by any other database, you can remove it from the cluster with
update_vertica . You can leave the database running during this operation.
When you use update_vertica to reduce the size of the cluster, it also performs these tasks:
-
Modifies the spread to match the smaller cluster.
-
Configures Administration tools to work with the smaller cluster.
Note
You can use Management Console to remove hosts from a database, but you cannot remove those hosts from a cluster.From one of the Vertica cluster hosts, run
update_vertica with the –-remove-hosts switch. This switch takes an list of comma-separated hosts to remove from the cluster. You can reference hosts by their names or IP addresses. For example, you can remove hosts host01, host02, and host03 as follows:
 # /opt/vertica/sbin/update_vertica --remove-hosts host01,host02,host03 \
            --rpm /tmp/vertica-10.1.1-0.x86_64.RHEL6.rpm \
            --dba-user mydba
If --rpm specifies a new RPM, then Vertica installs it on the existing cluster hosts before proceeding.
update_vertica uses the same options as
install_vertica.For all options, see Install Vertica with the installation script.
Requirements
-
If
-remove-hosts specifies a list of multiple hosts, the list must not embed any spaces between hosts. -
Use the same command line options as in the original installation. If you used non-default values for the database administrator username, password, or directory path, provide the same settings when you remove hosts; otherwise; the procedure fails. Consider saving the original installation options in a properties file that you can reuse on subsequent installation and update operations. See Install Vertica silently.
1.11.5 - Remove nodes from an AWS cluster
Use the following procedures to remove instances/nodes from an AWS cluster.
Use the following procedures to remove instances/nodes from an AWS cluster.
To avoid data loss, Vertica strongly recommends that you back up your database before removing a node. For details, see Backing up and restoring the database.
Remove hosts from the database
Before you remove hosts from the database, verify that you have:
-
Backed up the database.
-
Lowered the K-safety of the database.
Note
Do not stop the database.To remove a host from the database:
-
While logged on as dbadmin, launch Administration Tools.
$ /opt/vertica/bin/admintools -
From the Main Menu, select Advanced Menu.
-
From Advanced Menu, select Cluster Management. ClickOK.
-
From Cluster Management, select Remove Host(s). Click OK.
-
From Select Database, choose the database from which you plan to remove hosts. Click OK.
-
Select the host(s) to remove. Click OK.
-
Click Yes to confirm removal of the hosts.
Note
Enter a password if necessary. Leave blank if there is no password. -
Click OK. The system displays a message telling you that the hosts have been removed. Automatic rebalancing also occurs.
-
Click OK to confirm. Administration Tools brings you back to the Cluster Management menu.
Remove nodes from the cluster
To remove nodes from a cluster, run the update_vertica script and specify:
-
The option
--remove-hosts, followed by the IP addresses of the nodes you are removing. -
The option
--ssh-identity, followed by the location and name of your*pemfile. -
The option
--dba-user-password-disabled.
The following example removes one node from the cluster:
$ sudo /opt/vertica/sbin/update_vertica  --remove-hosts 10.0.11.165  --point-to-point  \
  --ssh-identity ~/name-of-pem.pem --dba-user-password-disabled
Stop the AWS instances
After you have removed one or more nodes from your cluster, to save costs associated with running instances, you can choose to stop the AWS instances that were previously part of your cluster.
To stop an instance in AWS:
-
On AWS, navigate to your Instances page.
-
Right-click the instance, and choose Stop.
This step is optional because, after you have removed the node from your Vertica cluster, Vertica no longer sees the node as part of the cluster, even though it is still running within AWS.
1.12 - Replacing nodes
If you have a database, you can replace nodes, as necessary, without bringing the system down.
If you have a K-Safe database, you can replace nodes, as necessary, without bringing the system down. For example, you might want to replace an existing node if you:
-
Need to repair an existing host system that no longer functions and restore it to the cluster
-
Want to exchange an existing host system for another more powerful system
Note
Vertica does not support replacing a node on a K-safe=0 database. Use the procedures to add and remove nodes instead.The process you use to replace a node depends on whether you are replacing the node with:
-
A host that uses the same name and IP address
-
A host that uses a different name and IP address
-
An active standby node
Prerequisites
-
Configure the replacement hosts for Vertica. See Before you Install Vertica.
-
Read the Important Tipssections under Adding hosts to a cluster and Removing hosts from a cluster.
-
Ensure that the database administrator user exists on the new host and is configured identically to the existing hosts. Vertica will setup passwordless ssh as needed.
-
Ensure that directories for Catalog Path, Data Path, and any storage locations are added to the database when you create it and/or are mounted correctly on the new host and have read and write access permissions for the database administrator user. Also ensure that there is sufficient disk space.
-
Follow the best practice procedure below for introducing the failed hardware back into the cluster to avoid spurious full-node rebuilds.
Best practice for restoring failed hardware
Following this procedure will prevent Vertica from misdiagnosing missing disk or bad mounts as data corruptions, which would result in a time-consuming, full-node recovery.
If a server fails due to hardware issues, for example a bad disk or a failed controller, upon repairing the hardware:
-
Reboot the machine into runlevel 1, which is a root and console-only mode.
Runlevel 1 prevents network connectivity and keeps Vertica from attempting to reconnect to the cluster.
-
In runlevel 1, validate that the hardware has been repaired, the controllers are online, and any RAID recover is able to proceed.
Note
You do not need to initialize RAID recover in runlevel 1; simply validate that it can recover. -
Once the hardware is confirmed consistent, only then reboot to runlevel 3 or higher.
At this point, the network activates, and Vertica rejoins the cluster and automatically recovers any missing data. Note that, on a single-node database, if any files that were associated with a projection have been deleted or corrupted, Vertica will delete all files associated with that projection, which could result in data loss.
1.12.1 - Replacing a host using the same name and IP address
If a host of an existing Vertica database is removed you can replace it while the database is running.
If a host of an existing Vertica database is removed you can replace it while the database is running.
Note
Remember a host in Vertica consists of the hardware and operating system on which Vertica software resides, as well as the same network configurations.You can replace the host with a new host that has the following same characteristics as the old host:
-
Name
-
IP address
-
Operating system
-
The OS administrator user
-
Directory location
Replacing the host while your database is running prevents system downtime. Before replacing a host, backup your database. See Backing up and restoring the database for more information.
Replace a host using the same characteristics as follows:
-
Run install_vertica from a functioning host using the --rpm or --deb parameter:
$ /opt/vertica/sbin/install_vertica --rpm rpm_packageFor more information see Install Vertica using the command line.
-
Use Administration Tools from an existing node to restart the new host. See Restart Vertica on a node.
The node automatically joins the database and recovers its data by querying the other nodes in the database. It then transitions to an UP state.
1.12.2 - Replacing a failed node using a node with a different IP address
Replacing a failed node with a host system that has a different IP address from the original consists of the following steps:.
Replacing a failed node with a host system that has a different IP address from the original consists of the following steps:
-
Vertica recommends that you back up the database before you perform this significant operation because it entails creating new projections, deleting old projections, and reloading data.
-
Add the new host to the cluster. See Adding hosts to a cluster.
-
If Vertica is still running in the node being replaced, then use the Administration Tools to Stop Vertica on Host on the host being replaced.
-
Use the Administration Tools to replace the original host with the new host. If you are using more than one database, replace the original host in all the databases in which it is used. See Replacing Hosts.
-
Use the procedure in Distributing Configuration Files to the New Host to transfer metadata to the new host.
-
Use the Administration Tools to restart Vertica on the host. On the Main Menu, select Restart Vertica on Host, and click OK. See Starting the database for more information.
Once you have completed this process, the replacement node automatically recovers the data that was stored in the original node by querying other nodes within the database.
1.12.3 - Replacing a functioning node using a different name and IP address
Replacing a node with a host system that has a different IP address and host name from the original consists of the following general steps:.
Replacing a node with a host system that has a different IP address and host name from the original consists of the following general steps:
-
Vertica recommends that you back up the database before you perform this significant operation because it entails creating new projections, deleting old projections, and reloading data.
-
Add the replacement hosts to the cluster.
At this point, both the original host that you want to remove and the new replacement host are members of the cluster.
-
Use the Administration Tools to Stop Vertica on Host on the host being replaced.
-
Use the Administration Tools to replace the original host with the new host. If you are using more than one database, replace the original host in all the databases in which it is used. See Replacing Hosts.
-
Restart Vertica on the host.
Once you have completed this process, the replacement node automatically recovers the data that was stored in the original node by querying the other nodes within the database. It then transitions to an UP state.
Note
If you do not remove the original host from the cluster and you attempt to restart the database, the host is not invited to join the database because its node address does not match the new address stored in the database catalog. Therefore, it remains in the INITIALIZING state.1.12.4 - Using the administration tools to replace nodes
If you are replacing a node with a host that uses a different name and IP address, use the Administration Tools to replace the original host with the new host.
If you are replacing a node with a host that uses a different name and IP address, use the Administration Tools to replace the original host with the new host. Alternatively, you can use the Management Console to replace a node.
Replace the original host with a new host using the administration tools
To replace the original host with a new host using the Administration Tools:
-
Back up the database. See Backing up and restoring the database.
-
From a node that is up, and is not going to be replaced, open the Administration tools.
-
On the Main Menu, select View Database Cluster State to verify that the database is running. If it’s not running, use the Start Database command on the Main Menu to restart it.
-
On the Main Menu, select Advanced Menu.
-
In the Advanced Menu, select Stop Vertica on Host.
-
Select the host you want to replace, and then click OK to stop the node.
-
When prompted if you want to stop the host, select Yes.
-
In the Advanced Menu, select Cluster Management, and then click OK.
-
In the Cluster Management menu, select Replace Host, and then click OK.
-
Select the database that contains the host you want to replace, and then click OK.
A list of all the hosts that are currently being used displays.
-
Select the host you want to replace, and then click OK.
-
Select the host you want to use as the replacement, and then click OK.
-
When prompted, enter the password for the database, and then click OK.
-
When prompted, click Yes to confirm that you want to replace the host.
-
When prompted that the host was successfully replaced, click OK.
-
In the Main Menu, select View Database Cluster State to verify that all the hosts are running. You might need to start Vertica on the host you just replaced. Use Restart Vertica on Host.
The node enters a RECOVERING state.
Caution
If you are using a K-Safe database, keep in mind that the recovering node counts as one node down even though it might not yet contain a complete copy of the data. This means that if you have a database in which K safety=1, the current fault tolerance for your database is at a critical level. If you lose one more node, the database shuts down. Be sure that you do not stop any other nodes.1.13 - Rebalancing data across nodes
Vertica can rebalance your database when you add or remove nodes.
Vertica can rebalance your database when you add or remove nodes. As a superuser, you can manually trigger a rebalance with Administration Tools, SQL functions, or the Management Console.
A rebalance operation can take some time, depending on the cluster size, and the number of projections and the amount of data they contain. You should allow the process to complete uninterrupted. If you must cancel the operation, call
CANCEL_REBALANCE_CLUSTER.
Why rebalance?
Rebalancing is useful or even necessary after you perform one of the following operations:
-
Change the size of the cluster by adding or removing nodes.
-
Mark one or more nodes as ephemeral in preparation of removing them from the cluster.
-
Change the scaling factor of an elastic cluster, which determines the number of storage containers used to store a projection across the database.
-
Set the control node size or realign control nodes on a large cluster layout.
-
Specify more than 120 nodes in your initial Vertica cluster configuration.
-
Modify a fault group by adding or removing nodes.
General rebalancing tasks
When you rebalance a database cluster, Vertica performs the following tasks for all projections, segmented and unsegmented alike:
-
Distributes data based on:
-
User-defined fault groups, if specified
-
Large cluster automatic fault groups
-
-
Ignores node-specific distribution specifications in projection definitions. Node rebalancing always distributes data across all nodes.
-
When rebalancing is complete, sets the Ancient History Mark the greatest allowable epoch (now).
Vertica rebalances segmented and unsegmented projections differently, as described below.
Rebalancing segmented projections
For each segmented projection, Vertica performs the following tasks:
-
Copies and renames projection buddies and distributes them evenly across all nodes. The renamed projections share the same base name.
-
Refreshes the new projections.
-
Drops the original projections.
Rebalancing unsegmented projections
For each unsegmented projection, Vertica performs the following tasks:
If adding nodes:
-
Creates projection buddies on them.
-
Maps the new projections to their shared name in the database catalog.
If dropping nodes: drops the projection buddies from them.
K-safety and rebalancing
Until rebalancing completes, Vertica operates with the existing K-safe value. After rebalancing completes, Vertica operates with the K-safe value specified during the rebalance operation. The new K-safe value must be equal to or higher than current K-safety. Vertica does not support downgrading K-safety and returns a warning if you try to reduce it from its current value. For more information, see Lowering K-Safety to enable node removal.
Rebalancing failure and projections
If a failure occurs while rebalancing the database, you can rebalance again. If the cause of the failure has been resolved, the rebalance operation continues from where it failed. However, a failed data rebalance can result in projections becoming out of date.
To locate out-of-date projections, query the system table
PROJECTIONS as follows:
=> SELECT projection_name, anchor_table_name, is_up_to_date FROM projections
   WHERE is_up_to_date = false;
To remove out-of-date projections, use
DROP PROJECTION.
Temporary tables
Node rebalancing has no effect on projections of temporary tables.
For Detailed Information About Rebalancing
See the Knowledge Base articles:
1.13.1 - Rebalancing data using the administration tools UI
To rebalance the data in your database:.
To rebalance the data in your database:
-
Open the Administration Tools. (See Using the administration tools.)
-
On the Main Menu, select View Database Cluster State to verify that the database is running. If it is not, start it.
-
From the Main Menu, select Advanced Menu and click OK.
-
In the Advanced Menu, select Cluster Management and click OK.
-
In the Cluster Management menu, select Re-balance Data and click OK.
-
Select the database you want to rebalance, and then select OK.
-
Enter the directory for the Database Designer outputs (for example
/tmp)and click OK. -
Accept the proposed K-safety value or provide a new value. Valid values are 0 to 2.
-
Review the message and click Proceed to begin rebalancing data.
The Database Designer modifies existing projections to rebalance data across all database nodes with the K-safety you provided. A script to rebalance data, which you can run manually at a later time, is also generated and resides in the path you specified; for example
/tmp/extend_catalog_rebalance.sql.Important
Rebalancing data can take some time, depending on the number of projections and the amount of data they contain. Vertica recommends that you allow the process to complete. If you must cancel the operation, use Ctrl+C.The terminal window notifies you when the rebalancing operation is complete.
-
Press Enter to return to the Administration Tools.
1.13.2 - Rebalancing data using SQL functions
Vertica has three SQL functions for starting and stopping a cluster rebalance.
Vertica has three SQL functions for starting and stopping a cluster rebalance. You can call these functions from a script that runs during off-peak hours, rather than manually trigger a rebalance through Administration Tools.
-
REBALANCE_CLUSTERrebalances the database cluster synchronously as a session foreground task. -
START_REBALANCE_CLUSTERasynchronously rebalances the database cluster as a background task. -
CANCEL_REBALANCE_CLUSTERstops any rebalance task that is currently in progress or is waiting to execute.
1.14 - Redistributing configuration files to nodes
The add and remove node processes automatically redistribute the Vertica configuration files.
The add and remove node processes automatically redistribute the Vertica configuration files. You rarely need to redistribute the configuration files to help resolve configuration issues.
To distribute configuration files to a host:
-
Log on to a host that contains these files and start Administration Tools.
-
On the Administration Tools Main Menu, select Configuration Menu and click OK.
-
On the Configuration Menu, select Distribute Config Files and click OK.
-
Select Database Configuration.
-
Select the database where you want to distribute the files and click OK.
Vertica configuration files are distributed to all other database hosts. If the files already existed on a host, they are overwritten.
-
On the Configuration Menu, select Distribute Config Files and click OK.
-
Select SSL Keys.
Certifications and keys are distributed to all other database hosts. If they already existed on a host, they are overwritten.
-
On the Configuration Menu, select Distribute Config Files and click OK.
Select AdminTools Meta-Data.
Administration Tools metadata is distributed to every host in the cluster.
Note
To distribute the configuration file admintools.conf via the command line or scripts, use the admintools option distribute_config_files:
$ admintools -t distribute_config_files
1.15 - Stopping and starting nodes on MC
You can start and stop one or more database nodes through the Manage page by clicking a specific node to select it and then clicking the Start or Stop button in the Node List.
You can start and stop one or more database nodes through the Manage page by clicking a specific node to select it and then clicking the Start or Stop button in the Node List.
Note
The Stop and Start buttons in the toolbar start and stop the database, not individual nodes.On the Databases and Clusters page, you must click a database first to select it. To stop or start a node on that database, click the View button. You'll be directed to the Overview page. Click Manage in the applet panel at the bottom of the page and you'll be directed to the database node view.
The Start and Stop database buttons are always active, but the node Start and Stop buttons are active only when one or more nodes of the same status are selected; for example, all nodes are UP or DOWN.
After you click a Start or Stop button, Management Console updates the status and message icons for the nodes or databases you are starting or stopping.
1.16 - Upgrading your operating system on nodes in your Vertica cluster
If you need to upgrade the operating system on the nodes in your Vertica cluster, check with the documentation for your Linux distribution to make sure they support the particular upgrade you are planning.
If you need to upgrade the operating system on the nodes in your Vertica cluster, check with the documentation for your Linux distribution to make sure they support the particular upgrade you are planning.
For example, the following articles provide information about upgrading Red Hat:
-
How do I upgrade from Red Hat Enterprise Linux 6 to Red Hat Enterprise Linux 7?
-
Does Red Hat support upgrades between major versions of Red Hat Enterprise Linux?
After you confirm that you can perform the upgrade, follow the steps at Best Practices for Upgrading the Operating System on Nodes in a Vertica Cluster.
1.17 - Reconfiguring node messaging
Sometimes, nodes of an existing, operational Vertica database cluster require new IP addresses.
Sometimes, nodes of an existing, operational Vertica database cluster require new IP addresses. Cluster nodes might also need to change their messaging protocols—for example, from broadcast to point-to-point. The admintools re_ip utility performs both tasks.
Note
You cannot change from one address family—IPv4 or IPv6—to another. For example, if hosts in the database cluster are identified by IPv4 network addresses, you can only change host addresses to another set of IPv4 addresses.Changing IP addresses
You can use re_ip to perform two tasks:
In both cases, re_ip requires a mapping file that identifies the current node IP addresses, which are stored in admintools.conf. You can get these addresses in two ways:
-
Use the admintools utility
list_allnodes:$ admintools -t list_allnodes Node | Host | State | Version | DB -----------------+---------------+-------+----------------+----------- v_vmart_node0001 | 192.0.2.254 | UP | vertica-12.0.1 | VMart v_vmart_node0002 | 192.0.2.255 | UP | vertica-12.0.1 | VMart v_vmart_node0003 | 192.0.2.256 | UP | vertica-12.0.1 | VMartTip
list_allnodescan help you identify issues that you might have to access Vertica. For example, if hosts are not communicating with each other, theVersioncolumn displays Unavailable. -
Print the content of
admintools.conf:$ cat /opt/vertica/config/admintools.conf ... [Cluster] hosts = 192.0.2.254, 192.0.2.255, 192.0.2.256 [Nodes] node0001 = 192.0.2.254/home/dbadmin,/home/dbadmin node0002 = 192.0.2.255/home/dbadmin,/home/dbadmin node0003 = 192.0.2.256/home/dbadmin,/home/dbadmin ...
Update node IP addresses
You can update IP addresses with re_ip as described below. re_ip automatically backs up admintools.conf so you can recover the original settings if necessary.
-
Create a mapping file with lines in the following format:
oldIPaddress newIPaddress[, controlAddress, controlBroadcast]
...
For example:
192.0.2.254 198.51.100.255, 198.51.100.255, 203.0.113.255 192.0.2.255 198.51.100.256, 198.51.100.256, 203.0.113.255 192.0.2.256 198.51.100.257, 198.51.100.257, 203.0.113.255controlAddressandcontrolBroadcastare optional. If omitted:-
controlAddressdefaults tonewIPaddress. -
controlBroadcastdefaults to the host ofnewIPaddress’s broadcast IP address.
-
-
Stop the database.
-
Run
re_ipto map old IP addresses to new IP addresses:$ admintools -t re_ip -f mapfilere_ipissues warnings for the following mapping file errors:-
IP addresses are incorrectly formatted.
-
Duplicate IP addresses, whether old or new.
If
re_ipfinds no syntax errors, it performs the following tasks:-
Remaps the IP addresses as listed in the mapping file.
-
If the
-ioption is omitted, asks to confirm updates to the database. -
Updates required local configuration files with the new IP addresses.
-
Distributes the updated configuration files to the hosts using new IP addresses.
For example:
Parsing mapfile... New settings for Host 192.0.2.254 are: address: 198.51.100.255 New settings for Host 192.0.2.255 are: address: 198.51.100.256 New settings for Host 192.0.2.254 are: address: 198.51.100.257 The following databases would be affected by this tool: Vmart Checking DB status ... Enter "yes" to write new settings or "no" to exit > yes Backing up local admintools.conf ... Writing new settings to local admintools.conf ... Writing new settings to the catalogs of database Vmart ... The change was applied to all nodes. Success. Change committed on a quorum of nodes. Initiating admintools.conf distribution ... Success. Local admintools.conf sent to all hosts in the cluster. -
-
Restart the database.
re_ip and export IP address
By default, a node's IP address and its export IP address are identical. For example:
=> SELECT node_name, node_address, export_address FROM nodes;
    node_name      | node_address    | export_address
------------------------------------------------------
v_VMartDB_node0001 | 192.168.100.101 | 192.168.100.101
v_VMartDB_node0002 | 192.168.100.102 | 192.168.100.101
v_VMartDB_node0003 | 192.168.100.103 | 192.168.100.101
v_VMartDB_node0004 | 192.168.100.104 | 192.168.100.101
(4 rows)
The export address is the IP address of the node on the network. This address provides access to other DBMS systems, and enables you to import and export data across the network.
If node IP and export IP addresses are the same, then running re_ip changes both to the new address. Conversely, if you manually change the export address, subsequent re_ip operations leave your export address changes untouched.
Change node control and broadcast addresses
You can map IP addresses for the database only, by using the re_ip option -O (or --db-only). Database-only operations are useful for error recovery. The node names and IP addresses that are specified in the mapping file must be the same as the node information in admintools.conf. In this case, admintools.conf is not updated. Vertica updates only spread.conf and the catalog with the changes.
You can also use re_ip to change the node control and broadcast addresses. In this case the mapping file must contain the control messaging IP address and associated broadcast address. This task allows nodes on the same host to have different data and control addresses.
-
Create a mapping file with lines in the following format:
nodeName nodeIPaddress, controlAddress, controlBroadcast
    ...
Tip
Query the system table NODES for node names.For example:
vertica_node001 192.0.2.254, 203.0.113.255, 203.0.113.258 vertica_node002 192.0.2.255, 203.0.113.256, 203.0.113.258 vertica_node003 192.0.2.256, 203.0.113.257, 203.0.113.258 -
Stop the database.
-
Run the following command to map the new IP addresses:
$ admintools -t re_ip -f mapfile -O -d dbname -
Restart the database.
Changing node messaging protocols
You can use re_ip to reconfigure spread messaging between Vertica nodes. re_ip configures node messaging to broadcast or point-to-point (unicast) messaging with these options:
-
-U,--broadcast(default) -
-T,--point-to-point
Both options support up to 80 spread daemons. You can exceed the 80-node limit by using large cluster mode, which does not install a spread daemon on each node.
For example, to set the database cluster messaging protocol to point-to-point:
$ admintools -t re_ip -d dbname -T
To set the messaging protocol to broadcast:
$ admintools -t re_ip -d dbname -U
Setting re_ip timeout
You can configure how long re_ip executes a given task before it times out, by editing the setting of prepare_timeout_sec in admintools.conf. By default, this parameter is set to 7200 (seconds).
1.17.1 - re_ip command
Updates database cluster node IP addresses and reconfigures spread messaging between nodes.
Updates database cluster node IP addresses and reconfigures spread messaging between nodes.
Syntax
admintools -t re_ip { -h
   | -f mapfile [-O -d dbname]
   | -d dbname { -T | U }
} [-i]
Options
| Option | Description |
|---|---|
-h | --help |
Displays online help. |
-f mapfile | --file=mapfile |
Name of the mapping text file used to map old addresses to new ones. |
-O | --dba-only |
Used for error recovery, updates and replaces data on the database cluster catalog and control messaging system. If the mapping file fails, Vertica automatically recreates it when you re-run the command. For details, see Change Node Control and Broadcast Addresses. This option updates only one database at a time, so it requires the |
-T | --point-to-point |
Sets control messaging to the point-to-point (unicast) protocol. Vertica can change the messaging protocol on only one database at a time, so you must specify the target database with the Use point-to-point if nodes are not located on the same subnet. Point-to-point supports up to 80 spread daemons. You can exceed the 80-node limit by using large cluster mode, which does not install a spread daemon on each node. |
-U | --broadcast |
Sets control messaging to the broadcast protocol, the default setting. Vertica can change the messaging protocol on only one database at a time, so you must specify the target database with the Broadcast supports up to 80 spread daemons. You can exceed the 80-node limit by using large cluster mode, which does not install a spread daemon on each node. |
-d dbname | --database=dbname |
Database name, required with the following
|
-i | --noprompts |
System does not prompt to validate new settings before executing the re_ip operation. Prompting is on by default. |
1.17.2 - Restarting a node with new host IPs
For information about remapping node IP addresses on a non-Kubernetes database, see Mapping New IP Addresses.
Kubernetes only
Note
For information about remapping node IP addresses on a non-Kubernetes database, see Reconfiguring node messaging.The node IP addresses of an Eon Mode database on Kubernetes must occasionally be updated—for example, a pod fails, or is added to the cluster or rescheduled. When this happens, you must update the Vertica catalog with the new IP addresses of affected nodes and restart the node.
Note
You cannot switch an existing database cluster from one address family to another. For example, you cannot change the IP addresses of the nodes in your database from IPv4 to IPv6.Vertica's restart_node tool addresses these requirements with its --new-host-ips option, which lets you change the node IP addresses of an Eon Mode database running on Kubernetes, and restart the updated nodes. Unlike remapping node IP addresses on other (non-Kubernetes) databases, you can perform this task on individual nodes in a running database:
admintools -t restart_node \
  {-d db-name |--database=db-name} [-p password | --password=password] \
  {{-s nodes-list | --hosts=nodes-list} --new-host-ips=ip-address-list}
-
nodes-listis a comma-delimited list of nodes to restart. All nodes in the list must be down, otherwise admintools returns an error. -
ip-address-listis a comma-delimited list of new IP addresses or host names to assign to the specified nodes.Note
Because a host name resolves to an IP address, Vertica recommends that you use the IP address to eliminate unneeded complexity.
The following requirements apply to nodes-list and ip-address-list:
-
The number of node hosts and IP addresses or host names must be the same.
-
The lists must not include any embedded spaces.
For example, you can restart node v_k8s_node0003 with a new IP address:
$ admintools -t list_allnodes
  Node           | Host       | State    | Version        | DB
 ----------------+------------+----------+----------------+-----
  v_k8s_node0001 | 172.28.1.4 | UP       | vertica-10.1.1 | K8s
  v_k8s_node0002 | 172.28.1.5 | UP       | vertica-10.1.1 | K8s
  v_k8s_node0003 | 172.28.1.6 | DOWN     | vertica-10.1.1 | K8s

$ admintools -t restart_node -s v_k8s_node0003 --new-host-ips 172.28.1.7 -d K8s
 Info: no password specified, using none
*** Updating IP addresses for nodes of database K8s ***
        Start update IP addresses for nodes
         Updating node IP addresses
         Generating new configuration information and reloading spread
*** Restarting nodes for database K8s ***
         Restarting host [172.28.1.7] with catalog [v_k8s_node0003_catalog]
         Issuing multi-node restart
         Starting nodes:
                 v_k8s_node0003 (172.28.1.7)
         Starting Vertica on all nodes. Please wait, databases with a large catalog may take a while to initialize.
         Node Status: v_k8s_node0003: (DOWN)
         Node Status: v_k8s_node0003: (DOWN)
         Node Status: v_k8s_node0003: (DOWN)
         Node Status: v_k8s_node0003: (DOWN)
         Node Status: v_k8s_node0003: (RECOVERING)
         Node Status: v_k8s_node0003: (UP)
$ admintools -t list_allnodes
  Node           | Host       | State | Version        | DB
 ----------------+------------+-------+----------------+-----
  v_k8s_node0001 | 172.28.1.4 | UP    | vertica-10.1.1 | K8s
  v_k8s_node0002 | 172.28.1.5 | UP    | vertica-10.1.1 | K8s
  v_k8s_node0003 | 172.28.1.7 | UP    | vertica-10.1.1 | K8s
1.18 - Adjusting Spread Daemon timeouts for virtual environments
relies on daemons to pass messages between database nodes.
Vertica relies on Spread daemons to pass messages between database nodes. Occasionally, nodes fail to respond to messages within the specified Spread timeout. These failures might be caused by spikes in network latency or brief pauses in the node's VM—for example, scheduled Azure maintenance timeouts. In either case, Vertica assumes that the non-responsive nodes are down and starts to remove them from the database, even though they might still be running. You can address this issue by adjusting the Spread timeout as needed.
Adjusting spread timeout
By default, the Spread timeout depends on the number of configured Spread segments:
| Configured Spread segments | Default timeout |
|---|---|
| 1 | 8 seconds |
| > 1 | 25 seconds |
Important
If you deploy your Vertica cluster with Azure Marketplace, the default Spread timeout is set to 35 seconds. If you manually create your cluster in Azure, the default Spread timeout is set to 8 or 25 seconds.If the Spread timeout is likely to elapse before the network or database nodes can respond, increase the timeout to the maximum length of non-responsive time plus five seconds. For example, if Azure memory-preserving maintenance pauses node VMs for up to 30 seconds, set the Spread timeout to 35 seconds.
If you are unsure how long network or node disruptions are liable to last, gradually increase the Spread timeout until fewer instances of UP nodes leave the database.
Important
Vertica cannot react to a node going down or being shut down improperly before the timeout period elapses. Changing Spread’s timeout to a value too high can result in longer query restarts if a node goes down.To see the current setting of the Spread timeout, query system table
SPREAD_STATE. For example, the following query shows that the current timeout setting (token_timeout) is set to 8000ms:
=> SELECT * FROM V_MONITOR.SPREAD_STATE;
    node_name     | token_timeout
------------------+---------------
 v_vmart_node0003 |          8000
 v_vmart_node0001 |          8000
 v_vmart_node0002 |          8000
(3 rows)
To change the Spread timeout, call the meta-function SET_SPREAD_OPTION and set the token timeout to a new value. The following example sets the timeout to 35000ms (35 seconds):
=> SELECT SET_SPREAD_OPTION( 'TokenTimeout', '35000');
NOTICE 9003:  Spread has been notified about the change
                   SET_SPREAD_OPTION
--------------------------------------------------------
 Spread option 'TokenTimeout' has been set to '35000'.

(1 row)

=> SELECT * FROM V_MONITOR.SPREAD_STATE;
    node_name     | token_timeout
------------------+---------------
 v_vmart_node0001 |         35000
 v_vmart_node0002 |         35000
 v_vmart_node0003 |         35000
(3 rows);
Note
Changing Spread settings with SET_SPREAD_OPTION has minor impact on your cluster as it pauses while the new settings are propagated across the cluster. Because of this delay, changes to the Spread timeout are not immediately visible in system tableSPREAD_STATE.
Azure maintenance and spread timeouts
Azure scheduled maintenance on virtual machines might pause nodes longer than the Spread timeout period. If so, Vertica is liable to view nodes that do not respond to Spread messages as down and remove them from the database.
The length of Azure maintenance tasks is usually well-defined. For example, memory-preserving updates can pause a VM for up to 30 seconds while performing maintenance on the system hosting the VM. This pause does not disrupt the node, which resumes normal operation after maintenance is complete. To prevent Vertica from removing nodes while they undergo Azure maintenance, adjust the Spread timeout as needed.
See also
2 - Managing disk space
Vertica detects and reports low disk space conditions in the log file so you can address the issue before serious problems occur.
Vertica detects and reports low disk space conditions in the log file so you can address the issue before serious problems occur. It also detects and reports low disk space conditions via SNMP traps if enabled.
Critical disk space issues are reported sooner than other issues. For example, running out of catalog space is fatal; therefore, Vertica reports the condition earlier than less critical conditions. To avoid database corruption when the disk space falls beyond a certain threshold, Vertica begins to reject transactions that update the catalog or data.
Caution
A low disk space report indicates one or more hosts are running low on disk space or have a failing disk. It is imperative to add more disk space (or replace a failing disk) as soon as possible.When Vertica reports a low disk space condition, use the DISK_RESOURCE_REJECTIONS system table to determine the types of disk space requests that are being rejected and the hosts on which they are being rejected.
To add disk space, see Adding disk space to a node. To replace a failed disk, see Replacing failed disks.
Monitoring disk space usage
You can use these system tables to monitor disk space usage on your cluster:
| System table | Description |
|---|---|
DISK_STORAGE |
Monitors the amount of disk storage used by the database on each node. |
COLUMN_STORAGE |
Monitors the amount of disk storage used by each column of each projection on each node. |
PROJECTION_STORAGE |
Monitors the amount of disk storage used by each projection on each node. |
2.1 - Adding disk space to a node
This procedure describes how to add disk space to a node in the Vertica cluster.
This procedure describes how to add disk space to a node in the Vertica cluster.
Note
If you are adding disk space to multiple nodes in the cluster, then use the following procedure for each node, one node at a time.To add disk space to a node:
-
If you must shut down the hardware to which you are adding disk space, then first shut down Vertica on the host where disk space is being added.
-
Add the new disk to the system as required by the hardware environment. Boot the hardware if it is was shut down.
-
Partition, format, and mount the new disk, as required by the hardware environment.
-
Create a data directory path on the new volume.
For example:
mkdir –p /myNewPath/myDB/host01_data2/ -
If you shut down the hardware, then restart Vertica on the host.
-
Open a database connection to Vertica and add a storage location to add the new data directory path. Specify the node in the CREATE LOCATION, otherwise Vertica assumes you are creating the storage location on all nodes.
See Creating storage locations in this guide and the CREATE LOCATION statement in the SQL Reference Manual.
2.2 - Replacing failed disks
If the disk on which the data or catalog directory resides fails, causing full or partial disk loss, perform the following steps:.
If the disk on which the data or catalog directory resides fails, causing full or partial disk loss, perform the following steps:
-
Replace the disk and recreate the data or catalog directory.
-
Distribute the configuration file (
vertica.conf) to the new host. See Distributing Configuration Files to the New Host for details. -
Restart the Vertica on the host, as described in Restart Vertica On Host.
See Catalog and data files for information about finding your DATABASE_HOME_DIR.
2.3 - Catalog and data files
For the recovery process to complete successfully, it is essential that catalog and data files be in the proper directories.
For the recovery process to complete successfully, it is essential that catalog and data files be in the proper directories.
In Vertica, the catalog is a set of files that contains information (metadata) about the objects in a database, such as the nodes, tables, constraints, and projections. The catalog files are replicated on all nodes in a cluster, while the data files are unique to each node. These files are installed by default in the following directories:
/DATABASE_HOME_DIR/DATABASE_NAME/v_db_nodexxxx_catalog/ /DATABASE_HOME_DIR/DATABASE_NAME/v_db_nodexxxx_catalog/
Note
DATABASE_HOME_DIR is the path, which you can see from the Administration Tools. See Using the administration tools in the Administrator's Guide for details on using the interface.To view the path of your database:
-
Run the Administration tools.
$ /opt/vertica/bin/admintools -
From the Main Menu, select Configuration Menu and click OK.
-
Select View Database and click OK.
-
Select the database you want would like to view and click OK to see the database profile.
See Understanding the catalog directory for an explanation of the contents of the catalog directory.
2.4 - Understanding the catalog directory
The catalog directory stores metadata and support files for your database.
The catalog directory stores metadata and support files for your database. Some of the files within this directory can help you troubleshoot data load or other database issues. See Catalog and data files for instructions on locating your database's catalog directory. By default, it is located in the database directory. For example, if you created the VMart database in the database administrator's account, the path to the catalog directory is:
/home/dbadmin/VMart/v_vmart_nodennnn_catalog
where nodennnn is the name of the node you are logged into. The name of the catalog directory is unique for each node, although most of the contents of the catalog directory are identical on each node.
The following table explains the files and directories that may appear in the catalog directory.
Note
Do not change or delete any of the files in the catalog directory unless asked to do so by Vertica support.| File or Directory | Description |
|---|---|
bootstrap-catalog.log |
A log file generated as the Vertica server initially creates the database (in which case, the log file is only created on the node used to create the database) and whenever the database is restored from a backup. |
Catalog/ |
Contains catalog information about the database, such as checkpoints. |
CopyErrorLogs/ |
The default location for the COPY exceptions and rejections files generated when data in a bulk load cannot be inserted into the database. See Handling messy data for more information. |
DataCollector/ |
Log files generated by the Data collector. |
debug_log.conf |
Debugging information configuration file. For Vertica use only. |
Epoch.log |
Used during recovery to indicate the latest epoch that contains a complete set of data. |
ErrorReport.txt |
A stack trace written by Vertica if the server process exits unexpectedly. |
Libraries/ |
Contains user defined library files that have been loaded into the database See Developing user-defined extensions (UDxs). Do not change or delete these libraries through the file system. Instead, use the CREATE LIBRARY, DROP LIBRARY, and ALTER LIBRARY statements. |
Snapshots/ |
The location where backups are stored. |
tmp/ |
A temporary directory used by Vertica's internal processes. |
UDxLogs/ |
Log files written by user defined functions that run in fenced mode. |
vertica.conf |
The configuration file for Vertica. |
vertica.log |
The main log file generated by the Vertica server process. |
vertica.pid |
The process ID and path to the catalog directory of the Vertica server process running on this node. |
2.5 - Reclaiming disk space from deleted table data
You can reclaim disk space from deleted table data in several ways:.
You can reclaim disk space from deleted table data in several ways:
3 - Memory usage reporting
Vertica periodically polls its own memory usage to determine whether it is below the threshold that is set by configuration parameter MemoryPollerReportThreshold.
Vertica periodically polls its own memory usage to determine whether it is below the threshold that is set by configuration parameter
MemoryPollerReportThreshold.Polling occurs at regular intervals—by default, every 2 seconds—as set by configuration parameter
MemoryPollerIntervalSec.
The memory poller compares MemoryPollerReportThreshold with the following expression:
RSS / available-memory
When this expression evaluates to a value higher than MemoryPollerReportThreshold—by default, set to 0.93, then the memory poller writes a report to MemoryReport.log, in the Vertica working directory. This report includes information about Vertica memory pools, how much memory is consumed by individual queries and session, and so on. The memory poller also logs the report as an event in system table
MEMORY_EVENTS, where it sets EVENT_TYPE to MEMORY_REPORT.
The memory poller also checks for excessive glibc allocation of free memory (glibc memory bloat). For details, see Memory trimming.
4 - Memory trimming
Under certain workloads, glibc can accumulate a significant amount of free memory in its allocation arena.
Under certain workloads, glibc can accumulate a significant amount of free memory in its allocation arena. This memory consumes physical memory as indicated by its usage of resident set size (RSS), which glibc does not always return to the operating system. High retention of physical memory by glibc—glibc memory bloat—can adversely affect other processes, and, under high workloads, can sometimes cause Vertica to run out of memory.
Vertica provides two configuration parameters that let you control how frequently Vertica detects and consolidates much of the glibc-allocated free memory, and then returns it to the operating system:
-
MemoryPollerTrimThreshold: Sets the threshold for the memory poller to start checking whether to trimglibc-allocated memory.The memory poller compares
MemoryPollerTrimThreshold—by default, set to 0.83— with the following expression:RSS / available-memoryIf this expression evaluates to a value higher than
MemoryPollerTrimThreshold, then the memory poller starts checking the next threshold—set inMemoryPollerMallocBloatThreshold—for glibc memory bloat.Note
On high-memory machines where very large Vertica RSS values are atypical, consider a higher setting forMemoryPollerTrimThreshold. To turn off auto-trimming, set this parameter to 0. -
MemoryPollerMallocBloatThreshold: Sets the threshold of glibc memory bloat.The memory poller calls glibc function
malloc_info()to obtain the amount of free memory in malloc. It then comparesMemoryPollerMallocBloatThreshold—by default, set to 0.3—with the following expression:free-memory-in-malloc / RSSIf this expression evaluates to a value higher than
MemoryPollerMallocBloatThreshold, the memory poller calls glibc functionmalloc_trim(). This function reclaims free memory from malloc and returns it to the operating system. Details on calls tomalloc_trim()are written to system tableMEMORY_EVENTS.For example, the memory poller calls
malloc_trim()when the following conditions are true:-
MemoryPollerMallocBloatThresholdis set to 0.5. -
malloc_info()returns 15GB memory in malloc free. -
RSS is 30GB.
Note
This parameter is ignored ifMemoryPollerTrimThresholdis set to 0 (disabled). -
Trimming memory manually
If auto-trimming is disabled, you can manually reduce glibc-allocated memory by calling Vertica function
MEMORY_TRIM. This function calls malloc_trim().
5 - Tuple mover
The Tuple Mover manages ROS data storage.
The Tuple Mover manages ROS data storage. On mergeout, it combines small ROS containers into larger ones and purges deleted data. The Tuple Mover automatically performs these tasks in the background.
The database mode affects which nodes perform Tuple Mover operations:
-
In an Enterprise Mode database, all nodes run the Tuple Mover to perform mergeout operations on the data they store.
-
In Eon Mode, the primary subscriber to each shard plans Tuple Mover mergeout operations on the ROS containers in the shard. It can delegate the execution of this plan to another node in the cluster.
Tuple Mover operations typically require no intervention. However, Vertica provides various ways to adjust Tuple Mover behavior. For details, see Managing the tuple mover.
The tuple mover in Eon Mode databases
In Eon Mode, the Tuple Mover's operations are broken into two parts: mergeout planning and mergeout execution. Mergeout planning is always carried out by the primary subscribers of the shards involved in the mergeout. These primary subscribers are part of same the primary subcluster. As part of its mergeout planning, the primary subscriber chooses a node to execute the mergeout plan. It uses two criteria to decide which node should execute the mergeout:
-
Only nodes that have memory allocated to their TM resource pool are eligible to perform a mergeout. The primary subscriber ignores all nodes in subclusters whose TM pool's MEMORYSIZE and MAXMEMORYSIZE settings are 0.
-
From the group of nodes able to execute a mergeout, the primary subscriber chooses the node that has the most ROS containers in its depot that are involved in the mergeout.
Limiting which subclusters perform mergeout tasks
You can prevent a secondary subcluster from being assigned mergeout tasks by changing the MEMORYSIZE and MAXMEMORYSIZE settings of the its TM pool to 0. These settings prevent the primary subscribers from assigning mergeout tasks to nodes in the subcluster.
Important
Primary subclusters must always be able to execute mergeout tasks. Only change these settings on secondary subclusters.For example, this statement prevents the subcluster named dashboard from running mergeout tasks.
=> ALTER RESOURCE POOL TM FOR SUBCLUSTER dashboard MEMORYSIZE '0%'
   MAXMEMORYSIZE '0%';
5.1 - Mergeout
DML activities such as COPY and data partitioning generate new ROS containers that typically require consolidation, while deleting and repartitioning data requires reorganization of existing containers.
Mergeout is a Tuple Mover process that consolidates ROS containers and purges deleted records. DML activities such as COPY and data partitioning generate new ROS containers that typically require consolidation, while deleting and repartitioning data requires reorganization of existing containers. The Tuple Mover constantly monitors these activities, and executes mergeout as needed to consolidate and reorganize containers. By doing so, the Tuple Mover seeks to avoid two problems:
-
Performance degradation when column data is fragmented across multiple ROS containers.
-
Risk of ROS pushback when ROS containers for a given projection increase faster than the Tuple Mover can handle them. A projection can have up to 1024 ROS containers; when it reaches that limit, Vertica starts to return ROS pushback errors on all attempts to query the projection.
5.1.1 - Mergeout request types and precedence
The Tuple Mover constantly monitors all activity that generates new ROS containers.
The Tuple Mover constantly monitors all activity that generates new ROS containers. As it does so, it creates mergeout requests and queues them according to type. These types include, in descending order of precedence:
-
RECOMPUTE_LIMITS: Sets criteria used by the Tuple Mover to determine when to queue new merge requests for a projection. This request type is queued in two cases:
-
When a projection is created.
-
When an existing projection changes—for example, a column is added or dropped, or a configuration parameter changes that affects ROS storage for that projection, such as ActivePartitionCount.
-
-
MERGEOUT: Consolidate new containers. These containers typically contain data from recent load activity or table partitioning.
-
DVMERGEOUT: Consolidate data marked for deletion, or delete vectors.
-
PURGE: Purge aged-out delete vectors from containers.
The Tuple Mover also monitors how frequently containers are created for each projection, to determine which projections might be at risk from ROS pushback. Intense DML activity on projections typically causes a high rate of container creation. The Tuple Mover monitors MERGEOUT and DVMERGEOUT requests and, within each set, prioritizes them according to their level of projection activity. Mergeout requests for projections with the highest rate of container creation get priority for immediate execution.
Note
The Tuple Mover often postpones mergeout for projections with a low level of load activity. Until a projection meets the internal threshold for queuing mergeout requests, mergeout from those projections is liable to remain on hold.5.1.2 - Scheduled mergeout
At regular intervals set by configuration parameter MergeOutInterval, the Tuple Mover checks the mergeout request queue for pending requests:.
At regular intervals set by configuration parameter
MergeOutInterval, the Tuple Mover checks the mergeout request queue for pending requests:
-
If the queue contains mergeout requests, the Tuple Mover does nothing and goes back to sleep.
-
If the queue is empty, the Tuple Mover:
-
Processes pending storage location move requests.
-
Checks for new unqueued purge requests and adds them to the queue.
It then goes back to sleep.
-
By default, this parameter is set to 600 (seconds).
Important
Scheduled mergeout is independent of the Tuple Mover service that continuously monitors mergeout requests and executes them as needed.5.1.3 - User-invoked mergeout
You can invoke mergeout at any time on one or more projections, by calling Vertica meta-function DO_TM_TASK:.
You can invoke mergeout at any time on one or more projections, by calling Vertica meta-function
DO_TM_TASK:
DO_TM_TASK('mergeout'[, '[[database.]schema.]{table | projection} ]')
The function scans the database catalog within the specified scope to identify outstanding mergeout tasks. If no table or projection is specified, DO_TM_TASK scans the entire catalog. Unlike the continuous TM service, which runs in the TM resource pool, DO_TM_TASK runs in the GENERAL pool. If DO_TM_TASK executes mergeout tasks that are pending in the merge request queue, the TM service removes these tasks from the queue with no action taken.
5.1.4 - Partition mergeout
Vertica keeps data from different table partitions or partition groups separate on disk.
Vertica keeps data from different table partitions or partition groups separate on disk. The Tuple Mover adheres to this separation policy when it consolidates ROS containers. When a partition is first created, it typically has frequent data loads and requires regular activity from the Tuple Mover. As a partition ages, it commonly transitions to a mostly read-only workload and requires much less activity.
The Tuple Mover has two different policies for managing these different partition workloads:
-
Active partition is the partition that was most recently created. The Tuple Mover uses a strata-based algorithm that seeks to minimize the number of times individual tuples undergo mergeout. A table's active partition count identifies how many partitions are active for that table.
-
Inactive partitions are those that were not most recently created. The Tuple Mover consolidates ROS containers to a minimal set while avoiding merging containers whose size exceeds
MaxMrgOutROSSizeMB.
Note
If you invoke mergeout with the Vertica meta-functionDO_TM_TASK, all partitions are consolidated into the smallest possible number of containers, including active partitions.
For details on how the Tuple Mover identifies active partitions, see Active and inactive partitions.
Partition mergeout thread allocation
The TM resource pool sets the number of threads that are available for mergeout with its MAXCONCURRENCY parameter. By default , this parameter is set to 7. Vertica allocates half the threads to active partitions, and the remaining half to active and inactive partitions. If MAXCONCURRENCY is set to an uneven integer, Vertica rounds up to favor active partitions.
For example, if MAXCONCURRENCY is set to 7, then Vertica allocates four threads exclusively to active partitions, and allocates the remaining three threads to active and inactive partitions as needed. If additional threads are required to avoid ROS pushback, increase MAXCONCURRENCY with ALTER RESOURCE POOL.
5.1.5 - Deletion marker mergeout
When you delete data from the database, Vertica does not remove it.
When you delete data from the database, Vertica does not remove it. Instead, it marks the data as deleted. Using many
DELETE statements to mark a small number of rows relative to the size of a table can result in creating many small containers—delete vectors—to hold data marked for deletion. Each delete vector container consumes resources, so a large number of such containers can adversely impact performance, especially during recovery.
After the Tuple Mover performs a mergeout, it looks for deletion marker containers that hold few entries. If such containers exist, the Tuple Mover merges them together into a single, larger container. This process helps lower the overhead of tracking deleted data by freeing resources used by multiple, individual containers. The Tuple Mover does not purge or otherwise affect the deleted data, but consolidates delete vectors for greater efficiency.
Tip
Query system tableDELETE_VECTORS to view the number and size of containers that store deleted data.
5.1.6 - Disabling mergeout on specific tables
By default, mergeout is enabled for all tables and their projections.
By default, mergeout is enabled for all tables and their projections. You can disable mergeout on a table with ALTER TABLE. For example:
=> ALTER TABLE public.store_orders_temp SET MERGEOUT 0;
ALTER TABLE
In general, it is useful to disable mergeout on tables that you create to serve a temporary purpose—for example, staging tables that are used to archive old partition data, or swap partitions between tables—which are deleted soon after the task is complete. By doing so, you avoid the mergeout-related overhead that the table would otherwise incur.
You can query system table TABLES to identify tables that have mergeout disabled:
=> SELECT table_schema, table_name, is_mergeout_enabled FROM v_catalog.tables WHERE is_mergeout_enabled= 0;
 table_schema |    table_name     | is_mergeout_enabled
--------------+-------------------+---------------------
 public       | store_orders_temp | f
(1 row)
5.1.7 - Purging ROS containers
Vertica periodically checks ROS storage containers to determine whether delete vectors are eligible for purge, as follows:.
Vertica periodically checks ROS storage containers to determine whether delete vectors are eligible for purge, as follows:
-
Counts the number of aged-out delete vectors in each container—that is, delete vectors that are equal to or earlier than the ancient history mark (AHM) epoch.
-
Calculates the percentage of aged-out delete vectors relative to the total number of records in the same ROS container.
-
If this percentage exceeds the threshold set by configuration parameter PurgeMergeoutPercent (by default, 20 percent), Vertica automatically performs a mergeout on the ROS container that permanently removes all aged-out delete vectors. Vertica uses the TM resource pool's MAXCONCURRENCY setting to determine how many threads are available for the mergeout operation.
You can also manually purge all aged-out delete vectors from ROS containers with two Vertica meta-functions:
Both functions remove all aged-out delete vectors from ROS containers, regardless of how many are in a given container.
5.1.8 - Mergeout strata algorithm
The mergeout operation uses a strata-based algorithm to verify that each tuple is subjected to a mergeout operation a small, constant number of times, despite the process used to load the data.
The mergeout operation uses a strata-based algorithm to verify that each tuple is subjected to a mergeout operation a small, constant number of times, despite the process used to load the data. The mergeout operation uses this algorithm to choose which ROS containers to merge for non-partitioned tables and for active partitions in partitioned tables.
Vertica builds strata for each active partition and for projections anchored to non-partitioned tables. The number of strata, the size of each stratum, and the maximum number of ROS containers in a stratum is computed based on disk size, memory, and the number of columns in a projection.
Merging small ROS containers before merging larger ones provides the maximum benefit during the mergeout process. The algorithm begins at stratum 0 and moves upward. It checks to see if the number of ROS containers in a stratum has reached a value equal to or greater than the maximum ROS containers allowed per stratum. The default value is 32. If the algorithm finds that a stratum is full, it marks the projections and the stratum as eligible for mergeout.
5.2 - Managing the tuple mover
The Tuple Mover is preconfigured to handle typical workloads.
The Tuple Mover is preconfigured to handle typical workloads. However, some situations might require you to adjust Tuple Mover behavior. You can do so in various ways:
-
[Configure the TM resource pool](#Configur).
Configuring the TM resource pool
The Tuple Mover uses the built-in TM resource pool to handle its workload. Several settings of this resource pool can be adjusted to facilitate handling of high volume loads:
MEMORYSIZE
Specifies how much memory is reserved for the TM pool per node. The TM pool can grow beyond this lower limit by borrowing from the GENERAL pool. By default, this parameter is set to 5% of available memory. If MEMORYSIZE of the GENERAL resource pool is also set to a percentage, the TM pool can compete with it for memory. This value must always be less than or equal to MAXMEMORYSIZE setting.
Caution
Increasing MEMORYSIZE to a large percentage can cause regressions in memory-sensitive queries that run in the GENERAL pool.MAXMEMORYSIZE
Sets the upper limit of memory that can be allocated to the TM pool. The TM pool can grow beyond the value set by MEMORYSIZE by borrowing memory from the GENERAL pool. This value must always be equal to or greater than the MEMORYSIZE setting.
In an Eon Mode database, if you set this value to 0 on a subcluster level, the Tuple Mover is disabled on the subcluster.
Important
Never set the TM pool's MAXMEMORYSIZE to 0 on a primary subcluster. Primary subclusters must always run the Tuple Mover.MAXCONCURRENCY
Sets across all nodes the maximum number of concurrent execution slots available to TM pool. In databases created in Vertica releases ≥9.3, the default value is 7. In databases created in earlier versions, the default is 3.This setting specifies the maximum number of merges that can occur simultaneously on multiple threads.
PLANNEDCONCURRENCY
Specifies the preferred number queries to execute concurrently in the resource pool, across all nodes, by default set to 6. The Resource Manager uses PLANNEDCONCURRENCY to calculate the target memory that is available to a given query:
TM-memory-size / PLANNEDCONCURRENCY
The PLANNEDCONCURRENCY setting must be proportional to the size of RAM, the CPU, and the storage subsystem. Depending on the storage type, increasing PLANNEDCONCURRENCY for Tuple Mover threads might create a storage I/O bottleneck. Monitor the storage subsystem; if it becomes saturated with long I/O queues, more than two I/O queues, and long latency in read and write, adjust the PLANNEDCONCURRENCY parameter to keep the storage subsystem resources below saturation level.
Managing active data partitions
The Tuple Mover assumes that all loads and updates to a partitioned table are targeted to one or more partitions that it identifies as active. In general, the partitions with the largest partition keys—typically, the most recently created partitions—are regarded as active. As the partition ages, its workload typically shrinks and becomes mostly read-only.
You can specify how many partitions are active for partitioned tables at two levels, in ascending order of precedence:
-
Configuration parameter ActivePartitionCount determines how many partitions are active for partitioned tables in the database. By default, ActivePartitionCount is set to 1. The Tuple Mover applies this setting to all tables that do not set their own active partition count.
-
Individual tables can supersede ActivePartitionCount by setting their own active partition count with CREATE TABLE and ALTER TABLE.
For details, see Active and inactive partitions.
See also
Best practices for managing workload resources6 - Managing workloads
You can also use resource pools to manage resources assigned to running queries.
Vertica's resource management scheme allows diverse, concurrent workloads to run efficiently on the database. For basic operations, Vertica pre-configures the built-in GENERAL pool based on RAM and machine cores. You can customize the General pool to handle specific concurrency requirements.
You can also define new resource pools that you configure to limit memory usage, concurrency, and query priority. You can then optionally assign each database user to use a specific resource pool, which controls memory resources used by their requests.
User-defined pools are useful if you have competing resource requirements across different classes of workloads. Example scenarios include:
-
A large batch job takes up all server resources, leaving small jobs that update a web page without enough resources. This can degrade user experience.
In this scenario, create a resource pool to handle web page requests and ensure users get resources they need. Another option is to create a limited resource pool for the batch job, so the job cannot use up all system resources.
-
An application has lower priority than other applications and you want to limit the amount of memory and number of concurrent users for the low-priority application.
In this scenario, create a resource pool with an upper limit on the query's memory and associate the pool with users of the low-priority application.
You can also use resource pools to manage resources assigned to running queries. You can assign a run-time priority to a resource pool, as well as a threshold to assign different priorities to queries with different durations. See Managing resources at query run time for more information.
Enterprise Mode and Eon Mode
In Enterprise Mode, there is one global set of resource pools for the entire database. In Eon Mode, you can allocate resources globally or per subcluster. See Managing workload resources in an Eon Mode database for more information.
6.1 - Resource manager
On a single-user environment, the system can devote all resources to a single query, getting the most efficient execution for that one query.
On a single-user environment, the system can devote all resources to a single query, getting the most efficient execution for that one query. More likely, your environment needs to run several queries at once, which can cause tension between providing each query the maximum amount of resources (fastest run time) and serving multiple queries simultaneously with a reasonable run time.
The Vertica Resource Manager lets you resolve this tension, while ensuring that every query is eventually serviced and that true system limits are respected at all times.
For example, when the system experiences resource pressure, the Resource Manager might queue queries until the resources become available or a timeout value is reached. In addition, when you configure various Resource Manager settings, you can tune each query's target memory based on the expected number of concurrent queries running against the system.
Resource manager impact on query execution
The Resource Manager impacts individual query execution in various ways. When a query is submitted to the database, the following series of events occur:
-
The query is parsed, optimized to determine an execution plan, and distributed to the participating nodes.
-
The Resource Manager is invoked on each node to estimate resources required to run the query and compare that with the resources currently in use. One of the following will occur:
-
If the memory required by the query alone would exceed the machine's physical memory, the query is rejected - it cannot possibly run. Outside of significantly under-provisioned nodes, this case is very unlikely.
-
If the resource requirements are not currently available, the query is queued. The query will remain on the queue until either sufficient resources are freed up and the query runs or the query times out and is rejected.
-
Otherwise the query is allowed to run.
-
-
The query starts running when all participating nodes allow it to run.
Note
Once the query is running, the Resource Manager further manages resource allocation usingRUNTIMEPRIORITY and RUNTIMEPRIORITYTHRESHOLD parameters for the resource pool. See Managing resources at query run time for more information.
Apportioning resources for a specific query and the maximum number of queries allowed to run depends on the resource pool configuration. See Resource pool architecture.
On each node, no resources are reserved or held while the query is in the queue. However, multi-node queries queued on some nodes will hold resources on the other nodes. Vertica makes every effort to avoid deadlocks in this situation.
6.2 - Resource pool architecture
The Resource Manager handles resources as one or more resource pools, which are a pre-allocated subset of the system resources with an associated queue.
The Resource Manager handles resources as one or more resource pools, which are a pre-allocated subset of the system resources with an associated queue.
In Enterprise Mode, there is one global set of resource pools that apply to all subclusters in the entire database. In Eon Mode, you can allocate resources globally or per subcluster. Global-level resource pools apply to all subclusters. Subcluster-level resource pools allow you to fine-tune resources for the type of workloads that the subcluster does. If you have both global- and subcluster-level resource pool settings, you can override any memory-related global setting for that subcluster. Global settings are applied to subclusters that do not have subcluster-level resource pool settings. See Managing workload resources in an Eon Mode database for more information about fine-tuning resource pools per subcluster.
Vertica is preconfigured with a set of Built-in pools that allocate resources to different request types, where the GENERAL pool allows for a certain concurrency level based on the RAM and cores in the machines.
Modifying and creating resource pools
You can configure the built-in GENERAL pool based on actual concurrency and performance requirements, as described in Built-in pools. You can also create custom pools to handle various classes of workloads and optionally restrict user requests to your custom pools.
You create and modify user-defined resource pools with
CREATE RESOURCE POOL and
ALTER RESOURCE POOL, respectively. You can configure these resource pools for memory usage, concurrency, and queue priority. You can also restrict a database user or user session to use a specific resource pool. Doing so allows you to control how memory, CPU, and other resources are allocated.
The following graphic illustrates what database operations are executed in which resource pool. Only three built-in pools are shown.
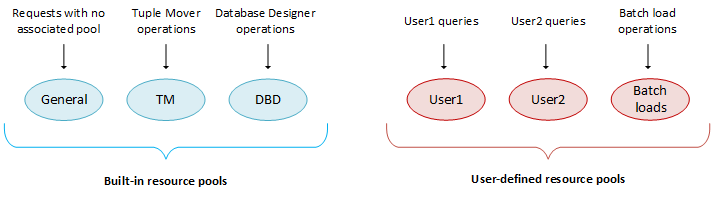
6.2.1 - Defining secondary resource pools
You can define secondary resource pools to which running queries can cascade if they exceed their primary pool's RUNTIMECAP .
You can define secondary resource pools to which running queries can cascade if they exceed their primary pool's RUNTIMECAP .
Identifying a secondary pool
Secondary resource pools designate a place where queries that exceed the RUNTIMECAP of the pool on which they are running can continue execution. If a query exceeds a pool's RUNTIMECAP, the query can cascade to a pool with a larger RUNTIMECAP instead of returning with an error. When a query cascades to another pool, the original pool regains the memory used by that query.
Unlike a user's primary resource pool, which requires USAGE privileges, Vertica does not check for user privileges on secondary resource pools. Thus, a user whose query cascades to a secondary resource pool requires no USAGE privileges on that resource pool.
You can define a secondary pool so it queues long-running queries if the pool lacks sufficient memory to handle that query immediately, by setting two parameters:
-
Set PRIORITY to HOLD, to queue queries until the pool's QUEUETIMEOUT interval elapses.
-
Set QUEUETIMEOUT to the appropriate length.
Eon Mode restrictions
In Eon Mode, you can associate user-defined resource pools with a subcluster. The following restrictions apply:
-
Global resource pools can cascade only to other global resource pools.
-
A subcluster resource pool can cascade to a global resource pool, or to another subcluster-specific resource pool that belongs to the same subcluster. If a subcluster-specific resource pool cascades to a user-defined resource pool that exists on both the global and subcluster level, the subcluster-level resource pool has priority. For example:
=> CREATE RESOURCE POOL billing1;
=> CREATE RESOURCE POOL billing1 FOR CURRENT SUBCLUSTER;
=> CREATE RESOURCE POOL billing2 FOR CURRENT SUBCLUSTER CASCADE TO billing1;
WARNING 9613:  Resource pool billing1 both exists at both subcluster level and global level, assuming subcluster level
CREATE RESOURCE POOL
Query cascade path
Vertica routes queries to a secondary pool when the RUNTIMECAP on an initial pool is reached. Vertica then checks the secondary pool's RUNTIMECAP value. If the secondary pool's RUNTIMECAP is greater than the initial pool's value, the query executes on the secondary pool. If the secondary pool's RUNTIMECAP is less than or equal to the initial pool's value, Vertica retries the query on the next pool in the chain until it finds a pool on which the RUNTIMECAP is greater than the initial pool's value. If the secondary pool does not have sufficient resources available to execute the query at that time, SELECT queries may re-queue, re-plan, and abort on that pool. Other types of queries will fail due to insufficient resources. If no appropriate secondary pool exists for a query, the query will error out.
The following diagram demonstrates the path a query takes to execution.
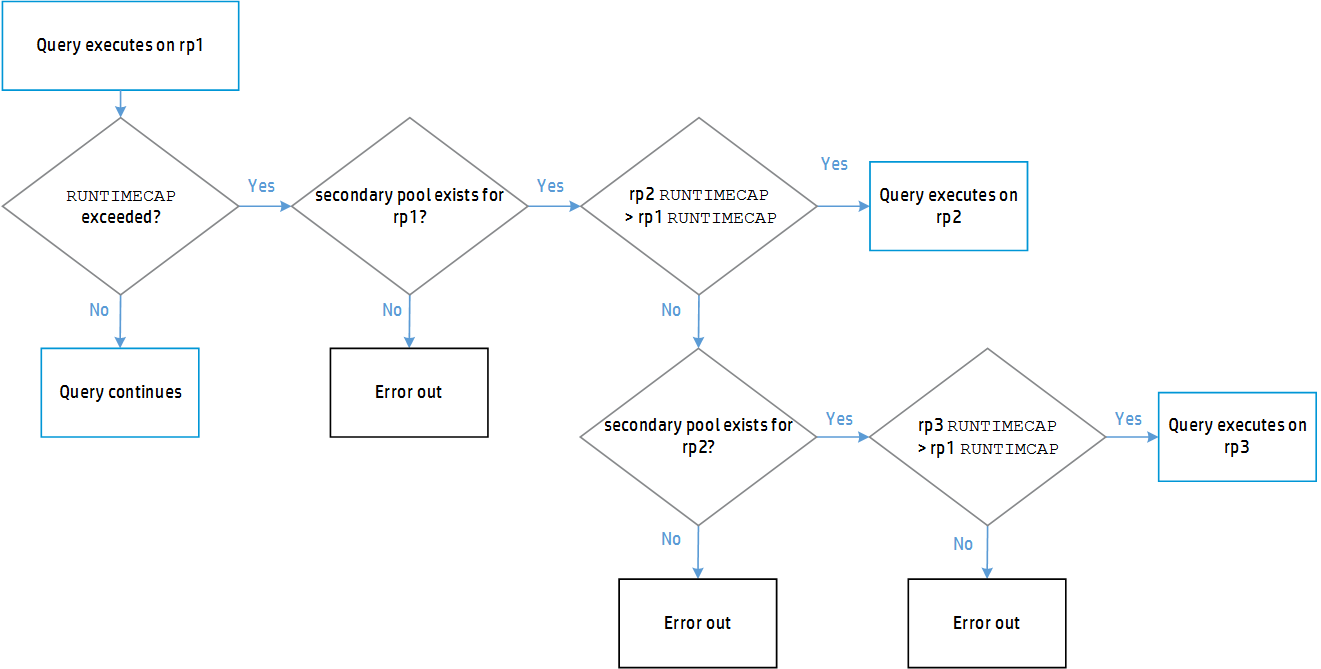
Query execution time allocation
After Vertica finds an appropriate pool on which to run the query, it continues to execute that query uninterrupted. The query now has the difference of the two pools' RUNTIMECAP limits in which to complete:
query execution time allocation = rp2 RUNTIMECAP - rp1 RUNTIMECAP
Using CASCADE TO
As a superuser, you can identify an existing resource pool—either user-defined pool or the GENERAL pool—by using the CASCADE TO parameter in the CREATE RESOURCE POOL or ALTER RESOURCE POOL statement.
In the following example, two resource pools are created and associated with a user as follows:
- The
shortUserQueriesresource pool is created with a one-minute RUNTIMECAP - The
userOverflowresource pool is created with a RUNTIMECAP of five minutes. shortUserQueriesis modified with ALTER RESOURCE POOL...CASCADE to useuserOverflowto handle queries that require more than one minute to process.- The user
mollyis created and configured to useshortUserQueriesto handle that user's queries.
Given this scenario, queries issued by molly are initially directed to shortUserQueries for handling; queries that require more than one minute of processing time automatically cascade to the userOverflow pool to complete execution. Using the secondary pool frees up space in the primary pool, which is configured to handle short queries:
=> CREATE RESOURCE POOL shortUserQueries RUNTIMECAP '1 minutes'
=> CREATE RESOURCE POOL userOverflow RUNTIMECAP '5 minutes';
=> ALTER RESOURCE POOL shortUserQueries CASCADE TO userOverflow;
=> CREATE USER molly RESOURCE POOL shortUserQueries;
If desired, you can modify this scenario so userOverflow can queue long-running queries until it is available to handle them, by setting the PRIORITY and QUEUETIMEOUT parameters:
=> ALTER RESOURCE POOL userOverflow PRIORITY HOLD QUEUETIMEOUT '10 minutes';
In this scenario, a query that cascades to userOverflow can be queued up to 10 minutes until userOverflow acquires the memory it requires to handle it. After 10 minutes elapse, the query is rejected and returns with an error.
Dropping a secondary pool
If you try to drop a resource pool that is the secondary pool for another resource pool, Vertica returns an error. The error lists the resource pools that depend on the secondary pool you tried to drop. To drop a secondary resource pool, first set the CASCADE TO parameter to DEFAULT on the primary resource pool, and then drop the secondary pool.
For example, you can drop resource pool rp2, which is a secondary pool for rp1, as follows:
=> ALTER RESOURCE POOL rp1 CASCADE TO DEFAULT;
=> DROP RESOURCE POOL rp2;
Secondary pool parameter dependencies
In general, a secondary pool's parameters are applied to an incoming query. In the case of RUNTIMEPRIORITY , the following dependencies apply:
-
If the RUNTIMEPRIORITYTHRESHOLD timer was not started when the query was running in the primary pool, the query adopts the secondary resource pools' RUNTIMEPRIORITY when it cascades. This happens either when the RUNTIMEPRIORITYTHRESHOLD is not set for the primary pool or the RUNTIMEPRIORITY is set to HIGH for the primary pool.
-
If the RUNTIMEPRIORITYTHRESHOLD was reached in the primary pool, the query adopts the secondary resource pools' RUNTIMEPRIORITY when it cascades.
-
If the RUNTIMEPRIORITYTHRESHOLD was not reached in the primary pool and the secondary pool has no threshold, the query adopts the new pool's RUNTIMEPRIORITY when it cascades.
-
If the RUNTIMEPRIORITYTHRESHOLD was not reached in the primary pool and the secondary pool has a threshold set.
-
If the primary pool's RUNTIMEPRIORITYTHRESHOLD is greater than or equal to the secondary pool's RUNTIMEPRIORITYTHRESHOLD , the query adopts the secondary pool's RUNTIMEPRIORITY after the query reaches the RUNTIMEPRIORITYTHRESHOLD of the primary pool.
For example:
RUNTIMECAP of primary pool = 5 sec
RUNTIMEPRIORITYTHRESHOLD of primary pool = 8 sec
RUNTIMTPRIORITYTHRESHOLD of secondary pool = 7 sec
In this case, the query runs for 5 seconds on the primary pool and then cascades to the secondary pool. After another 3 seconds, 8 seconds total, the query adopts the RUNTIMEPRIORITY of the secondary pool.
-
If the primary pool's RUNTIMEPRIORITYTHRESHOLD is less than the secondary pool's RUNTIMEPRIORITYTHRESHOLD, the query adopts the secondary pool's RUNTIMEPRIORITY after the query reaches the RUNTIMEPRIORITYTHRESHOLD of the secondary pool.
In this case, the query runs for 5 seconds on the primary pool and then cascades to the secondary pool. After another 7 seconds, 12 seconds total, the query adopts the RUNTIMEPRIORITY of the secondary pool:
RUNTIMECAP of primary pool = 5 sec
RUNTIMEPRIORITYTHRESHOLD of primary pool = 8 sec
RUNTIMTPRIORITYTHRESHOLD of secondary pool = 12 se
CASCADE errors
A query that cascades to a secondary resource pool typically returns with an error in the following cases:
-
The resource pool cannot acquire the memory it needs to finish processing the query.
-
The secondary resource pool parameter MAXCONCURRENCYis set to 1 and it is already processing another query.
6.2.2 - Querying resource pool settings
You can use the following to get information about resource pools:.
You can use the following to get information about resource pools:
-
RESOURCE_POOLS returns resource pool settings from the Vertica database catalog, as set by CREATE RESOURCE POOL and ALTER RESOURCE POOL.
-
SUBCLUSTER_RESOURCE_POOL_OVERRIDES displays all subcluster level overrides of global resource pool settings.
For runtime information about resource pools, see Monitoring resource pools.
Querying resource pool settings
The following example queries various settings of two internal resource pools, GENERAL and TM:
=> SELECT name, subcluster_oid, subcluster_name, maxmemorysize, memorysize, runtimepriority, runtimeprioritythreshold, queuetimeout
   FROM RESOURCE_POOLS WHERE name IN('general', 'tm');
  name   | subcluster_oid | subcluster_name | maxmemorysize | memorysize | runtimepriority | runtimeprioritythreshold | queuetimeout
---------+----------------+-----------------+---------------+------------+-----------------+--------------------------+--------------
 general |              0 |                 | Special: 95%  |            | MEDIUM          |                        2 | 00:05
 tm      |              0 |                 |               | 3G         | MEDIUM          |                       60 | 00:05
(2 rows)
Viewing overrides to global resource pools
In Eon Mode, you can query SUBCLUSTER_RESOURCE_POOL_OVERRIDES in the system tables to view any overrides to global resource pools for individual subclusters. The following query shows an override that sets MEMORYSIZE and MAXMEMORYSIZE for the built-in resource pool TM to 0% in the analytics_1 subcluster. These settings prevent the subcluster from performing Tuple Mover mergeout tasks.
=> SELECT * FROM SUBCLUSTER_RESOURCE_POOL_OVERRIDES;
     pool_oid      | name |  subcluster_oid   | subcluster_name | memorysize | maxmemorysize | maxquerymemorysize
-------------------+------+-------------------+-----------------+------------+---------------+--------------------
 45035996273705058 | tm   | 45035996273843504 | analytics_1     | 0%         | 0%            |
(1 row)
6.2.3 - User resource allocation
You can allocate resources to users in two ways:.
You can allocate resources to users in two ways:
- Customize allocation of resources for individual users by setting the appropriate user parameters.
- Assign users to a resource pool. This resource pool is used to process all queries from its assigned users, allocating resources as set by resource pool parameters.
The two methods can complement each other. For example, you can set the RUNTIMECAP parameter in the user-defined resource pool user_rp to 20 minutes. This setting applies to the queries of all users who are assigned to user_rp, including user Bob:
=> ALTER RESOURCE POOL user_rp RUNTIMECAP '20 minutes';
ALTER RESOURCE POOL
=> GRANT USAGE ON RESOURCE POOL user_rp to Bob;
GRANT PRIVILEGE
=> ALTER USER Bob RESOURCE POOL pool user_rp;
ALTER USER
When Vertica directs any query from user Bob to the user_rp resource pool for processing, it allocates resources to the query as configured in the resource pool, including RUNTIMECAP. Accordingly, queries in user_rp that do not complete execution within 20 minutes cascade to a secondary resource pool (if one is designated), or return to Bob with an error.
You can also edit Bob's user profile by setting its user-level parameter RUNTIMECAP to 10 minutes:
=> ALTER USER Bob RUNTIMECAP '10 minutes';
ALTER USER
On receiving queries from Bob after this change, the resource pool compares the two RUNTIMECAP settings—its own, and Bob's profile setting—and applies the shorter of the two. If you subsequently reassign Bob to another resource pool, the same logic applies, where the new resource pool continues to apply the shorter of the two RUNTIMECAP settings.
Precedence of user resource pools
Resource pools can be assigned to users at three levels, in ascending order of precedence:
-
Default user resource pool, set in configuration parameter DefaultResourcePoolForUsers. When a database user is created with CREATE USER, Vertica automatically sets the new user's profile to use this resource pool unless the CREATE USER statement specifies otherwise.
Important
By default, DefaultResourcePoolForUsers is set to the GENERAL resource pool, on which all new users have USAGE privileges. If you reconfigure DefaultResourcePoolForUsers to specify a user-defined resource pool, be sure that new users have USAGE privileges on it. -
User resource pool, set in the user's profile by CREATE USER or ALTER USER with its RESOURCE POOL parameter. If you try to drop a user's resource pool, Vertica checks whether it can assign that user to the default user resource pool. If the user cannot be assigned to this resource pool—typically, for lack of USAGE privileges—Vertica rolls back the drop operation.
-
Current user session resource pool, set by SET SESSION RESOURCE_POOL.
In all cases, users must have USAGE privileges on their assigned resource pool; otherwise, they cannot log in to the database.
Resource pool usage in Eon Mode
In an Eon Mode database, you can assign a given resource pool to a subcluster, and then configure user profiles to use that resource pool. When users connect to a subcluster, Vertica determines which resource pool handles their queries as follows:
- If a user's resource pool and the subcluster resource pool are the same, then the subcluster resource pool handles queries from that user.
- If a user's resource pool and the subcluster resource pool are different, and the user has privileges on the default user resource pool, then that resource pool handles queries from the user.
- If a user's resource pool and the subcluster resource pool are different, and the user lacks privileges on the default user resource pool, then no resource pool is available on any node to handle queries from that user, and the queries return with an error.
Examples
For examples of different use cases for managing user resources, see Managing workloads with resource pools and user profiles.
6.2.4 - Query budgeting
Before it can execute a query, Vertica devises a query plan, which it sends to each node that will participate in executing the query.
Before it can execute a query, Vertica devises a query plan, which it sends to each node that will participate in executing the query. The Resource Manager evaluates the plan on each node and estimates how much memory and concurrency the node needs to execute its part of the query. This is the query budget, which Vertica stores in the query_budget_kb column of system table
V_MONITOR.RESOURCE_POOL_STATUS.
A query budget is based on several parameter settings of the resource pool where the query will execute:
-
MEMORYSIZE -
MAXMEMORYSIZE -
PLANNEDCONCURRENCY
You can modify MAXMEMORYSIZE and PLANNEDCONCURRENCY for the GENERAL resource pool with
ALTER RESOURCE POOL. This resource pool typically executes queries that are not assigned to a user-defined resource pool. You can set all three parameters for any user-defined resource pool when you create it with
CREATE RESOURCE POOL, or later with
ALTER RESOURCE POOL.
Important
You can also limit how much memory that a pool can allocate at runtime to its queries, by setting parameterMAXQUERYMEMORYSIZE on that pool. For more information, see
CREATE RESOURCE POOL.
Computing the GENERAL pool query budget
Vertica calculates query budgets in the GENERAL pool with the following formula:
queryBudget = queuingThresholdPool / PLANNEDCONCURRENCY
Note
Vertica calculates the GENERAL pool's queuing threshold as 95 percent of itsMAXMEMORYSIZE setting.
Computing query budgets for user-defined resource pools
For user-defined resource pools, Vertica uses the following algorithm:
-
If
MEMORYSIZEis set to 0 andMAXMEMORYSIZEis not set:queryBudget = queuingThresholdGeneralPool / PLANNEDCONCURRENCY -
If
MEMORYSIZEis set to 0 andMAXMEMORYSIZEis set to a non-default value:query-budget = queuingThreshold / PLANNEDCONCURRENCYNote
Vertica calculates a user-defined pool's queuing threshold as 95 percent of itsMAXMEMORYSIZEsetting. -
If
MEMORYSIZEis set to a non-default value:queryBudget = MEMORYSIZE / PLANNEDCONCURRENCY
By carefully tuning a resource pool's MEMORYSIZE and PLANNEDCONCURRENCY parameters, you can control how much memory can be budgeted for queries.
Caution
Query budgets do not typically require tuning, However, if you reduce the MAXMEMORYSIZE because you need memory for other purposes, be aware that doing so also reduces the query budget. Reducing the query budget negatively impacts the query performance, particularly if the queries are complex.
To maintain the original query budget for the resource pool, be sure to reduce parameters MAXMEMORYSIZE and PLANNEDCONCURRENCY together.
See also
Do You Need to Put Your Query on a Budget? in the Vertica User Community.
6.3 - Managing resources at query run time
The Resource Manager estimates the resources required for queries to run, and then prioritizes them.
The Resource Manager estimates the resources required for queries to run, and then prioritizes them. You can control how the Resource Manager prioritizes query execution in several ways:
-
Set a resource pool's run-time priority relative to other resource pools.
-
Change a running query's priority relative to other queries in the same resource pool.
-
Move a running query to another resource pool.
6.3.1 - Setting runtime priority for the resource pool
For each resource pool, you can manage resources that are assigned to queries that are already running.
For each resource pool, you can manage resources that are assigned to queries that are already running. You assign each resource pool a runtime priority of HIGH, MEDIUM, or LOW. These settings determine the amount of runtime resources (such as CPU and I/O bandwidth) assigned to queries in the resource pool when they run. Queries in a resource pool with a HIGH priority are assigned greater runtime resources than those in resource pools with MEDIUM or LOW runtime priorities.
Prioritizing queries within a resource pool
While runtime priority helps to manage resources for the resource pool, there may be instances where you want some flexibility within a resource pool. For instance, you may want to ensure that very short queries run at a high priority, while also ensuring that all other queries run at a medium or low priority.
The Resource Manager allows you this flexibility by letting you set a runtime priority threshold for the resource pool. With this threshold, you specify a time limit (in seconds) by which a query must finish before it is assigned the runtime priority of the resource pool. All queries begin running with a HIGH priority; once a query's duration exceeds the time limit specified in the runtime priority threshold, it is assigned the runtime priority of the resource pool.
Setting runtime priority and runtime priority threshold
You specify runtime priority and runtime priority threshold by setting two resource pool parameters with
CREATE RESOURCE POOL or
ALTER RESOURCE POOL:
-
RUNTIMEPRIORITY -
RUNTIMEPRIORITYTHRESHOLD
6.3.2 - Changing runtime priority of a running query
CHANGE_CURRENT_STATEMENT_RUNTIME_PRIORITY lets you to change a query's runtime priority.
CHANGE_CURRENT_STATEMENT_RUNTIME_PRIORITY lets you to change a query's runtime priority. You can change the runtime priority of a query that is already executing.
This function takes two arguments:
-
The query's transaction ID, obtained from the system table
SESSIONS -
The desired priority, one of the following string values:
HIGH,MEDIUM, orLOW
Restrictions
Superusers can change the runtime priority of any query to any priority level. The following restrictions apply to other users:
-
They can only change the runtime priority of their own queries.
-
They cannot raise the runtime priority of a query to a level higher than that of the resource pools.
Procedure
Changing a query's runtime priority is a two-step procedure:
-
Get the query's transaction ID by querying the system table
SESSIONS. For example, the following statement returns information about all running queries:=> SELECT transaction_id, runtime_priority, transaction_description from SESSIONS; -
Run `CHANGE_CURRENT_STATEMENT_RUNTIME_PRIORITY```, specifying the query's transaction ID and desired runtime priority:
=> SELECT CHANGE_CURRENT_STATEMENT_RUNTIME_PRIORITY(45035996273705748, 'low')
6.3.3 - Manually moving queries to different resource pools
If you are the database administrator, you can move queries to another resource pool mid-execution using the MOVE_STATEMENT_TO_RESOURCE_POOL meta-function.
If you are the database administrator, you can move queries to another resource pool mid-execution using the MOVE_STATEMENT_TO_RESOURCE_POOL meta-function.
You might want to use this feature if a single query is using a large amount of resources, preventing smaller queries from executing.
What happens when a query moves to a different resource pool
When a query is moved from one resource pool to another, it continues executing, provided the target pool has enough resources to accommodate the incoming query. If sufficient resources cannot be assigned in the target pool on at least one node, Vertica cancels the query and attempts to re-plan the query. If Vertica cannot re-plan the query, the query is canceled indefinitely.
When you successfully move a query to a target resource pool, its resources will be accounted for by the target pool and released on the first pool.
If you move a query to a resource pool with PRIORITY HOLD, Vertica cancels the query and queues it on the target pool. This cancellation remains in effect until you change the PRIORITY or move the query to another pool without PRIORITY HOLD. You can use this option if you want to store long-running queries for later use.
You can view the RESOURCE_ACQUISITIONS or RESOURCE_POOL_STATUS system tables to determine if the target pool can accommodate the query you want to move. Be aware that the system tables may change between the time you query the tables and the time you invoke the MOVE_STATEMENT_TO_RESOURCE_POOL meta-function.
When a query successfully moves from one resource pool to another mid-execution, it executes until the greater of the existing and new RUNTIMECAP is reached. For example, if the RUNTIMECAP on the initial pool is greater than that on the target pool, the query can execute until the initial RUNTIMECAP is reached.
When a query successfully moves from one resource pool to another mid-execution the CPU affinity will change.
Using the MOVE_STATEMENT_TO_RESOURCE_POOL function
To manually move a query from its current resource pool to another resource pool, use the MOVE_STATEMENT_TO_RESOURCE_POOL meta-function. Provide the session id, transaction id, statement id, and target resource pool name, as shown:
=> SELECT MOVE_STATEMENT_TO_RESOURCE_POOL ('v_vmart_node0001.example.-31427:0x82fbm', 45035996273711993, 1, 'my_target_pool');
See also:
6.4 - Restoring resource manager defaults
System table RESOURCE_POOL_DEFAULTS stores default values for all parameters for all built-in and user-defined resource pools.
System table RESOURCE_POOL_DEFAULTS stores default values for all parameters for all built-in and user-defined resource pools.
If you have changed the value of any parameter in any of your resource pools and want to restore it to its default, you can simply alter the table and set the parameter to DEFAULT. For example, the following statement sets the RUNTIMEPRIORITY for the resource pool sysquery back to its default value:
=> ALTER RESOURCE POOL sysquery RUNTIMEPRIORITY DEFAULT;
6.5 - Best practices for managing workload resources
This section provides general guidelines and best practices on how to set up and tune resource pools for various common scenarios.
This section provides general guidelines and best practices on how to set up and tune resource pools for various common scenarios.
Note
The exact settings for resource pool parameters are heavily dependent on your query mix, data size, hardware configuration, and concurrency requirements. Vertica recommends performing your own experiments to determine the optimal configuration for your system.6.5.1 - Basic principles for scalability and concurrency tuning
A Vertica database runs on a cluster of commodity hardware.
A Vertica database runs on a cluster of commodity hardware. All loads and queries running against the database take up system resources, such as CPU, memory, disk I/O bandwidth, file handles, and so forth. The performance (run time) of a given query depends on how much resource it has been allocated.
When running more than one query concurrently on the system, both queries are sharing the resources; therefore, each query could take longer to run than if it was running by itself. In an efficient and scalable system, if a query takes up all the resources on the machine and runs in X time, then running two such queries would double the run time of each query to 2X. If the query runs in > 2X, the system is not linearly scalable, and if the query runs in < 2X then the single query was wasteful in its use of resources. Note that the above is true as long as the query obtains the minimum resources necessary for it to run and is limited by CPU cycles. Instead, if the system becomes bottlenecked so the query does not get enough of a particular resource to run, then the system has reached a limit. In order to increase concurrency in such cases, the system must be expanded by adding more of that resource.
In practice, Vertica should achieve near linear scalability in run times, with increasing concurrency, until a system resource limit is reached. When adequate concurrency is reached without hitting bottlenecks, then the system can be considered as ideally sized for the workload.
Note
Typically Vertica queries on segmented tables run on multiple (likely all) nodes of the cluster. Adding more nodes generally improves the run time of the query almost linearly.6.5.2 - Setting a runtime limit for queries
You can set a limit for the amount of time a query is allowed to run.
You can set a limit for the amount of time a query is allowed to run. You can set this limit at three levels, listed in descending order of precedence:
-
The resource pool to which the user is assigned.
-
User profile with
RUNTIMECAPconfiguredbyCREATE USER/ALTER USER -
Session queries, set by
SET SESSION RUNTIMECAP
In all cases, you set the runtime limit with an interval value that does not exceed one year. When you set runtime limit at multiple levels, Vertica always uses the shortest value. If a runtime limit is set for a non-superuser, that user cannot set any session to a longer runtime limit. Superusers can set the runtime limit for other users and for their own sessions, to any value up to one year, inclusive.
Example
user1 is assigned to the ad_hoc_queries resource pool:
=> CREATE USER user1 RESOURCE POOL ad_hoc_queries;
RUNTIMECAP for user1 is set to 1 hour:
=> ALTER USER user1 RUNTIMECAP '60 minutes';
RUNTIMECAP for the ad_hoc_queries resource pool is set to 30 minutes:
=> ALTER RESOURCE POOL ad_hoc_queries RUNTIMECAP '30 minutes';
In this example, Vertica terminates user1's queries if they exceed 30 minutes. Although the user1's runtime limit is set to one hour, the pool on which the query runs, which has a 30-minute runtime limit, has precedence.
Note
If a secondary pool for thead_hoc_queries pool is specified using the CASCADE TO function, the query executes on that pool when the RUNTIMECAP on the ad_hoc_queries pool is surpassed.
See also
6.5.3 - Handling session socket blocking
A session socket can be blocked while awaiting client input or output for a given query.
A session socket can be blocked while awaiting client input or output for a given query. Session sockets are typically blocked for numerous reasons—for example, when the Vertica execution engine transmits data to the client, or a
COPY LOCAL operation awaits load data from the client.
In rare cases, a session socket can remain indefinitely blocked. For example, a query times out on the client, which tries to forcibly cancel the query, or relies on the session RUNTIMECAP setting to terminate it. In either case, if the query ends while awaiting messages or data, the socket can remain blocked and the session hang until it is forcibly closed.
Configuring a grace period
You can configure the system with a grace period, during which a lagging client or server can catch up and deliver a pending response. If the socket is blocked for a continuous period that exceeds the grace period setting, the server shuts down the socket and throws a fatal error. The session is then terminated. If no grace period is set, the query can maintain its block on the socket indefinitely.
You should set the session grace period high enough to cover an acceptable range of latency and avoid closing sessions prematurely—for example, normal client-side delays in responding to the server. Very large load operations might require you to adjust the session grace period as needed.
You can set the grace period at four levels, listed in descending order of precedence:
-
Session (highest)
-
User
-
Node
-
Database
Setting grace periods for the database and nodes
At the database and node levels, you set the grace period to any interval up to 20 days, through configuration parameter BlockedSocketGracePeriod:
-
ALTER DATABASE db-name SET BlockedSocketGracePeriod = 'interval'; -
ALTER NODE node-name SET BlockedSocketGracePeriod = 'interval';
By default, the grace period for both levels is set to an empty string, which allows unlimited blocking.
Setting grace periods for users and sessions
You can set the grace period for individual users and for a given session, as follows:
-
{ CREATE | ALTER USER } user-name GRACEPERIOD {'interval' | NONE }; -
SET SESSION GRACEPERIOD { 'interval' | = DEFAULT | NONE };
A user can set a session to any interval equal to or less than the grace period set for that user. Superusers can set the grace period for other users, and for their own sessions, to any value up to 20 days, inclusive.
Examples
Superuser dbadmin sets the database grace period to 6 hours. This limit only applies to non-superusers. dbadmin can sets the session grace period for herself to any value up to 20 days—in this case, 10 hours:
=> ALTER DATABASE VMart SET BlockedSocketGracePeriod = '6 hours';
ALTER DATABASE
=> SHOW CURRENT BlockedSocketGracePeriod;
  level   |           name           | setting
----------+--------------------------+---------
 DATABASE | BlockedSocketGracePeriod | 6 hours
(1 row)

=> SET SESSION GRACEPERIOD '10 hours';
SET
=> SHOW GRACEPERIOD;
    name     | setting
-------------+---------
 graceperiod | 10:00
(1 row)
dbadmin creates user user777 created with no grace period setting. Thus, the effective grace period for user777 is derived from the database setting of BlockedSocketGracePeriod, which is 6 hours. Any attempt by user777 to set the session grace period to a value greater than 6 hours returns with an error:
=> CREATE USER user777;
=> \c - user777
You are now connected as user "user777".
=> SHOW GRACEPERIOD;
    name     | setting
-------------+---------
 graceperiod | 06:00
(1 row)

=> SET SESSION GRACEPERIOD '7 hours';
ERROR 8175:  The new period 07:00 would exceed the database limit of 06:00
dbadmin sets a grace period of 5 minutes for user777. Now, user777 can set the session grace period to any value equal to or less than the user-level setting:
=> \c
You are now connected as user "dbadmin".
=> ALTER USER user777 GRACEPERIOD '5 minutes';
ALTER USER
=> \c - user777
You are now connected as user "user777".
=> SET SESSION GRACEPERIOD '6 minutes';
ERROR 8175:  The new period 00:06 would exceed the user limit of 00:05
=> SET SESSION GRACEPERIOD '4 minutes';
SET
6.5.4 - Managing workloads with resource pools and user profiles
The scenarios in this section describe common workload-management issues, and provide solutions with examples.
The scenarios in this section describe common workload-management issues, and provide solutions with examples.
6.5.4.1 - Periodic batch loads
You do batch loads every night, or occasionally (infrequently) during the day.
Scenario
You do batch loads every night, or occasionally (infrequently) during the day. When loads are running, it is acceptable to reduce resource usage by queries, but at all other times you want all resources to be available to queries.
Solution
Create a separate resource pool for loads with a higher priority than the preconfigured setting on the build-in GENERAL pool.
In this scenario, nightly loads get preference when borrowing memory from the GENERAL pool. When loads are not running, all memory is automatically available for queries.
Example
Create a resource pool that has higher priority than the GENERAL pool:
-
Create resource pool
load_poolwith PRIORITY set to 10:=> CREATE RESOURCE POOL load_pool PRIORITY 10; -
Modify user
load_userto use the new resource pool:=> ALTER USER load_user RESOURCE POOL load_pool;
6.5.4.2 - CEO query
The CEO runs a report every Monday at 9AM, and you want to be sure that the report always runs.
Scenario
The CEO runs a report every Monday at 9AM, and you want to be sure that the report always runs.
Solution
To ensure that a certain query or class of queries always gets resources, you could create a dedicated pool for it as follows:
-
Using the PROFILE command, run the query that the CEO runs every week to determine how much memory should be allocated:
=> PROFILE SELECT DISTINCT s.product_key, p.product_description -> FROM store.store_sales_fact s, public.product_dimension p -> WHERE s.product_key = p.product_key AND s.product_version = p.product_version -> AND s.store_key IN ( -> SELECT store_key FROM store.store_dimension -> WHERE store_state = 'MA') -> ORDER BY s.product_key; -
At the end of the query, the system returns a notice with resource usage:
NOTICE: Statement is being profiled.HINT: select * from v_monitor.execution_engine_profiles where transaction_id=45035996273751349 and statement_id=6; NOTICE: Initiator memory estimate for query: [on pool general: 1723648 KB, minimum: 355920 KB] -
Create a resource pool with MEMORYSIZE reported by the above hint to ensure that the CEO query has at least this memory reserved for it:
=> CREATE RESOURCE POOL ceo_pool MEMORYSIZE '1800M' PRIORITY 10; CREATE RESOURCE POOL => \x Expanded display is on. => SELECT * FROM resource_pools WHERE name = 'ceo_pool'; -[ RECORD 1 ]-------+------------- name | ceo_pool is_internal | f memorysize | 1800M maxmemorysize | priority | 10 queuetimeout | 300 plannedconcurrency | 4 maxconcurrency | singleinitiator | f -
Assuming the CEO report user already exists, associate this user with the above resource pool using ALTER USER statement.
=> ALTER USER ceo_user RESOURCE POOL ceo_pool; -
Issue the following command to confirm that the ceo_user is associated with the ceo_pool:
=> SELECT * FROM users WHERE user_name ='ceo_user';
-[ RECORD 1 ]-+------------------
user_id       | 45035996273713548
user_name     | ceo_user
is_super_user | f
resource_pool | ceo_pool
memory_cap_kb | unlimited
If the CEO query memory usage is too large, you can ask the Resource Manager to reduce it to fit within a certain budget. See Query budgeting.
6.5.4.3 - Preventing runaway queries
Joe, a business analyst often runs big reports in the middle of the day that take up the whole machine's resources.You want to prevent Joe from using more than 100MB of memory, and you want to also limit Joe's queries to run for less than 2 hours.
Scenario
Joe, a business analyst often runs big reports in the middle of the day that take up the whole machine's resources.You want to prevent Joe from using more than 100MB of memory, and you want to also limit Joe's queries to run for less than 2 hours.
Solution
User resource allocation provides a solution to this scenario. To restrict the amount of memory Joe can use at one time, set a MEMORYCAP for Joe to 100MB using the ALTER USER command. To limit the amount of time that Joe's query can run, set a RUNTIMECAP to 2 hours using the same command. If any query run by Joe takes up more than its cap, Vertica rejects the query.
If you have a whole class of users whose queries you need to limit, you can also create a resource pool for them and set RUNTIMECAP for the resource pool. When you move these users to the resource pool, Vertica limits all queries for these users to the RUNTIMECAP you specified for the resource pool.
Example
=> ALTER USER analyst_user MEMORYCAP '100M' RUNTIMECAP '2 hours';
If Joe attempts to run a query that exceeds 100MB, the system returns an error that the request exceeds the memory session limit, such as the following example:
\i vmart_query_04.sqlvsql:vmart_query_04.sql:12: ERROR:  Insufficient resources to initiate plan
on pool general [Request exceeds memory session limit: 137669KB > 102400KB]
Only the system database administrator (dbadmin) can increase only the MEMORYCAP setting. Users cannot increase their own MEMORYCAP settings and will see an error like the following if they attempt to edit their MEMORYCAP or RUNTIMECAP settings:
ALTER USER analyst_user MEMORYCAP '135M';
ROLLBACK:  permission denied
6.5.4.4 - Restricting resource usage of ad hoc query application
You recently made your data warehouse available to a large group of users who are inexperienced with SQL.
Scenario
You recently made your data warehouse available to a large group of users who are inexperienced with SQL. Some users run reports that operate on a large number of rows and overwhelm the system. You want to throttle system usage by these users.
Solution
-
Create a resource pool for ad hoc applications where MAXMEMORYSIZE is equal to MEMORYSIZE. This prevents queries in that resource pool from borrowing resources from the GENERAL pool. Also, set RUNTIMECAP to limit the maximum duration of ad hoc queries:
=> CREATE RESOURCE POOL adhoc_pool MEMORYSIZE '200M' MAXMEMORYSIZE '200M' RUNTIMECAP '20 seconds' PRIORITY 0 QUEUETIMEOUT 300 PLANNEDCONCURRENCY 4; => SELECT pool_name, memory_size_kb, queueing_threshold_kb FROM V_MONITOR.RESOURCE_POOL_STATUS WHERE pool_name='adhoc_pool'; pool_name | memory_size_kb | queueing_threshold_kb ------------+----------------+----------------------- adhoc_pool | 204800 | 153600 (1 row) -
Associate this resource pool with database users who use the application to connect to the database.
=> ALTER USER app1_user RESOURCE POOL adhoc_pool;
Tip
Other solutions include limiting the memory usage of individual users such as in the Preventing runaway queries.6.5.4.5 - Setting a hard limit on concurrency for an application
For billing purposes, analyst Jane would like to impose a hard limit on concurrency for this application.
Scenario
For billing purposes, analyst Jane would like to impose a hard limit on concurrency for this application. How can she achieve this?
Solution
The simplest solution is to create a separate resource pool for the users of that application and set its MAXCONCURRENCY to the desired concurrency level. Any queries beyond MAXCONCURRENCY are queued.
Tip
Vertica recommends leaving PLANNEDCONCURRENCY to the default level so the queries get their maximum amount of resources. The system as a whole thus runs with the highest efficiency.Example
In this example, there are four billing users associated with the billing pool. The objective is to set a hard limit on the resource pool so a maximum of three concurrent queries can be executed at one time. All other queries will queue and complete as resources are freed.
=> CREATE RESOURCE POOL billing_pool MAXCONCURRENCY 3 QUEUETIMEOUT 2;
=> CREATE USER bill1_user RESOURCE POOL billing_pool;
=> CREATE USER bill2_user RESOURCE POOL billing_pool;
=> CREATE USER bill3_user RESOURCE POOL billing_pool;
=> CREATE USER bill4_user RESOURCE POOL billing_pool;
=> \x
Expanded display is on.

=> select maxconcurrency,queuetimeout from resource_pools where name = 'billing_pool';
maxconcurrency | queuetimeout
----------------+--------------
             3 |            2
(1 row)
> SELECT reason, resource_type, rejection_count  FROM RESOURCE_REJECTIONS
WHERE pool_name = 'billing_pool' AND node_name ilike '%node0001';
reason                                | resource_type | rejection_count
---------------------------------------+---------------+-----------------
Timedout waiting for resource request | Queries       |              16
(1 row)
If queries are running and do not complete in the allotted time (default timeout setting is 5 minutes), the next query requested gets an error similar to the following:
ERROR:  Insufficient resources to initiate plan on pool billing_pool [Timedout waiting for resource request: Request exceeds limits:
Queries Exceeded: Requested = 1, Free = 0 (Limit = 3, Used = 3)]
The table below shows that there are three active queries on the billing pool.
=> SELECT pool_name, thread_count, open_file_handle_count, memory_inuse_kb FROM RESOURCE_ACQUISITIONS
WHERE pool_name = 'billing_pool';
pool_name    | thread_count | open_file_handle_count | memory_inuse_kb
--------------+--------------+------------------------+-----------------
billing_pool |            4 |                      5 |          132870
billing_pool |            4 |                      5 |          132870
billing_pool |            4 |                      5 |          132870
(3 rows)
6.5.4.6 - Handling mixed workloads: batch versus interactive
You have a web application with an interactive portal.
Scenario
You have a web application with an interactive portal. Sometimes when IT is running batch reports, the web page takes a long time to refresh and users complain, so you want to provide a better experience to your web site users.
Solution
The principles learned from the previous scenarios can be applied to solve this problem. The basic idea is to segregate the queries into two groups associated with different resource pools. The prerequisite is that there are two distinct database users issuing the different types of queries. If this is not the case, do consider this a best practice for application design.
**Method 1
**Create a dedicated pool for the web page refresh queries where you:
-
Size the pool based on the average resource needs of the queries and expected number of concurrent queries issued from the portal.
-
Associate this pool with the database user that runs the web site queries. SeeCEO query for information about creating a dedicated pool.
This ensures that the web site queries always run and never queue behind the large batch jobs. Leave the batch jobs to run off the GENERAL pool.
For example, the following pool is based on the average resources needed for the queries running from the web and the expected number of concurrent queries. It also has a higher PRIORITY to the web queries over any running batch jobs and assumes the queries are being tuned to take 250M each:
=> CREATE RESOURCE POOL web_pool
     MEMORYSIZE '250M'
     MAXMEMORYSIZE NONE
     PRIORITY 10
     MAXCONCURRENCY 5
     PLANNEDCONCURRENCY 1;
**Method 2
**Create a resource pool with fixed memory size. This limits the amount of memory available to batch reports so memory is always left over for other purposes. For details, see Restricting resource usage of ad hoc query application.
For example:
=> CREATE RESOURCE POOL batch_pool
     MEMORYSIZE '4G'
     MAXMEMORYSIZE '4G'
     MAXCONCURRENCY 10;
The same principle can be applied if you have three or more distinct classes of workloads.
6.5.4.7 - Setting priorities on queries issued by different users
You want user queries from one department to have a higher priority than queries from another department.
Scenario
You want user queries from one department to have a higher priority than queries from another department.
Solution
The solution is similar to the mixed workload case. In this scenario, you do not limit resource usage; you set different priorities. To do so, create two different pools, each with MEMORYSIZE=0% and a different PRIORITY parameter. Both pools borrow from the GENERAL pool, however when competing for resources, the priority determine the order in which each pool's request is granted. For example:
=> CREATE RESOURCE POOL dept1_pool PRIORITY 5;
=> CREATE RESOURCE POOL dept2_pool PRIORITY 8;
If you find this solution to be insufficient, or if one department's queries continuously starves another department’s users, you can add a reservation for each pool by setting MEMORYSIZE so some memory is guaranteed to be available for each department.
For example, both resources use the GENERAL pool for memory, so you can allocate some memory to each resource pool by using ALTER RESOURCE POOL to change MEMORYSIZE for each pool:
=> ALTER RESOURCE POOL dept1_pool MEMORYSIZE '100M';
=> ALTER RESOURCE POOL dept2_pool MEMORYSIZE '150M';
6.5.4.8 - Continuous load and query
You want your application to run continuous load streams, but many have up concurrent query streams.
Scenario
You want your application to run continuous load streams, but many have up concurrent query streams. You want to ensure that performance is predictable.
Solution
The solution to this scenario depends on your query mix. In all cases, the following approach applies:
-
Determine the number of continuous load streams required. This may be related to the desired load rate if a single stream does not provide adequate throughput, or may be more directly related to the number of sources of data to load. Create a dedicated resource pool for the loads, and associate it with the database user that will perform them. See CREATE RESOURCE POOL for details.
In general, concurrency settings for the load pool should be less than the number of cores per node. Unless the source processes are slow, it is more efficient to dedicate more memory per load, and have additional loads queue. Adjust the load pool's QUEUETIMEOUT setting if queuing is expected.
-
Run the load workload for a while and observe whether the load performance is as expected. If the Tuple Mover is not tuned adequately to cover the load behavior, see Managing the tuple mover.
-
If there is more than one kind of query in the system—for example, some queries must be answered quickly for interactive users, while others are part of a batch reporting process—follow the guidelines in Handling mixed workloads: batch versus interactive.
-
Let the queries run and observe performance. If some classes of queries do not perform as desired, then you might need to tune the GENERAL pool as outlined in Restricting resource usage of ad hoc query application, or create more dedicated resource pools for those queries. For more information, see CEO query and Handling mixed workloads: batch versus interactive.
See the sections on Managing workloads and CREATE RESOURCE POOL for information on obtaining predictable results in mixed workload environments.
6.5.4.9 - Prioritizing short queries at run time
You recently created a resource pool for users who are inexperienced with SQL and who frequently run ad hoc reports.
Scenario
You recently created a resource pool for users who are inexperienced with SQL and who frequently run ad hoc reports. Until now, you managed resource allocation by creating a resource pool where MEMORYSIZE and MAXMEMORYSIZE are equal. This prevented queries in that resource pool from borrowing resources from the GENERAL pool. Now you want to manage resources at run time and prioritize short queries so they are never queued as a result of limited run-time resources.
Solution
-
Set
RUNTIMEPRIORITYfor the resource pool to MEDIUM or LOW. -
Set
RUNTIMEPRIORITYTHRESHOLDfor the resource pool to the duration of queries you want to ensure always run at a high priority.
For example:
=> ALTER RESOURCE POOL ad_hoc_pool RUNTIMEPRIORITY medium RUNTIMEPRIORITYTHRESHOLD 5;
Because RUNTIMEPRIORITYTHRESHOLD is set to 5, all queries in resource pool ad_hoc_pool that complete within 5 seconds run at high priority. Queries that exceeds 5 seconds drop down to the RUNTIMEPRIORITY assigned to the resource pool, MEDIUM.
6.5.4.10 - Dropping the runtime priority of long queries
You want most queries in a resource pool to run at a HIGH runtime priority; however, you'd like to be able to drop jobs longer than 1 hour to a lower priority.
Scenario
You want most queries in a resource pool to run at a HIGH runtime priority; however, you'd like to be able to drop jobs longer than 1 hour to a lower priority.
Solution
Set the RUNTIMEPRIORITY for the resource pool to LOW and set the RUNTIMEPRIORITYTHRESHOLD to a number that cuts off only the longest jobs.
Example
To ensure that all queries with a duration of more than 3600 seconds (1 hour) are assigned a low runtime priority, modify the resource pool as follows:
-
Set the RUNTIMEPRIORITY to LOW.
-
Set the RUNTIMETHRESHOLD to 3600
=> ALTER RESOURCE POOL ad_hoc_pool RUNTIMEPRIORITY low RUNTIMEPRIORITYTHRESHOLD 3600;
6.5.5 - Tuning built-in pools
The scenarios in this section describe how to tune built-in pools.
The scenarios in this section describe how to tune built-in pools.
6.5.5.1 - Restricting Vertica to take only 60% of memory
You have a single node application that embeds Vertica, and some portion of the RAM needs to be devoted to the application process.
Scenario
You have a single node application that embeds Vertica, and some portion of the RAM needs to be devoted to the application process. In this scenario, you want to limit Vertica to use only 60% of the available RAM.
Solution
Set the MAXMEMORYSIZE parameter of the GENERAL pool to the desired memory size. See Resource pool architecture for a discussion on resource limits.
6.5.5.2 - Tuning for recovery
You have a large database that contains a single large table with two projections, and with default settings, recovery is taking too long.
Scenario
You have a large database that contains a single large table with two projections, and with default settings, recovery is taking too long. You want to give recovery more memory to improve speed.
Solution
Set PLANNEDCONCURRENCY and MAXCONCURRENCY in the RECOVERY pool to 1, so recovery can take as much memory as possible from the GENERAL pool and run only one thread at once.
Caution
This setting can slow down other queries in your system.6.5.5.3 - Tuning for refresh
When a operation is running, system performance is affected and user queries are rejected.
Scenario
When a refresh operation is running, system performance is affected and user queries are rejected. You want to reduce the memory usage of the refresh job.
Solution
Set MEMORYSIZE in the REFRESH pool to a fixed value. The Resource Manager then tunes the refresh query to only use this amount of memory.
Important
Remember to reset MEMORYSIZE in the REFRESH pool to 0% after the refresh operation completes, so memory can be used for other operations.6.5.5.4 - Tuning tuple mover pool settings
During heavy load operations, you occasionally notice spikes in the number of ROS containers.
Scenario 1
During heavy load operations, you occasionally notice spikes in the number of ROS containers. You would like the Tuple Mover to perform mergeout more aggressively to consolidate ROS containers, and avoid ROS pushback.
Solution
Use ALTER RESOURCE POOL to increase the setting of MAXCONCURRENCY in the TM resource pools. This setting determines how many threads are available for mergeout. By default , this parameter is set to 7. Vertica allocates half the threads to active partitions, and the remaining half to active and inactive partitions as needed. If MAXCONCURRENCY is set to an uneven integer, Vertica rounds up to favor active partitions.
For example, if you increase MAXCONCURRENCY to 9, then Vertica allocates five threads exclusively to active partitions, and allocates the remaining four threads to active and inactive partitions.
Scenario 2
You have a secondary subcluster that is dedicated to time-sensitive analytic queries. You want to limit any other workloads on this subcluster that could interfere with it processing queries while also freeing up memory to perform queries.
By default, each subcluster has a built-in TM resource pool for Tuple Mover operations that makes it eligible to execute Tuple Mover mergeout operations. The TM pool consumes memory that could be used for queries. In addition, the mergeout operation could add a slight overhead to your subcluster's processing. You want to reallocate the memory consumed by the TM pool, and prevent the subcluster from running mergeout operations.
Solution
Use ALTER RESOURCE POOL to override the global TM resource pool for the secondary subcluster, and set both its MAXMEMORYSIZE and MEMORYSIZE to 0. This allows you to use the memory consumed by the global TM pool for use running analytic queries and prevents the subcluster being assigned TM mergeout operations to execute.
6.5.5.5 - Tuning for machine learning
A large number of machine learning functions are running, and you want to give them more memory to improve performance.
Scenario
A large number of machine learning functions are running, and you want to give them more memory to improve performance.
Solution
Vertica executes machine learning functions in the BLOBDATA resource pool. To improve performance of machine learning functions and avoid spilling queries to disk, increase the pool's MAXMEMORYSIZE setting with ALTER RESOURCE POOL.
For more about tuning query budgets, see Query budgeting.
See also
6.5.6 - Reducing query run time
Query run time depends on the complexity of the query, the number of operators in the plan, data volumes, and projection design.
Query run time depends on the complexity of the query, the number of operators in the plan, data volumes, and projection design. I/O or CPU bottlenecks can cause queries to run slower than expected. You can often remedy high CPU usage with better projection design. High I/O can often be traced to contention caused by joins and sorts that spill to disk. However, no single solution addresses all queries that incur high CPU or I/O usage. You must analyze and tune each queryindividually.
You can evaluate a slow-running query in two ways:
-
Prefix the query with
EXPLAINto view the optimizer's query plan. -
Examine the execution profile by querying system tables
QUERY_CONSUMPTIONorEXECUTION_ENGINE_PROFILES.
Examining the query plan can reveal one or more of the following:
-
Suboptimal projection sort order
-
Predicate evaluation on an unsorted or unencoded column
-
Use of
GROUPBY HASHinstead ofGROUPBY PIPE
Profiling
Vertica provides profiling mechanisms that help you evaluate database performance at different levels. For example, you can collect profiling data for a single statement, a single session, or for all sessions on all nodes. For details, see Profiling database performance.
6.5.7 - Managing workload resources in an Eon Mode database
You primarily control workloads in an Eon Mode database using subclusters.
You primarily control workloads in an Eon Mode database using subclusters. For example, you can create subclusters for specific use cases, such as ETL or query workloads, or you can create subclusters for different groups of users to isolate workloads. Within each subcluster, you can create individual resource pools to optimize resource allocation according to workload. See Managing subclusters for more information about how Vertica uses subclusters.
Global and subcluster-specific resource pools
You can define global resource pool allocations that affect all nodes in the database. You can also create resource pool allocations at the subcluster level. If you create both, the subcluster-level settings override the global settings.
Note
The GENERAL pool requires at least 25% of available memory to function properly. If you attempt to set MEMORYSIZE for a user-defined resource pool to more than 75%, Vertica returns an error.You can use this feature to remove global resource pools that the subcluster does not need. Additionally, you can create a resource pool with settings that are adequate for most subclusters, and then tailor the settings for specific subclusters as needed.
Optimizing ETL and query subclusters
Overriding resource pool settings at the subcluster level allows you to isolate built-in and user-defined resource pools and optimize them by workload. You often assign specific roles to different subclusters:
-
Subclusters dedicated to ETL workloads and DDL statements that alter the database.
-
Subclusters dedicated to running in-depth, long-running analytics queries. These queries need more resources allocated for the best performance.
-
Subclusters that run many short-running "dashboard" queries that you want to finish quickly and run in parallel.
After you define the type of queries executed by each subcluster, you can create a subcluster-specific resource pool that is optimized to improve efficiency for that workload.
The following scenario optimizes 3 subclusters by workload:
-
etl: A subcluster that performs ETL that you want to optimize for Tuple Mover operations.
-
dashboard: A subcluster that you want to designate for short-running queries executed by a large number of users to refresh a web page.
-
analytics: A subcluster that you want to designate for long-running queries.
See Best practices for managing workload resources for additional scenarios about resource pool tuning.
Configure an ETL subcluster to improve TM performance
Vertica chooses the subcluster that has the most ROS containers involved in a mergeout operation in its depot to execute a mergeout (see The Tuple Mover in Eon Mode Databases). Often, a subcluster performing ETL will be the best candidate to perform a mergeout because the data it loaded is involved in the mergeout. You can choose to improve the performance of mergeout operations on a subcluster by altering the TM pool's MAXCONCURRENCY setting to increase the number of threads available for mergeout operations. You cannot change this setting at the subcluster level, so you must set it globally:
=> ALTER RESOURCE POOL TM MAXCONCURRENCY 10;
See Tuning tuple mover pool settings for additional information about Tuple Mover resources.
Configure the dashboard query subcluster
By default, secondary subclusters have memory allocated to Tuple Mover resource pools. This pool setting allows Vertica to assign mergeout operations to the subcluster, which can add a small overhead. If you primarily use a secondary subcluster for queries, the best practice is to reclaim the memory used by the TM pool and prevent mergeout operations being assigned to the subcluster.
To optimize your dashboard query secondary subcluster, set their TM pool's MEMORYSIZE and MAXMEMORYSIZE settings to 0:
=> ALTER RESOURCE POOL TM FOR SUBCLUSTER dashboard MEMORYSIZE '0%'
   MAXMEMORYSIZE '0%';
Important
Do not set the TM pool's MEMORYSIZE and MAXMEMORYSIZE settings to 0 on primary subclusters. They must always be able to run the Tuple Mover.To confirm the overrides, query the SUBCLUSTER_RESOURCE_POOL_OVERRIDES table:
=> SELECT pool_oid, name, subcluster_name, memorysize, maxmemorysize
          FROM SUBCLUSTER_RESOURCE_POOL_OVERRIDES;

     pool_oid      | name | subcluster_name | memorysize | maxmemorysize
-------------------+------+-----------------+------------+---------------
 45035996273705046 | tm   | dashboard       | 0%         | 0%
(1 row)
To optimize the dashboard subcluster for short-running queries on a web page, create a dash_pool subcluster-level resource pool that uses 70% of the subcluster's memory. Additionally, increase PLANNEDCONCURRENCY to use all of the machine's logical cores, and limit EXECUTIONPARALLELISM to no more than half of the machine's available cores:
=> CREATE RESOURCE POOL dash_pool FOR SUBCLUSTER dashboard
     MEMORYSIZE '70%'
     PLANNEDCONCURRENCY 16
     EXECUTIONPARALLELISM 8;
Configure the analytic query subcluster
To optimize the analytics subcluster for long-running queries, create an analytics_pool subcluster-level resource pool that uses 60% of the subcluster's memory. In this scenario, you cannot allocate more memory to this pool because the nodes in this subcluster still have memory assigned to their TM pools. Additionally, set EXECUTIONPARALLELISM to AUTO to use all cores available on the node to process a query, and limit PLANNEDCONCURRENCY to no more than 8 concurrent queries:
=> CREATE RESOURCE POOL analytics_pool FOR SUBCLUSTER analytics
      MEMORYSIZE '60%'
      EXECUTIONPARALLELISM AUTO
      PLANNEDCONCURRENCY 8;
6.6 - Managing system resource usage
You can use the SQL Monitoring APIs (system tables) to track overall resource usage on your cluster.
You can use the Using system tables to track overall resource usage on your cluster. These and the other system tables are described in the Vertica system tables.
If your queries are experiencing errors due to resource unavailability, you can use the following system tables to obtain more details:
| System Table | Description |
|---|---|
| RESOURCE_REJECTIONS | Monitors requests for resources that are rejected by the Resource manager. |
| DISK_RESOURCE_REJECTIONS | Monitors requests for resources that are rejected due to disk space shortages. See Managing disk space for more information. |
When requests for resources of a certain type are being rejected, do one of the following:
-
Increase the resources available on the node by adding more memory, more disk space, and so on. See Managing disk space.
-
Reduce the demand for the resource by reducing the number of users on the system (see Managing sessions), rescheduling operations, and so on.
The LAST_REJECTED_VALUE field in RESOURCE_REJECTIONS indicates the cause of the problem. For example:
-
The message
Usage of a single requests exceeds high limitmeans that the system does not have enough of the resource available for the single request. A common example occurs when the file handle limit is set too low and you are loading a table with a large number of columns. -
The message
Timed out or Canceled waiting for resource reservationusually means that there is too much contention for the resource because the hardware platform cannot support the number of concurrent users using it.
6.6.1 - Managing sessions
Vertica provides several methods for database administrators to view and control sessions.
Vertica provides several methods for database administrators to view and control sessions. The methods vary according to the type of session:
-
External (user) sessions are initiated by vsql or programmatic (ODBC or JDBC) connections and have associated client state.
-
Internal (system) sessions are initiated by Vertica and have no client state.
Configuring maximum sessions
The maximum number of per-node user sessions is set by the configuration parameter MaxClientSessions parameter, by default 50. You can set MaxClientSessions parameter to any value between 0 and 1000. In addition to this maximum, Vertica also allows up to five administrative sessions per node.
For example:
=> ALTER DATABASE DEFAULT SET MaxClientSessions = 100;
Note
If you use the Administration Tools "Connect to Database" option, Vertica will attempt connections to other nodes if a local connection does not succeed. These cases can result in more successful "Connect to Database" commands than you would expect given theMaxClientSessions value.
Viewing sessions
The system table
SESSIONS contains detailed information about user sessions and returns one row per session. Superusers have unrestricted access to all database metadata. Access for other users varies according to their privileges.
Interrupting and closing sessions
You can interrupt a running statement with the Vertica function
INTERRUPT_STATEMENT. Interrupting a running statement returns a session to an idle state:
-
No statements or transactions are running.
-
No locks are held.
-
The database is doing no work on behalf of the session.
Closing a user session interrupts the session and disposes of all state related to the session, including client socket connections for the target sessions. The following Vertica functions close one or more user sessions:
SELECT statements that call these functions return after the interrupt or close message is delivered to all nodes. The function might return before Vertica completes execution of the interrupt or close operation. Thus, there might be a delay after the statement returns and the interrupt or close takes effect throughout the cluster. To determine if the session or transaction ended, query the SESSIONS system table.
In order to shut down a database, you must first close all user sessions. For more about database shutdown, see Stopping the database.
6.6.2 - Managing load streams
You can use system table LOAD_STREAMS to monitor data as it is loaded on your cluster.
You can use system table LOAD_STREAMS to monitor data as it is loaded on your cluster. Several columns in this table showmetrics for each load stream on each node, including the following:
| Column name | Value... |
|---|---|
ACCEPTED_ROW_COUNT |
Increases during parsing, up to the maximum number of rows in the input file. |
PARSE_COMPLETE_PERCENT |
Remains zero (0) until all named pipes return an EOF. While COPY awaits an EOF from multiple pipes, it can appear to be hung. However, before canceling the COPY statement, check your system CPU and disk accesses to determine if any activity is in progress. In a typical load, the |
SORT_COMPLETE_PERCENT |
Remains at 0 when loading from named pipes or STDIN. After PARSE_COMPLETE_PERCENT reaches 100 percent, SORT_COMPLETE_PERCENT increases to 100 percent. |
Depending on the data sizes, a significant lag can occur between the time PARSE_COMPLETE_PERCENT reaches 100 percent and the time SORT_COMPLETE_PERCENT begins to increase.
7 - HTTPS service
The HTTPS service lets clients securely access and manage a Vertica database with a REST API. This service listens on port 8443 and runs on all nodes.
Only the dbadmin user can authenticate to the HTTPS service.
This service encrypts communications with mutual TLS (mTLS). To configure mTLS, you must alter the server TLS configuration with a server certificate and a trusted Certificate Authority (CA). For mTLS authentication, each client request must include a certificate that is signed by the CA in the server TLS configuration and specifies the dbadmin user in the Common Name (CN). For additional details about these TLS components and Vertica, see TLS protocol.
Important
During installation, the install_vertica script generates self-signed certificates in the/opt/vertica/config/https_certs directory. Vertica uses these certificates to bootstrap the HTTPS service on a new cluster—they are not suitable for production. Certificates in the TLS configuration supersede those in the /opt/vertica/config/https_certs directory.
Password authentication
The following command connects to the HTTPS service from outside the cluster with the username and password:
$ curl --insecure --user dbadmin:db-password https://10.20.30.40:8443/endpoint
Important
Due to security concerns, this request method is not recommended. For example, the command history can save the dbadmin password.Certificate authentication
Client requests authenticate to the HTTPS service with a private key and certificate:
$ curl https://10.20.30.40:8443/endpoint \
    --key path/to/client_key.key \
    --cert path/to/client_cert.pem \
When the Vertica server receives the request, it verifies that the client certificate is signed by a trusted CA and specifies the dbadmin user. To establish this workflow, you must complete the following:
- Alter the
serverTLS configuration with a server certificate and a CA. - Generate a client certificate that is signed by the CA in the
serverTLS configuration. The client certificateSUBJECTmust specify the dbadmin user. - Grant TLS access to the database.
Note
To demonstrate a comprehensive setup, the following sections use a self-signed CA certificate that signs both the client and server certificates. In a production environment, you should replace the self-signed CA with a trusted CA.
For details about importing a CA certificate, see Generating TLS certificates and keys.
Create a CA certificate
Important
A self-signed CA certificate is convenient for development purposes, but you should always use a proper certificate authority in a production environment.A CA is a trusted entity that signs and validates other certificates with its own certificate. The following example generates a self-signed root CA certificate:
-
Generate or import a private key. The following command generates a new private key:
=> CREATE KEY ca_private_key TYPE 'RSA' LENGTH 4096; CREATE KEY -
Generate the certificate with the following format. Sign the certificate the with the private key that you generated or imported in the previous step:
=> CREATE CA CERTIFICATE ca_certificate
SUBJECT '/C=country_code/ST=state_or_province/L=locality/O=organization/OU=org_unit/CN=Vertica Root CA'
VALID FOR days_valid
EXTENSIONS 'authorityKeyIdentifier' = 'keyid:always,issuer', 'nsComment' = 'Vertica generated root CA cert'
KEY ca_private_key;
Note
The CA certificateSUBJECTmust be different from theSUBJECTof any certificate that it signs.For example:
=> CREATE CA CERTIFICATE SSCA_cert
SUBJECT '/C=US/ST=Massachusetts/L=Cambridge/O=OpenText/OU=Vertica/CN=Vertica Root CA'
VALID FOR 3650
EXTENSIONS 'nsComment' = 'Self-signed root CA cert'
KEY SSCA_key;
Create the server certificate
The server private key and certificate verify the Vertica server's identity for clients:
-
Generate the server private key:
=> CREATE KEY server_private_key TYPE 'RSA' LENGTH 2048; CREATE KEY -
Generate the server certificate with the following format. Include the server_private_key, and sign it with the CA certificate:
=> CREATE CERTIFICATE server_certificate SUBJECT '/C=country_code/ST=state_or_province/L=locality/O=organization/OU=org_unit/CN=Vertica server certificate' SIGNED BY ca_certificate KEY server_private_key; CREATE CERTIFICATE=> CREATE CERTIFICATE server_certificate SUBJECT '/C=US/ST=Massachusetts/L=Burlington/O=OpenText/OU=Vertica/CN=Vertica server certificate' SIGNED BY ca_certificate KEY server_private_key; CREATE CERTIFICATE
Alter the TLS configuration
After you generate the server certificate, you must alter the server's default TLS configuration with the server certificate and its CA. When you change the server TLS configuration, the HTTPS service restarts, and the new keys and certificates are added to the catalog and distributed to the nodes in the cluster:
-
Alter the default server configuration. Mutual TLS requires that you set
TLSMODEtoTRY_VERIFYorVERIFY_CA:=> ALTER TLS CONFIGURATION server CERTIFICATE server_certificate ADD CA CERTIFICATES ca_certificate TLSMODE 'VERIFY_CA'; -
Verify the changes on the TLS configuration object:
=> SELECT name, certificate, ca_certificate, mode FROM TLS_CONFIGURATIONS WHERE name='server';
  name  |    certificate     | ca_certificate |    mode
--------+--------------------+----------------+------------
 server | server_certificate | ca_certificate | VERIFY_CA
(1 row)
Create the client certificate
The client private key and certificate verify the client's identity for requests. Generate a client private key and a client certificate that specifies the dbadmin user, and sign the client certificate with the same CA that signed the server certificate.
The following steps generate a client key and certificate, and then make them available to the client:
-
Generate the client key:
=> CREATE KEY client_private_key TYPE 'RSA' LENGTH 2048; CREATE KEY -
Generate the client certificate. Mutual TLS requires that the Common Name (
CN) in theSUBJECTspecifies a database username:=> CREATE CERTIFICATE client_certificate SUBJECT '/C=US/ST=Massachusetts/L=Cambridge/O=OpenText/OU=Vertica/CN=dbadmin/emailAddress=example@example.com' SIGNED BY ca_certificate EXTENSIONS 'nsComment' = 'Vertica client cert', 'extendedKeyUsage' = 'clientAuth' KEY client_private_key; CREATE CERTIFICATE -
On the client machine, export the client key and client certificate to the client filesystem. The following commands use the vsql client:
$ vsql -At -c "SELECT key FROM cryptographic_keys WHERE name = 'client_private_key';" -o client_private_key.key
$ vsql -At -c "SELECT certificate_text FROM certificates WHERE name = 'client_certificate';" -o client_cert.pem
In the preceding command:
-A: enables unaligned output.-t: prevents the command from outputting metadata, such as column names.-c: instructs the shell to run one command and then exit.-o: writes the query output to the specified filename.
For details about all vsql command line options, see Command-line options
-
Copy or move the client key and certificate to a location that your client recognizes.
The following commands move the client key and certificate to the hidden directory
~/.client-creds, and then grants the file owner read and write permissions withchmod:$ mkdir ~/.client-creds $ mv client_private_key.key ~/.client-creds/client_key.key $ mv client_cert.pem ~/.client-creds/client_cert.pem $ chmod 600 ~/.client-creds/client_key.key ~/.client-creds/client_cert.pem
Create an authentication record
Next, you must create an authentication record in the database. An authentication record defines a set of authentication and the access methods for the database. You grant this record to a user or role to control how they authenticate to the database:
-
Create the authentication record. The
tlsmethod requires that clients authenticate with a certificate whose Common Name (CN) specifies a database username:=> CREATE AUTHENTICATION auth_record METHOD 'tls' HOST TLS '0.0.0.0/0'; CREATE AUTHENTICATION -
Grant the authentication record to a user or to a role. The following example grants the authentication record to PUBLIC, the default role for all users:
=> GRANT AUTHENTICATION auth_record TO PUBLIC;
GRANT AUTHENTICATION
After you grant the authentication record, the user or role can access HTTPS endpoints.
7.1 - HTTPS endpoints
The HTTPS service exposes general-purpose endpoints for interacting with your database.
/v1/metrics (GET)
Vertica exposes time series metrics for Prometheus monitoring and alerting. These metrics create a detailed model of your database behavior over time to provide valuable performance and troubleshooting insights.
Send a GET request to /v1/metrics:
$ curl https://host:8443/v1/metrics \
    --key path/to/client_key.key \
    --cert path/to/client_cert.pem \
Vertica scrapes metrics and outputs the metrics in Prometheus text-based exposition format. This format applies context-specific labels to each metric to help group metrics when you visualize your data. It also describes the metric type—Vertica provides counter, gauge, and histogram metric types. The following example outlines the output format:
# HELP metric-name metric-defintion
# TYPE metric-name metric-type
metric-name{label-key="label-value"[, ...]} metric-value
For example, the following example shows a snippet of the request response that provides details about the vertica_resource_pool_memory_size_actual_kb metric:
$ curl https://10.20.30.40:8443/v1/metrics \
    --key path/to/client_key.key \
    --cert path/to/client_cert.pem \
...
# HELP vertica_resource_pool_memory_size_actual_kb Current amount of memory (in kilobytes) allocated to the resource pool by the resource manager.
# TYPE vertica_resource_pool_memory_size_actual_kb gauge
vertica_resource_pool_memory_size_actual_kb{node_name="v_vmart_node0001",pool_name="metadata",revive_instance_id="114b25c4aab6fec8c26b121cff2b52"} 84381
vertica_resource_pool_memory_size_actual_kb{node_name="v_vmart_node0001",pool_name="blobdata",revive_instance_id="114b25c4aab6fec8c26b121cff2b52"} 0
vertica_resource_pool_memory_size_actual_kb{node_name="v_vmart_node0001",pool_name="jvm",revive_instance_id="114b25c4aab6fec8c26b121cff2b52"} 0
vertica_resource_pool_memory_size_actual_kb{node_name="v_vmart_node0001",pool_name="sysquery",revive_instance_id="114b25c4aab6fec8c26b121cff2b52"} 336970
vertica_resource_pool_memory_size_actual_kb{node_name="v_vmart_node0001",pool_name="tm",revive_instance_id="114b25c4aab6fec8c26b121cff2b52"} 336970
vertica_resource_pool_memory_size_actual_kb{node_name="v_vmart_node0001",pool_name="general",revive_instance_id="114b25c4aab6fec8c26b121cff2b52"} 5981079
vertica_resource_pool_memory_size_actual_kb{node_name="v_vmart_node0001",pool_name="recovery",revive_instance_id="114b25c4aab6fec8c26b121cff2b52"} 0
vertica_resource_pool_memory_size_actual_kb{node_name="v_vmart_node0001",pool_name="dbd",revive_instance_id="114b25c4aab6fec8c26b121cff2b52"} 0
vertica_resource_pool_memory_size_actual_kb{node_name="v_vmart_node0001",pool_name="refresh",revive_instance_id="114b25c4aab6fec8c26b121cff2b52"} 0
...
For a comprehensive list of metrics, see Prometheus metrics.
7.2 - Prometheus metrics
The following table describes the metrics available at https://host:8443/v1/metrics/.
| Name | Type | Description |
|---|---|---|
vertica_allocator_total_size_bytes |
gauge | Amount of bytes consumed in an allocator pool. |
vertica_build_info |
gauge | Shows information about the Vertica build through labels. |
vertica_data_size_compressed_mb |
gauge | Total compressed size (in megabytes) of the data. |
vertica_data_size_estimation_error_mb |
gauge | Margin of error (in megabytes) of the estimated raw data size. |
vertica_db_info |
gauge | Shows information about the current database through labels. |
vertica_depot_evictions_bytes |
counter | Total size (in bytes) of depot evictions. |
vertica_depot_evictions_total |
counter | Number of depot evictions. |
vertica_depot_fetch_queue_size |
gauge | Number of files in the depot's fetch queue. |
vertica_depot_fetches_bytes |
counter | Total size (in bytes) of successful depot fetches. |
vertica_depot_fetches_failures_total |
counter | Number of failed depot fetch requests. |
vertica_depot_fetches_ms |
histogram | Time (in milliseconds) that it takes to fetch files into the depot. |
vertica_depot_fetches_requests_total |
counter | Number of depot fetch requests. |
vertica_depot_lookup_hits_total |
counter | Number of cache hits when finding a file in the depot. |
vertica_depot_lookup_requests_total |
counter | Number of attempts to find a file in the depot. |
vertica_depot_max_size_bytes |
gauge | Maximum size (in bytes) of the depot. |
vertica_depot_size_bytes |
gauge | Number of bytes currently used in the depot. |
vertica_depot_uploads_bytes |
counter | Number of bytes uploaded to persistent storage. |
vertica_depot_uploads_failures_total |
counter | Number of failures during upload attempts to persistent storage. |
vertica_depot_uploads_in_progress_bytes |
gauge | Number of bytes in running requests that are uploading a file to persistent storage. |
vertica_depot_uploads_in_progress_counter |
gauge | Number of requests currently uploading a file to persistent storage. |
vertica_depot_uploads_ms |
histogram | Time (in milliseconds) it took to upload files to persistent storage. |
vertica_depot_uploads_queued_bytes |
gauge | Number of bytes in queued requests to upload a file to persistent storage. |
vertica_depot_uploads_queued_counter |
gauge | Number of queued requests to upload a file to persistent storage. |
vertica_depot_uploads_requests_total |
counter | Number of file upload attempts to persistent storage. |
vertica_depot_usage_percent |
gauge | Current size of the depot, expressed as a percentage of maximum depot size. |
vertica_disk_storage_free_mb |
gauge | Number of megabytes of free storage available. |
vertica_disk_storage_free_percent |
gauge | Amount of free storage available, expressed as a percentage of total disk storage. |
vertica_disk_storage_latency_seek_per_second |
gauge | Measures a storage location's performance in seeks/sec. 1/latency is the time that it takes to seek to the data. |
vertica_disk_storage_throughput_mb_per_second |
gauge | Measures a storage location's performance in MBps. 1/throughput is the time that it takes to read 1MB of data. |
vertica_disk_storage_total_mb |
gauge | Number of megabytes of total disk storage. |
vertica_disk_storage_used_mb |
gauge | Number of megabytes of disk storage in use. |
vertica_errors |
counter | Number of errors, by error level and error code. |
vertica_estimated_data_size_raw_mb |
gauge | Estimation (in megabytes) of the total raw data size. This is computed each time there is an audit. |
vertica_file_system_attempted_operations_total |
gauge | Number of attempted file system operations. |
vertica_file_system_data_reads_total |
gauge | Number of read operations, such as S3 GET requests, to download files. |
vertica_file_system_data_writes_total |
gauge | Number of write operations, such as S3 PUT requests, to upload files. |
vertica_file_system_downstream_bytes |
gauge | Number of bytes received. |
vertica_file_system_failed_operations_total |
gauge | Number of failed filesystem operations. |
vertica_file_system_metadata_reads_total |
gauge | Number of requests to read metadata. For example, S3 list bucket and HEAD requests are metadata reads. |
vertica_file_system_metadata_writes_total |
gauge | Number of requests to write metadata. For example, S3 POST and DELETE requests are metadata writes. |
vertica_file_system_open_files_counter |
gauge | Number of currently open files. |
vertica_file_system_reader_counter |
gauge | Number of currently running read operations. |
vertica_file_system_retries_total |
gauge | Number of retry events. |
vertica_file_system_upstream_bytes |
gauge | Number of bytes sent. |
vertica_file_system_writer_counter |
gauge | Number of currently running writer operations. |
vertica_is_readonly |
gauge | Returns whether the nodes are read-only. |
vertica_last_audit_end_time |
gauge | The time (in milliseconds) that the last audit ended. |
vertica_last_catalog_sync_seconds |
gauge | Number of seconds elapsed since the most recent catalog sync. |
vertica_license_node_count |
gauge | If the license limits the number of nodes, the number of nodes that the license allows. |
vertica_license_size_mb |
gauge | If the license limits the size of the database, the number of megabytes that license allows. |
vertica_locked_users |
gauge | Number of users that are locked out of their accounts. |
vertica_login_attempted_total |
counter | Number of login attempts. |
vertica_login_failure_total |
counter | Number of failed login attempts. |
vertica_login_success_total |
counter | Number of successful login attempts. |
vertica_planned_file_reads_bytes |
counter | Total number of bytes read in requests for files (estimated during query planning). |
vertica_planned_file_reads_requests_total |
counter | Total number of read requests for files (estimated during query planning). |
vertica_query_requests_attempted_total |
counter | Number of attempted query requests. |
vertica_query_requests_failed_total |
counter | Number of failed query requests. |
vertica_query_requests_processed_rows_total |
counter | Number of processed rows for each query type. |
vertica_query_requests_succeeded_total |
counter | Number of successful query requests. |
vertica_query_requests_time_ms |
histogram | Time (in milliseconds) that it takes to execute query requests in the resource pool. |
vertica_queued_requests_failed_reservation_total |
counter | Number of queued requests whose resource reservation failed in the resource pool. |
vertica_queued_requests_max_memory_kb |
gauge | Maximum memory requested for a single queued request in the resource pool. |
vertica_queued_requests_total |
gauge | Number of requests that are queued in the resource pool. |
vertica_queued_requests_total_memory_kb |
gauge | Total memory requested for all queued requests in the resource pool. |
vertica_queued_requests_wait_time_ms |
histogram | Length of time (in microseconds) that a resource pool queues queries. |
vertica_resource_pool_general_memory_borrowed_kb |
gauge | Amount of memory (in kilobytes) that running requests borrow from the GENERAL pool. |
vertica_resource_pool_max_concurrency |
gauge | MAXCONCURRENCY parameter setting for the resource pool. When set to -1, the resource pool can have an unlimited number of concurrent execution slots. When set to 0, queries are prevented from running in the pool. |
vertica_resource_pool_max_memory_size_kb |
gauge | MAXMEMORYSIZE parameter setting (in kilobytes) for the resource pool. |
vertica_resource_pool_max_query_memory_size_kb |
gauge | MAXQUERYMEMORYSIZE parameter setting (in kilobytes) for the resource pool. When set to -1, the resource pool borrows any amount of available memory from the GENERAL pool, up to vertica_resource_pool_max_memory_size_kb. |
vertica_resource_pool_memory_inuse_kb |
gauge | Amount of memory (in kilobytes) acquired by requests running against the resource pool. |
vertica_resource_pool_memory_size_actual_kb |
gauge | Current amount of memory (in kilobytes) allocated to the resource pool by the resource manager. |
vertica_resource_pool_planned_concurrency |
gauge | PLANNEDCONCURRENCY parameter setting for the resource pool. |
vertica_resource_pool_priority |
gauge | PRIORITY parameter setting for the resource pool. |
vertica_resource_pool_query_budget_kb |
gauge | Amount of resource pool memory (in kilobytes) that queries are currently tuned to use. When equal to -1, queries are prevented from running in the pool. |
vertica_resource_pool_queue_timeout |
gauge | QUEUETIMEOUT parameter setting for the resource pool. |
vertica_resource_pool_queueing_threshold_kb |
gauge | Limits the amount of memory (in kilobytes) that a resource pool makes available to all requests before it queues requests. |
vertica_resource_pool_running_query_count |
gauge | Number of queries currently executing in the pool. |
vertica_resource_pool_runtime_priority_threshold |
gauge | RUNTIMEPRIORITYTHRESHOLD parameter setting for the resource pool. |
vertica_sessions_blocked_counter |
gauge | Number of sessions that are blocked waiting for locks. |
vertica_sessions_running_counter |
gauge | Number of active sessions. |
vertica_storage_containers_count |
gauge | Total number of storage containers. |
vertica_subcluster_info |
gauge | Shows information about a subcluster through labels. |
vertica_total_nodes_count |
gauge | Total number of nodes. |
vertica_transactions_completed_total |
counter | Number of completed transactions. |
vertica_transactions_failed_total |
counter | Number of failed transactions. |
vertica_transactions_started_total |
counter | Number of transactions that have started. |
vertica_up_nodes_count |
gauge | Number of nodes that have Vertica running and can accept connections. |