Monitoring profiling progress
While loading profile data for a query, Management Console can provide updates about the query's progress and resources used.
To enable profiling progress updates, select the Enable Monitoring check box when profiling a query. See Viewing Profile Data in Management Console.
The default interval time is 60 seconds. At the specified interval, Management Console displays an updated view of the query's progress. Note that interval times of less than 60 seconds may slow down your query.
Viewing updated profile metrics
At every interval, Management Console displays a new set of profile metrics. You can view these metrics in Path Information view, Query Plan Drilldown view, or Tree view by clicking the respective view buttons on the left of the output box.
-
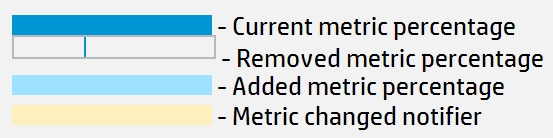
A dark blue bar indicates the current metric percentage.
-
When a metric bar has decreased, a dark blue line indicates the previous metric percentage.
-
When a metric bar has increased, a light blue bar indicates the added percentage. The previous percentage appears as a dark blue bar.
-
A metric bar highlighted in yellow indicates it has changed since the last interval.
-
A metric bar highlighted in red indicates the absolute value of the metric has decreased. This typically means Vertica reported the previous value incorrectly, and has readjusted. (For example, if Vertica previously reported path's Time value as 75 seconds, then reports it as 50 seconds at the next interval, the metric bar turns red to indicate the decrease in absolute Time value.)