Viewing different profile outputs
Vertica Management Console allows you to examine the results of your query profile in multiple views. You can view your profile in the following formats:
-
Path Information view
-
Query Drilldown view
-
Tree Path view
-
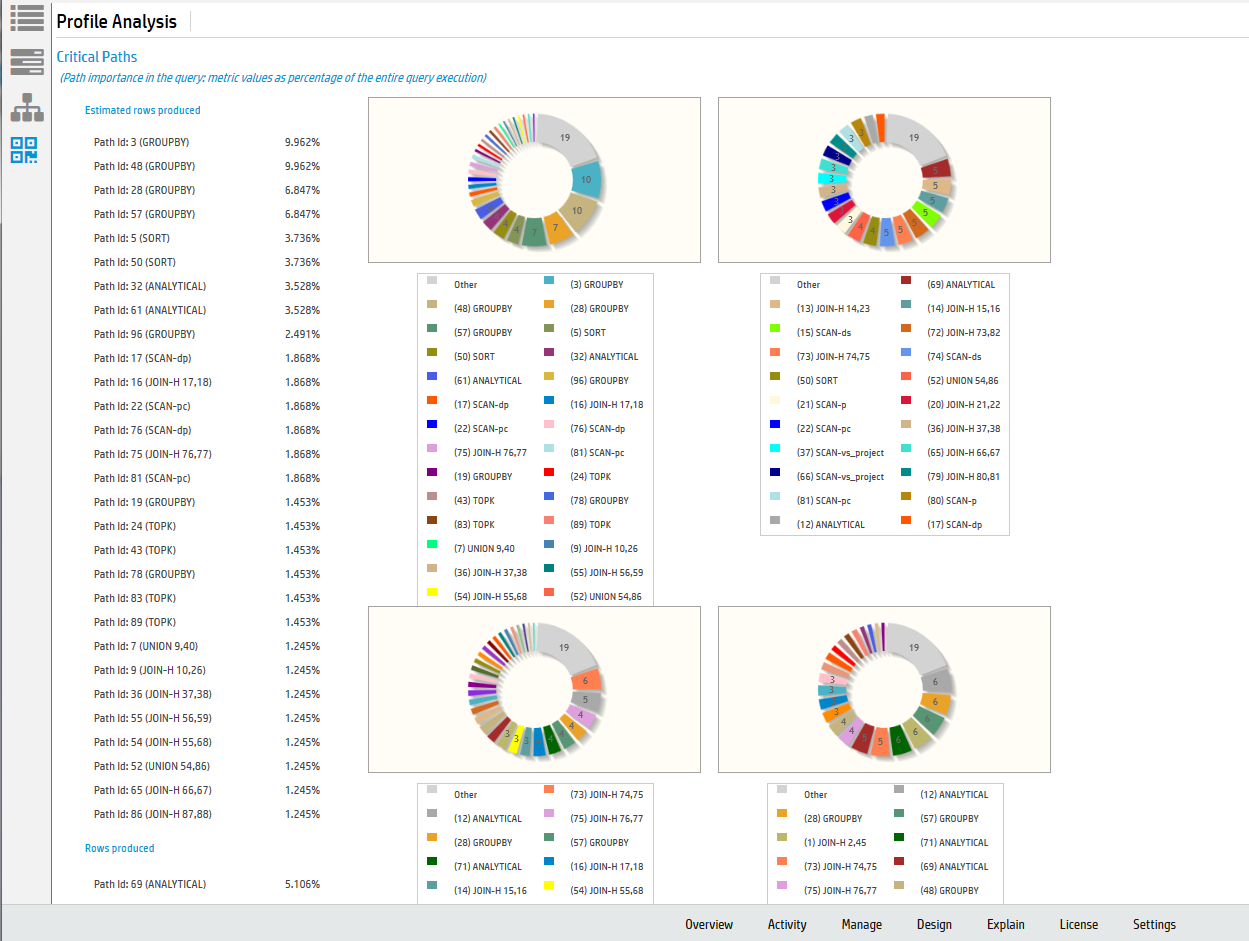
Profile Analysis view
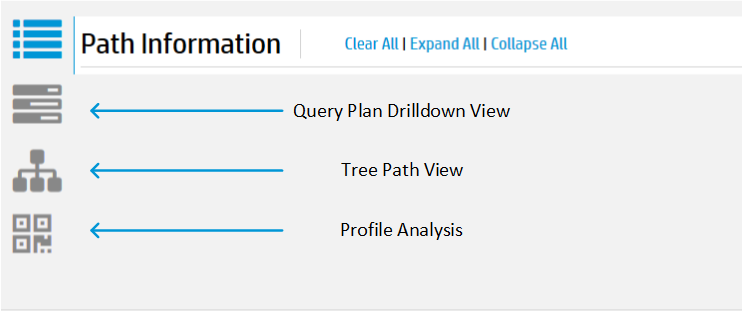
You can change the query profile output using the icons on the bottom portion of the Explain page.
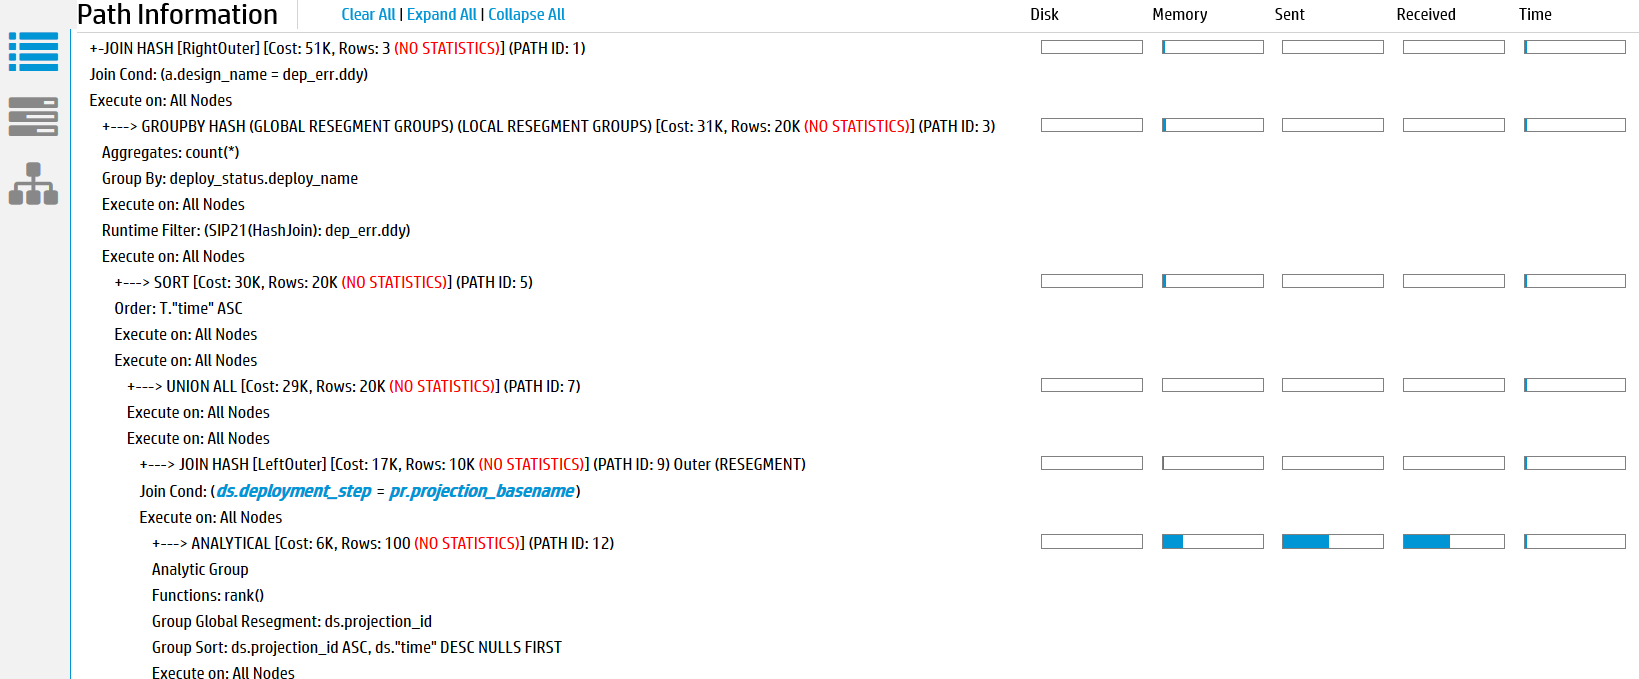
The Path Information view displays the query plan path along with metric data. If you enable profile monitoring, the data will update at the specified interval. To view metadata for a projection or a column, click the object name in the path output. A pop-up window displays the metadata if it is available.
The Query Plan Drilldown view shows detailed counter information at the node and operator level.
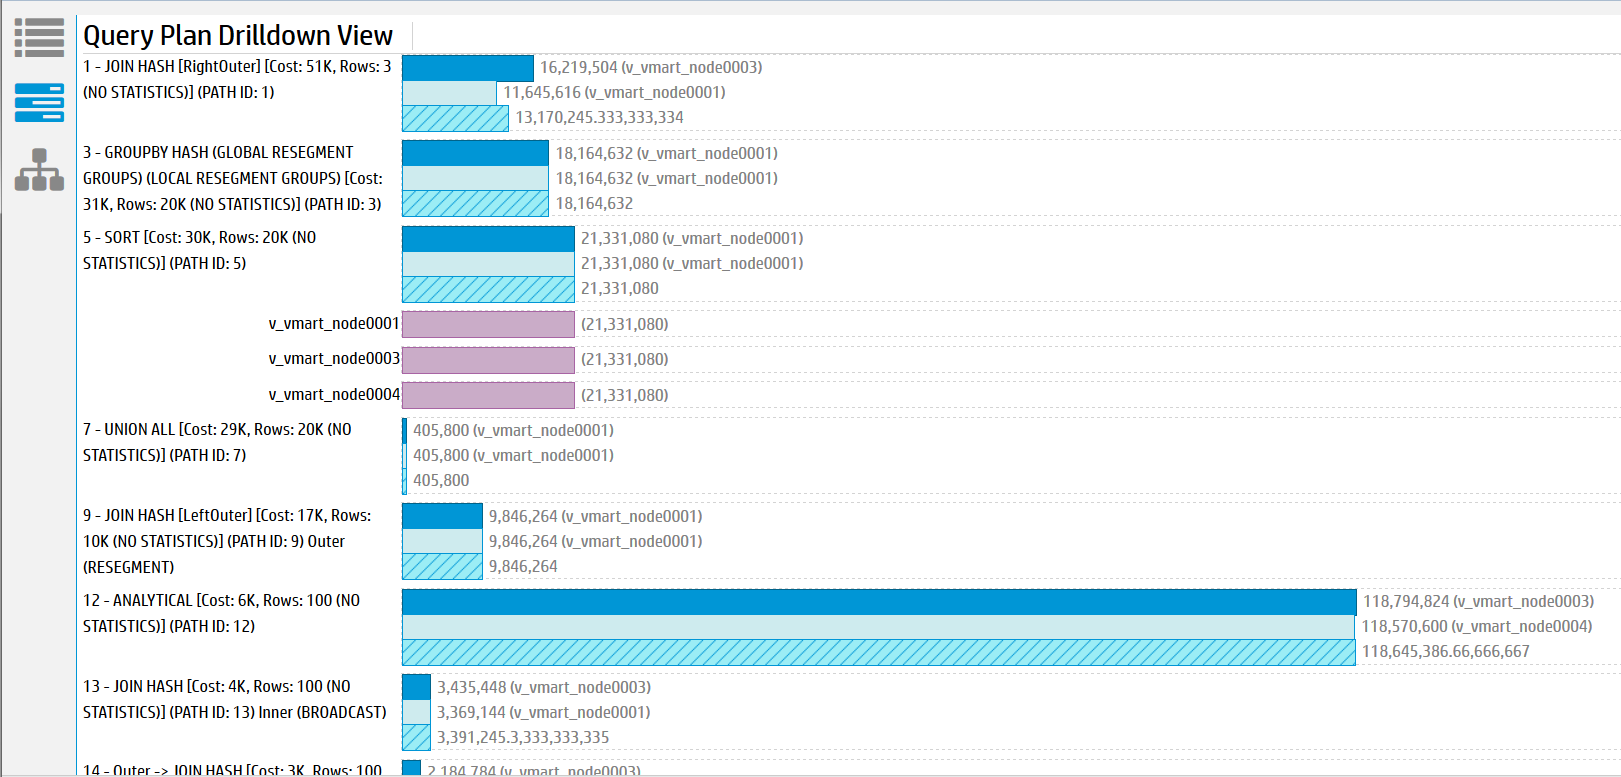
For each path, the path number is listed along with statistical information on the node and operator level. This view allows you to see which nodes are acting as outliers. Click on any of the bars to expand details for that node.
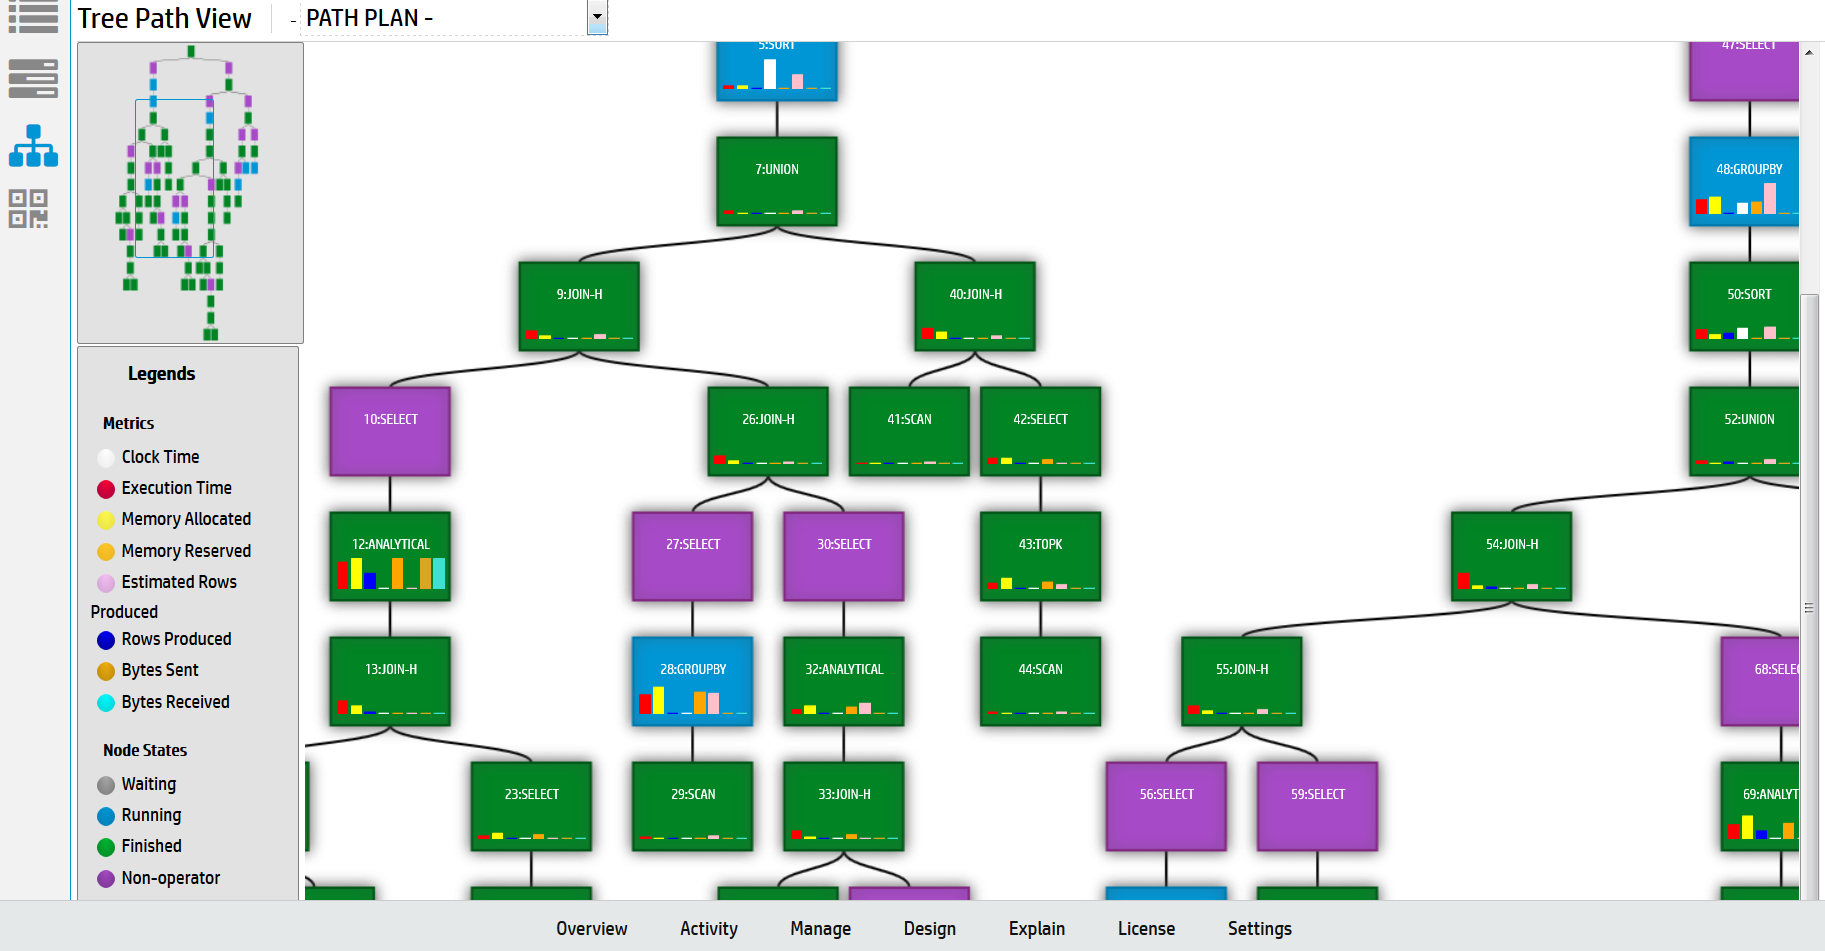
The Tree Path details the query plan in the form of a tree. If you enable monitoring, the state of the path blocks will change depending on whether the path is running, done, or has not started. Metric information is displayed in each path block for the counters you specified in the Profile Settings.
The Profile Analysis view allows you to identify any resource outliers. You can compare the estimated rows produced count with the actual rows produced count, view execution time per path, and identify memory usage per path.
When you profile a query, you will also see a pie chart detailing the query phase duration. You can also view projection metadata, execution events, and optimizer events by clicking on the respective buttons next to the pie chart.