This is the multi-page printable view of this section.
Click here to print.
Return to the regular view of this page.
Management Console
To get started using MC, see Getting Started with Management Console.
Management Console (MC) is the Vertica in-browser monitoring and management tool. Its graphical user interface provides a unified view of your Vertica database operations. Through user-friendly, step-by-step screens, you can create, configure, manage, and monitor your Vertica databases and their associated clusters. You can use MC to operate your Vertica database in Eon Mode or in Enterprise Mode. You can use MC to provision and deploy a Vertica Eon Mode database.
To get started using MC, see Getting started with MC.
What you can do with Management Console
Use Management Console to create:
-
A database cluster on hosts that do not have Vertica installed.
-
Multiple Vertica databases on one or more clusters from a single point of control.
-
MC users and grant them access to MC and databases managed by MC
Use Management Console to configure:
Use Management Console to monitor:
-
License usage and conformance.
-
Dynamic metrics about your database cluster.
-
Resource Pools.
-
User information and activity on MC.
-
Alerts by accessing a single message box of alerts for all managed databases.
-
Recent databases and clusters through a quick link.
-
Multiple Vertica databases on one or more clusters from a single point of control
You an import and export:
Management Console provides some, but not all, the functionality that Administration tools provides. Management Console also includes extended functionality not available in admintools. This additional functionality includes a graphical view of your Vertica database and detailed monitoring charts and graphs. See Administration Tools and Management Console for more information.
Getting Management Console
Download the Vertica server RPM and the MC package from myVertica Portal. You then have two options:
1 - Installing Management Console
Management Console (MC) is compatible with the latest supported versions of Vertica server.
Management Console (MC) 12.0.x is compatible with the latest supported versions of Vertica server. Read the following documents for more information:
Cloud installations
Vertica supports Management Console for both Enterprise Mode and Eon Mode on supported cloud providers.
Amazon Web Services
Deploy a Management Console instance on AWS with a CloudFormation Template (CFT). After you deploy the MC instance, you can provision an Eon Mode or Enterprise Mode database with AWS resources.
In some environments, you might automate custom MC deployments without the AWS CFT. To automate a custom MC, add the following properties to the /opt/vconsole/config/console.properties file:
vertica.database.mode = eon
cloud.authentication = IAM
mc.iaas = AWS
provisioning.service.enabled = true
Note
Set the cloud.authentication property only if you use IAM roles to authenticate requests. You do not need to set this property if you use access keys.
Additionally, complete the following to deploy custom MC instances:
Microsoft Azure
Deploy a Management Console instance from the Azure Marketplace. After you deploy the MC instance, you can provision an Eon Mode database, or monitor an Enterprise Mode database.
Deploy a Management Consoleinstance on GCP. After you deploy the MC instance, you can provision an Eon Mode database on GCP. For details, see Provision an Eon Mode cluster and database on GCP in MC.
Enterprise Mode or Eon Mode on-premises
Before you install Management Console, review the following hardware, software, and network requirements.
General requirements
-
Ports: Management Console has the following port requirements:
-
Port 22 is the default SSH port. The Create Cluster Wizard uses SSH on port 22 when you use MC to create a Vertica.
-
Port 5444 is the default agent port and must be available for MC-to-node and node-to-node communications.
-
Port 5450 is the default MC port and must be available for node-to-MC communications.
See Reserved ports for more information about port and firewall considerations.
-
Firewall: Make sure that a firewall or iptables are not blocking communications between the cluster's database, Management Console, and Management Console agents on each cluster node
-
IP Address: If you install MC on a server outside the Vertica cluster it will be monitoring, that server must be accessible to at least the public network interfaces on the cluster.
-
TLS Requirements: The Schannel package must be installed on your Linux environment so TLS can be set up during the MC configuration process. See TLS protocol.
-
File Permissions: On your local workstation, you must have at least read/write privileges on any files you plan to upload to MC through the Cluster Installation Wizard. These files include the Vertica server package, the license key (if needed), the private key file, and an optional CSV file of IP addresses.
-
Perl: The MC cluster installer requires Perl 5.
Hardware requirements
You can install MC on any node in the cluster, or its own dedicated node. When running the MC on a node in the cluster, note that MC shares RAM and time on CPU cores with other Vertica processes.
The following table provides minimum and recommended hardware requirements:
|
Requirements |
CPU |
RAM |
Disk Space |
|
Minimum |
4-core |
4G |
2G |
|
Recommended |
8-core |
8G |
2G |
See Disk Space Requirements for Vertica.
Time synchronization and MC's self-signed certificate
When you connect to MC through a client browser, Vertica assigns each HTTPS request a self-signed certificate, which includes a timestamp. To increase security and protect against password replay attacks, the timestamp is valid for several seconds only, after which it expires.
To avoid being blocked out of MC, synchronize time on the hosts in your Vertica cluster, and on the MC host if it resides on a dedicated server. To recover from loss or lack of synchronization, resync system time and the Network Time Protocol.
Installing Management Console
Install Management Console (MC) to manage a new cluster, or add it to an existing cluster.
-
Download the MC package from the Vertica website:
vertica-console-current-version.Linux-distro)
Save the package to a location on the target server, such as /tmp.
-
On the target server, log in as root or a user with sudo privileges.
-
Change to the directory where you saved the MC package.
-
Install MC using your local Linux distribution package management system—rpm, yum, zypper, apt, dpkg. For example:
Red Hat 8
# rpm -Uvh vertica-console-current-version.x86_64.rpm
Debian and Ubuntu
# dpkg -i vertica-console-current-version.deb
-
If you stopped the database before upgrading MC, restart the database.
As the root user, use the following command:
/etc/init.d/verticad start
For versions of Red Hat 8/CentOS 8 and above, run:
# systemctl start verticad
-
Open a browser and enter the URL of the MC installation, one of the following:
By default, mc-port is 5450.
If MC was not previously configured, the Configuration Wizard dialog box appears. Configuration steps are described in Configuring MC.
If MC was previously configured, Vertica prompts you to accept the end-user license agreement (EULA) when you first log in to MC after the upgrade.
Additionally, you can choose to provide Vertica with analytic information about your MC usage. For details, see Management Console settings.
2 - Management Console architecture
MC accepts HTTP requests from a client web browser, gathers information from the Vertica database cluster, and returns that information to the browser for monitoring.
MC accepts HTTP requests from a client web browser, gathers information from the Vertica database cluster, and returns that information to the browser for monitoring.
MC components
The primary components that drive Management Console are an application/web server and agents that get installed on each node in the Vertica cluster.
The following diagram is a logical representation of MC, the MC user's interface, and the database cluster nodes.
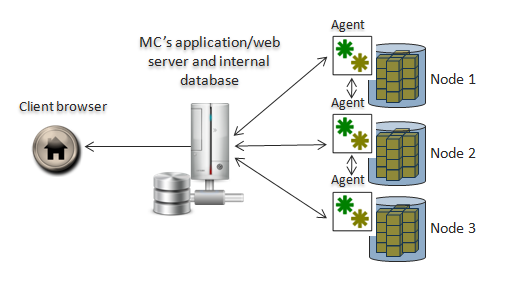
Application/web server
The application server hosts MC's web application and uses port 5450 for node-to-MC communication and to perform the following:
-
Manage one or more Vertica database clusters
-
Send rapid updates from MC to the web browser
-
Store and report MC metadata, such as alerts and events, current node state, and MC users, on a lightweight, embedded (Derby) database
-
Retain workload history
MC agents
MC agents are internal daemon process that run on each Vertica cluster node. The default agent port, 5444, must be available for MC-to-node and node-to-node communications. Agents monitor MC-managed Vertica database clusters and communicate with MC to provide the following functionality:
-
Provide local access, command, and control over database instances on a given node, using functionality similar to Administration Tools.
-
Report log-level data from the Administration Tools and Vertica log files.
-
Cache details from long-running jobs—such as create/start/stop database operations—that you can view through your browser.
-
Track changes to data-collection and monitoring utilities and communicate updates to MC .
-
Communicate between all cluster nodes and MC through a webhook subscription, which automates information sharing and reports on cluster-specific issues like node state, alerts,and events.
3 - Configuring Management Console
After you complete the steps in Installing [%=Vertica.MC%] (MC), you need to configure it through a client browser connection.
After you complete the steps in Installing Management Console (MC), you need to configure it through a client browser connection. An MC configuration assistant walks you through creating the Linux MC super administrator account, storage locations, and other settings that MC needs to run. Information you provide during the configuration process is stored in the /opt/vconsole/config/console.properties file.
If you need to change settings after the configuration assistant ends, such as port assignments, use the Home > MC Settings page.
-
Open a browser session.
-
Enter the IP address or host name of the server on which you installed MC and include the default MC port 5450. For example, enter the following using a IP address:
https://10.20.30.40:5450/
Or enter the following for a host name:
https://hostname:5450/
-
Follow the configuration assistant.
About authentication for the MC super administrator
In the final step of the configuration process, you choose an authentication method for the MC super administrator. You can decide to have MC authenticate the MC super and complete the process, or you can choose LDAP.
If you choose LDAP, provide the following information for the newly-created MC super administrator:
-
Corporate LDAP service host (IP address or host name).
-
LDAP server running port (default 389).
-
LDAP DN (distinguished name) for base search/lookup/authentication criteria. At a minimum, specify the dc (domain component) field. For example: dc=vertica, dc=com generates a unique identifier of the organization, like the corporate Web URL vertica.com
-
Default search path for the organization unit (ou). For example: ou=sales, ou=engineering.
-
Search attribute for the user name (uid), common name (cn), and so on. For example, uid=jdoe, cn=Jane Doe.
-
Binding DN and password for the MC super administrator.
-
In most cases, you provide the "Bind as administrator" fields, information used to establish the LDAP service connection for all LDAP operations, like search. Instead of using the administrator user name and password, the MC administrator could use his or her own LDAP credentials, as long as that user has search privileges.
If you choose bind anonymously
Unless you specifically configure the LDAP server to deny anonymous binds, the underlying LDAP protocol will not cause MC's Configure Authentication process to fail if you choose "Bind anonymously" for the MC administrator. Before you use anonymous bindings for LDAP authentication on MC, be sure that your LDAP server is configured to explicitly disable/enable this option. For more information, see the article on Infusion Technology Solutions and the OpenLDAP documentation on access control.
What happens next
Shortly after you click Finish, you should see a status in the browser. However, you might see only an empty page for several seconds. During this brief period, MC runs as the local user 'root' long enough to bind to port number 5450. Then MC switches to the MC super administrator account that you just created, restarts MC, and displays the MC login page.
Managing client connections
Each client session to MC uses a connection from MaxClientSessions, a database configuration parameter. This parameter determines the maximum number of sessions that can run on a single database cluster node. Sometimes multiple MC users, mapped to the same database account, are concurrently monitoring the Overview and Activity pages.
Tip
You can increase the value for
MaxClientSessions on an MC-monitored database to account for extra sessions. See
Managing sessions for details.
3.1 - Changing MC or agent ports
When you configure MC, the Configuration Wizard sets up the following default ports:.
When you configure MC, the Configuration Wizard sets up the following default ports:
-
5450—Used to connect a web browser session to MC and allows communication from Vertica cluster nodes to the MC application/web server
-
5444—Provides MC-to-node and node-to-node (agent) communications for database create/import and monitoring activities
If you need to change the MC default ports
A scenario might arise where you need to change the default port assignments for MC or its agents. For example, perhaps one of the default ports is not available on your Vertica cluster, or you encounter connection problems between MC and the agents. The following topics describe how to change port assignments for MC or its agents.
Changing the MC port
Use this procedure to change the default port for MC's application server from 5450 to a different value.
-
Open a web browser and connect to MC as a user with MC ADMIN privileges.
-
On the MC Home page, navigate to MC Settings > Configuration and change the Application server running port value from 5450 to a new value.
-
In the change-port dialog, click OK.
-
Restart MC.
-
Reconnect your browser session using the new port. For example, if you changed the port from 5450 to 5555, use one of the following formats:
https://00.00.00.00:5555/
OR
https://hostname:5555/
Changing the agent port
Changing the agent port takes place in two steps: at the command line, where you modify the config.py file and through a browser, where you modify MC settings.
Change the agent port in config.py
-
Log in as root on any cluster node and change to the agent directory:
$ cd /opt/vertica/oss/python3/lib/python3.9/site-packages/vertica/agent/
-
Use any text editor to open config.py.
-
Scroll down to the agent_port = 5444 entry and replace 5444 with a different port number.
-
Save and close the file.
-
Copy config.py to the /opt/vertica/oss/python3/lib/python3.9/site-packages/vertica/agent/ directory on all nodes in the cluster.
-
Restart the agent process by running the following command:
$ /etc/init.d/vertica_agent restart
Note
If you are using Red Hat Enterprise Linux/CentOS 7, use the following command instead:
$ /opt/vertica/sbin/vertica_agent restart
-
Repeat (as root) Step 6 on each cluster node where you copied the config.py file.
Change the agent port on MC
-
Open a web browser and connect to MC as a user with MC ADMIN privileges.
-
Navigate to MC Settings > Configuration.
-
Change Default Vertica agent port from 5444 to the new value you specified in the config.py file.
-
Click Apply and click Done.
-
Restart MC so MC can connect to the agent at its new port. See Restarting MC.
See also
3.2 - Management Console settings
The MC Settings page allows you to configure properties specific to Management Console.
The MC Settings page allows you to configure properties specific to Management Console. To access MC Settings, go to the Management Console home page > MC Tools > MC Settings.
MC configuration settings
The Configuration tab contains the following sections:
System User configurations
View the user name, user group, and user home path for the MC user.
Vertica database configurations
Edit the following database paths:
-
License path
-
Catalog path
-
Data path
MC and Agent Port settings
Configure the server port and the default port the Vertica agent uses.
Application Server JVM settings
Set the initial and maximum heap size for the JVM.
Browser connections settings
Enable and disable username and password auto-complete at Management Console login. After disabling, clear your browser's cache.
MC Password configuration settings
Set password requirements to log into the Management Console. This includes length, expiration, and login attempt settings.
User Analytics and Tracking
Choose if you want to provide Vertica with analytic information about your MC usage. Vertica uses this information to improve the MC in future releases.
Note
When you accept the End-User License Agreement Terms for the MC, you are given the option to provide Vertica with your anonymous user data. If you want to stop providing data, clear the checkbox in User Analytics and Tracking.
Vertica collects the following information:
-
Database type (Eon Mode or Enterprise Mode)
-
License type (Community Edition, Paid, By the Hour)
-
Cloud provider name
-
Vertica version
-
MC version
-
Current page
-
Interactions with MC page components, including buttons, drop-down lists, checkboxes, and radio buttons.
To protect your privacy, all collected information is stored and processed anonymously, and in compliance with GDPR regulations. It is stored securely on Vertica servers, and never shared with third-party organizations.
MC monitoring settings
Control the following monitoring settings in Management Console:
-
Enable checks and set alert thresholds for spread retransmit rate. This setting is disabled by default. The recommended alert threshold for spread retransmit rate is 10%.
-
Set alert thresholds for free Management Console disk space checks. The recommended alert threshold is 500 MB.
-
Exclude MC queries from activity charts.
-
Set refresh intervals for MC charts and pages.
MC security and authentication settings
MC user management settings
Create new Management Console users and, with their user credentials, map them to an database managed by Management ConsoleC on the Vertica server. See Creating an MC user and Managing MC users.
MC extended monitoring settings
Configure Extended monitoring, which allows you to monitor more long-term data in Management Console:
Other MC settings
Modifying database-specific settings
To inspect or modify settings related to a database managed by Management Console, go to the Existing Infrastructure page. On this page, select a running database to see its Overview page. From the bottom of the Overview page, click the Settings tab to make modifications to database-specific settings.
3.3 - Backing up MC
Before you upgrade MC, Vertica recommends that you back up your MC metadata (configuration and user settings). Use a storage location external to the server on which you installed MC.
-
On the target server (where you want to store MC metadata), log in as root or a user with sudo privileges.
-
Create a backup directory:
# mkdir /backups/mc/mc-backup-20130425
-
Copy the /opt/vconsole directory to the new backup folder:
# cp –ar /opt/vconsole /backups/mc/mc-backup-20130425
3.4 - Connecting securely from MC to a Vertica database
When you use MC to monitor and manage a Vertica database, MC (running in a browser) connects as the client to the Vertica database server.
When you use MC to monitor and manage a Vertica database, MC (running in a browser) connects as the client to the Vertica database server.
MC uses JDBC for most database connections
MC uses Java Database Connectivity (JDBC) for most connections to a Vertica database, including:
-
Retrieving database information to display in charts
-
Running SQL queries through JDBC
-
Configuring and updating database properties
-
Configuring the database for extended monitoring
Exception
When MC uses Agents to perform AdminTools tasks, MC does not use JDBC to connect to the database.
Vertica software supports TLS
Vertica databases and Vertica MC support TLS up to version 1.2. This topic and its subtopics describe configuring TLS in MC for JDBC connections to a Vertica database.
MC requires that all certificate and key files for upload to MC must be in PEM (Privacy-enhanced Electronic Mail) format.
Vertica database security dictates how MC connects
The TLS/SSL security you configure for a database in MC must be consistent with the security configured on the database itself.
Whether the Vertica database has TLS/SSL configured in server mode or mutual mode, you should configure TLS/SSL for that database in MC to match.
To find out how a Vertica database is configured, see Determining the TLS mode of a Vertica database.
You can configure TLS/SSL in either server mode or mutual mode in MC.
The rest of this topic and related topics use the term TLS, TLS/SSL, and SSL interchangeably.
TLS server mode
When the MC client connects to a Vertica database configured in server mode:
-
The client requests and verifies the server's credentials.
-
The client does not need to present a client certificate and private key file to the server.
-
The MC administrator must configure the CA certificate that can verify server's certificate on MC when MC connects to the database over JDBC.
TLS mutual mode
When the MC client connects to a Vertica database configured in mutual mode:
-
The MC client requests and verifies the database server's credentials.
-
The server also requests and verifies the MC client's credentials.
-
Each MC user is a separate client, and must present a valid client certificate file and private key file pair (keypair), namely a certificate signed by a CA recognized by the Vertica database server as valid.
-
The MC administrator must configure:
-
The CA certificate to verify the Vertica database server certificate.
-
A client certificate and private key file (keypair) for each MC user. The keypair can be unique for each user, or shared by multiple users, depending on how client authentication is configured on the Vertica database. See Configuring client authentication.
-
Each MC user must be configured to map correctly to a user who is configured on the Vertica database server.
For more information on how Vertica supports TLS/SSL security, see TLS protocol.
Only MC users having Admin or Super privileges on a database are able to configure TLS certificates and keys on MC for database connections. The topics in this section use "MC administrator" to refer to both of these roles. For more information about MC user roles and privileges, see Users in Management Console.
As the MC administrator, when you first configure security in MC for a Vertica database that requires mutual mode, you configure these certificates for the Vertica database:
-
The server certificate and public key of the database.
-
Your own client certificate and private key, as the first configured MC user mapped to a Vertica database user.
Configuring TLS/SSL on MC
MC provides the Certificates wizard for configuring TLS certificates for all JDBC connections to the database, to ensure those connections are secure.
In MC, there are three scenarios in which you need to configure TLS security for a Vertica database:
Adding certificates to MC for later use
You may want to add multiple CA certificates or client certificates to MC all at one time, to streamline the configuration of security when you are importing databases to MC or creating MC users. For details, see and .
To connect successfully, MC and database security must match
|
MC Security |
Vertica Database Security |
Does the connection succeed? |
|
None |
None |
Connection succeeds, and it is open and therefore unsecured. |
|
TLS server mode |
TLS server mode |
Connection succeeds provided MC can verify the server's certificate using the CA certificate configured on MC. |
|
TLS mutual mode |
TLS mutual mode |
Connection succeeds provided:
-
MC can verify the server's certificate using the CA certificate configured on MC.
-
The server can verify the client certificate and private key that MC presents as belonging to a mapped user on the Vertica database.
|
|
None |
TLS server mode |
MC attempts to establish an open connection. The connection fails if the Vertica database requires TLS for client connections. For more information, see:
|
|
None |
TLS mutual mode |
MC attempts to establish an open connection. The connection fails if the Vertica database requires TLS for client connections. The connection fails because MC does not present what the database requires: a valid client certificate and private key that the database can verify as belonging to a mapped database user. |
|
TLS server mode |
None |
MC attempts to connect to the database securely, however the connection fails as the database is not configured with TLS certificates. |
|
TLS mutual mode |
None |
MC attempts to connect to the database securely, however the connection fails as the database is not configured with TLS certificates. |
3.4.1 - Management Console security
The Management Console (MC) manages multiple Vertica clusters, all of which might have different levels and types of security, such as user names and passwords and LDAP authentication.
The Management Console (MC) manages multiple Vertica clusters, all of which might have different levels and types of security, such as user names and passwords and LDAP authentication. You can also manage MC users who have varying levels of access across these components.
Open authorization and SSL
Management Console (MC) uses a combination of OAuth (Open Authorization), Secure Socket Layer (SSL), and locally-encrypted passwords to secure HTTPS requests between a user's browser and MC, and between MC and the agents. Authentication occurs through MC and between agents within the cluster. Agents also authenticate and authorize jobs.
The MC configuration process sets up SSL automatically, but you must have the openssl package installed on your Linux environment first.
See the following topics for more information:
User authentication and access
MC provides two user authentication methods, LDAP or MC. You can use only one method at a time. For example, if you chose LDAP, all MC users will be authenticated against your organization's LDAP server.
You set up LDAP authentication up through MC Settings > Authentication on the MC interface.
Note
MC uses LDAP data for authentication purposes only. It does not modify user information in the LDAP repository.
The MC authentication method stores MC user information internally and encrypts passwords. These MC users are not system (Linux) users. They are accounts that have access to MC and, optionally, to one or more MC-managed Vertica databases through the MC interface.
Management Console also has rules for what users can see when they sign in to MC from a client browser. These rules are governed by access levels, each of which is made up of a set of roles.
See also
3.4.2 - Determining the TLS mode of a Vertica database
When you configure Vertica for TLS through the Management Console, you must configure the security mode to match what the Vertica database is configured to require: server mode or mutual mode.
When you configure Vertica for TLS through the Management Console, you must configure the security mode to match what the Vertica database is configured to require: server mode or mutual mode.
To determine the TLS mode for existing sessions, query the SESSIONS system table:
=> SELECT session_id, user_name, ssl_state FROM sessions;
           session_id            | user_name | ssl_state
---------------------------------+-----------+-----------
 v_vmart_node0001-333611:0x1ab   | dbadmin   | mutual
To determine the Vertica database's client-server TLS configuration, query the TLS_CONFIGURATIONS system table for the "server":
=> SELECT name, certificate, ca_certificates, mode FROM tls_configurations WHERE name = 'server';
  name  |   certificate    |   ca_certificates   |   mode
--------+------------------+---------------------+-----------
 server | server_cert      | ca_cert,ica_cert    | VERIFY_CA
(1 row)
The "mode" can be one of the following, in ascending security:
-
DISABLE: Disables TLS. All other options for this parameter enable TLS.
-
ENABLE: Enables TLS. Vertica does not check client certificates.
-
TRY_VERIFY: Establishes a TLS connection if one of the following is true:
If the other host presents an invalid certificate, the connection will use plaintext.
-
VERIFY_CA: Connection succeeds if Vertica verifies that the other host's certificate is from a trusted CA. If the other host does not present a certificate, the connection uses plaintext.
-
VERIFY_FULL: Connection succeeds if Vertica verifies that the other host's certificate is from a trusted CA and the certificate's cn (Common Name) or subjectAltName attribute matches the hostname or IP address of the other host.
Note that for client certificates, cn is used for the username, so subjectAltName must match the hostname or IP address of the other host.
Mutual mode corresponds to TRY_VERIFY or higher, which indicates that Vertica is in mutual mode. In mutual mode, Vertica sends its server certificate to the client for verification, and uses the CA certificates (in this case, "ca_cert" and "ica_cert") to verify client certificates.
In contrast, a server mode configuration (which doesn't verify client certificates) might have the following TLS configuration instead:
=> SELECT name, certificate, ca_certificates, mode FROM tls_configurations WHERE name = 'server';
  name  |   certificate    |   ca_certificates   |   mode
--------+------------------+---------------------+-----------
 server | server_cert      |                     | ENABLE
(1 row)
3.4.3 - Configuring TLS while importing a database on MC
To configure TLS as you are importing an existing Vertica database on MC:.
To configure TLS as you are importing an existing Vertica database on MC:
-
Follow the steps in Importing an existing database into MC.
-
In the Import Vertica window, select the database and click the Use TLS checkbox.
-
Click Configure TLS and Import DB to launch and complete the Certificates wizard.
MC certificates wizard
The MC Certificates wizard lets you configure a CA certificate for the Vertica database server and client certificates for MC to allow secure TLS communication over the JDBC connections between MC and the Vertica database server. Each screen presents options. When you select an option, the wizard displays additional options and details.
-
The first wizard screen provides helpful overview information. Read it, and click Configure TLS Certificates to continue.
-
On the Configure CA Certificates screen, configure a CA certificate (public key) to add to MC. MC uses this trusted certificate to verify the server's identity during TLS communications over JDBC connections between MC and the Vertica database server.
Complete one of these options:
-
Upload a new CA certificate Browse and select the certificate file and enter an alias for this certificate
-
To add another CA certificate, click Add More CA Certificates.
-
Continue adding additional CA certificates until you are finished.
-
Choose a certificate alias from previously uploaded certificates Select the alias for the previously uploaded CA certificate you wish to configure for the current database.
-
When you are done adding CA certificates, click Next.
-
The Configure Client Certificate screen displays the check box Add Client Certificate and Private Key for Mutual Mode TLS Connection.
-
If the database is configured for server mode, you do not need a client certificate or key.
-
If the database is configured for mutual mode:
-
Complete the detail fields for the client certificate and private key option you have chosen above, then click Next.
-
The Apply TLS configuration to MC users mapped to database window allows you to configure the client certificate-key pair you have just entered, for use by multiple MC users.
Note
All the MC users you select must be mapped to the same user id on the Vertica database server.
-
Click Review. The wizard displays a review window with the TLS options you have configured.
-
Select one of these options:
-
To modify your TLS choices, click Back.
-
To confirm your choices:
-
If you are importing a database, click Configure TLS and Import DB.
-
If you are configuring TLS for a database already imported to MC, click Configure TLS for DB.
-
Click Close to complete the wizard.
-
To close the wizard without importing the database and without setting up TLS configuration, click Cancel.
3.4.4 - MC certificates wizard
The MC Certificates wizard lets you configure a CA certificate for the Vertica database server and client certificates for MC to allow secure TLS communication over the JDBC connections between MC and the Vertica database server.
The MC Certificates wizard lets you configure a CA certificate for the Vertica database server and client certificates for MC to allow secure TLS communication over the JDBC connections between MC and the Vertica database server. Each screen presents options. When you select an option, the wizard displays additional options and details.
-
The first wizard screen provides helpful overview information. Read it, and click Configure TLS Certificates to continue.
-
On the Configure CA Certificates screen, configure a CA certificate (public key) to add to MC. MC uses this trusted certificate to verify the server's identity during TLS communications over JDBC connections between MC and the Vertica database server.
Complete one of these options:
-
Upload a new CA certificate Browse and select the certificate file and enter an alias for this certificate
-
To add another CA certificate, click Add More CA Certificates.
-
Continue adding additional CA certificates until you are finished.
-
Choose a certificate alias from previously uploaded certificates Select the alias for the previously uploaded CA certificate you wish to configure for the current database.
-
When you are done adding CA certificates, click Next.
-
The Configure Client Certificate screen displays the check box Add Client Certificate and Private Key for Mutual Mode TLS Connection.
-
If the database is configured for server mode, you do not need a client certificate or key.
-
If the database is configured for mutual mode:
-
Complete the detail fields for the client certificate and private key option you have chosen above, then click Next.
-
The Apply TLS configuration to MC users mapped to database window allows you to configure the client certificate-key pair you have just entered, for use by multiple MC users.
Note
All the MC users you select must be mapped to the same user id on the Vertica database server.
-
Click Review. The wizard displays a review window with the TLS options you have configured.
-
Select one of these options:
-
To modify your TLS choices, click Back.
-
To confirm your choices:
-
If you are importing a database, click Configure TLS and Import DB.
-
If you are configuring TLS for a database already imported to MC, click Configure TLS for DB.
-
Click Close to complete the wizard.
-
To close the wizard without importing the database and without setting up TLS configuration, click Cancel.
3.4.5 - Configuring TLS for a monitored database in MC
This procedure describes how to configure TLS for all JDBC connections to a database that is already being monitored in MC.
This procedure describes how to configure TLS for all JDBC connections to a database that is already being monitored in MC. Note that the Vertica database should already be configured with the TLS certificates required for TLS connections.
-
In MC, navigate to Databases and Clusters > DB-name > Settings and click the Security tab in the left navigation bar.
-
In the Configure TLS Connection for Database section, click Enabled in the drop-down beside Use TLS Connection to database.
-
Click Configure TLS Connection to launch and complete the Certificates wizard.
MC certificates wizard
The MC Certificates wizard lets you configure a CA certificate for the Vertica database server and client certificates for MC to allow secure TLS communication over the JDBC connections between MC and the Vertica database server. Each screen presents options. When you select an option, the wizard displays additional options and details.
-
The first wizard screen provides helpful overview information. Read it, and click Configure TLS Certificates to continue.
-
On the Configure CA Certificates screen, configure a CA certificate (public key) to add to MC. MC uses this trusted certificate to verify the server's identity during TLS communications over JDBC connections between MC and the Vertica database server.
Complete one of these options:
-
Upload a new CA certificate Browse and select the certificate file and enter an alias for this certificate
-
To add another CA certificate, click Add More CA Certificates.
-
Continue adding additional CA certificates until you are finished.
-
Choose a certificate alias from previously uploaded certificates Select the alias for the previously uploaded CA certificate you wish to configure for the current database.
-
When you are done adding CA certificates, click Next.
-
The Configure Client Certificate screen displays the check box Add Client Certificate and Private Key for Mutual Mode TLS Connection.
-
If the database is configured for server mode, you do not need a client certificate or key.
-
If the database is configured for mutual mode:
-
Complete the detail fields for the client certificate and private key option you have chosen above, then click Next.
-
The Apply TLS configuration to MC users mapped to database window allows you to configure the client certificate-key pair you have just entered, for use by multiple MC users.
Note
All the MC users you select must be mapped to the same user id on the Vertica database server.
-
Click Review. The wizard displays a review window with the TLS options you have configured.
-
Select one of these options:
-
To modify your TLS choices, click Back.
-
To confirm your choices:
-
If you are importing a database, click Configure TLS and Import DB.
-
If you are configuring TLS for a database already imported to MC, click Configure TLS for DB.
-
Click Close to complete the wizard.
-
To close the wizard without importing the database and without setting up TLS configuration, click Cancel.
3.4.6 - Configuring mutual TLS for MC users
You can configure TLS for existing MC users who are already mapped to Vertica database user ids.
You can configure TLS for existing MC users who are already mapped to Vertica database user ids. You would do so if you had just configured TLS in mutual mode on a previously unsecured Vertica database, and needed to configure a client certificate and private key for each MC user who accesses that database.
-
In MC, navigate to MC Settings and click the User Management tab.
-
Select a user from the list and click Edit.
-
In the Add permissions window:
-
Choose the database for which you want to edit this MC user's security permissions.
-
MC displays the database username to which this MC user is currently mapped.
-
In the Restrict Access drop-down, choose Admin, Associate, IT, or User to specify the privilege level for this user.
-
In the Use TLS Connection drop-down, choose Yes.
-
Click Configure TLS for user to launch and complete the Certificates wizard.
MC certificates wizard
The MC Certificates wizard lets you configure a CA certificate for the Vertica database server and client certificates for MC to allow secure TLS communication over the JDBC connections between MC and the Vertica database server. Each screen presents options. When you select an option, the wizard displays additional options and details.
-
The first wizard screen provides helpful overview information. Read it, and click Configure TLS Certificates to continue.
-
On the Configure CA Certificates screen, configure a CA certificate (public key) to add to MC. MC uses this trusted certificate to verify the server's identity during TLS communications over JDBC connections between MC and the Vertica database server.
Complete one of these options:
-
Upload a new CA certificate Browse and select the certificate file and enter an alias for this certificate
-
To add another CA certificate, click Add More CA Certificates.
-
Continue adding additional CA certificates until you are finished.
-
Choose a certificate alias from previously uploaded certificates Select the alias for the previously uploaded CA certificate you wish to configure for the current database.
-
When you are done adding CA certificates, click Next.
-
The Configure Client Certificate screen displays the check box Add Client Certificate and Private Key for Mutual Mode TLS Connection.
-
If the database is configured for server mode, you do not need a client certificate or key.
-
If the database is configured for mutual mode:
-
Complete the detail fields for the client certificate and private key option you have chosen above, then click Next.
-
The Apply TLS configuration to MC users mapped to database window allows you to configure the client certificate-key pair you have just entered, for use by multiple MC users.
Note
All the MC users you select must be mapped to the same user id on the Vertica database server.
-
Click Review. The wizard displays a review window with the TLS options you have configured.
-
Select one of these options:
-
To modify your TLS choices, click Back.
-
To confirm your choices:
-
If you are importing a database, click Configure TLS and Import DB.
-
If you are configuring TLS for a database already imported to MC, click Configure TLS for DB.
-
Click Close to complete the wizard.
-
To close the wizard without importing the database and without setting up TLS configuration, click Cancel.
3.4.7 - Updating TLS security for MC connections
Maintaining TLS security for MC JDBC connections to a Vertica database is an ongoing process.
Maintaining TLS security for MC JDBC connections to a Vertica database is an ongoing process. Initially, you as the MC administrator must configure the appropriate certificates and keys. As time passes, certificates expire or otherwise become invalid. To maintain TLS security in MC, you must configure new certificates to replace any that are about to expire.
If any of the certificates that secure an MC connection to a Vertica database changes or expires, the MC administrator must update the TLS configuration for that database on MC to ensure that unexpired certificates are available so that connections can succeed.
MC flags the current certificate for a given connection with a "use me" bit. This bit is set only for the current certificate. When you configure a new certificate for a given connection, the new certificate is marked current, and the previous certificate (although still present in the trust store or keystore) is no longer marked as the current certificate.
3.4.8 - Enabling or disabling TLS for a database in MC
To enable TLS for all JDBC connections from MC to a Vertica database, configure the certificate and key appropriate for that connection.
To enable TLS for all JDBC connections from MC to a Vertica database, configure the certificate and key appropriate for that connection. See:
Disabling a TLS connection
Under some conditions, you as the system administrator might need to disable TLS for JDBC connections from MC to a Vertica database. Here are some examples:
-
The TLS certificates are expired and you have not yet obtained new certificates.
-
The TLS certificates and keys are revoked and the user does not have new certificates and keys, but you still want to allow that user to connect from MC to the database to show monitoring information and run queries.
To disable TLS for connecting to a Vertica database:
-
In MC, navigate to Home > Databases and Clusters > DatabaseName > Settings.
-
Click the Security tab in the left navigation bar.
-
In the Use TLS Connection to database drop-down, choose Disabled.
Note
To reenable TLS for a database connection after you disable it, you must reconfigure the necessary certificates.
Disabling TLS for a database removes the configuration that tells MC to use the current certificates and keys for a given database, for all users. If it is a mutual mode TLS connection and each user had a separate client certificate and private key configured for that database, to re-enable TLS you must reconfigure the certificate and key for each user individually, for that database.
Re-enabling a disabled TLS connection
-
In MC, navigate to Home > Databases and Clusters > DatabaseName > Settings.
-
Click the Security tab in the left navigation bar.
-
In the Use TLS Connection to database drop-down, choose Enabled.
-
MC displays Configure MC to use secured connection to query Vertica database or modify existing configuration.
-
To finish re-enabling TLS, click Configure TLS Connection to launch the Certificates Wizard.
-
Complete the MC certificates wizard.
3.4.9 - Adding TLS certificates in MC
You can add one or more certificates to MC for later use, without immediately associating the certificates with a database.
You can add one or more certificates to MC for later use, without immediately associating the certificates with a database. Adding certificates ahead of time makes it easier to configure security for a database or for one or more MC users, because you can just choose a CA or client certificate from a list rather than having to add it to MC during the configuration steps.
Adding CA certificates in MC
To add one or more CA certificates in MC:
-
From the MC home page, navigate to MC Settings > SSL/TLS Certificates.
-
Under Manage TLS Certificates for Database Connection, click Add New CA Certificate.
-
In the Add new CA certificates for TLS connection window, enter an alias for the certificate, to make it easier to refer to later.
-
Click Browse to locate the certficate file you want to add. MC opens an Explorer window.
-
Select the file you want to upload, and click Open.
Note
Make sure the certificate file is unexpired, and is not protected by a password.
-
To add just this one certificate, click Add New CA. MC adds the certificate to its list.
-
To add additional CA certificates, click Add More CA Certificates. MC adds the certificate to a list, and clears the fields so you can enter the next CA certificate.
-
Repeat the process until you have entered the last certificate you want to add.
-
Click Add New CA to add all the CA certificates in the list to the MC:
Adding client certificates and keys in MC
You can add one or more client certificate and private key pairs to MC. In each pair, you can add either a single certificate, a preexisting certificate chain, or a series of client certificates that MC uses to create a new certificate chain.
To add one or more client certificates with their private key files to MC for later use:
-
Navigate to Home > MC Settings > SSL/TLS Certificates.
-
Under Manage TLS Certificates for Database Connection, click Add New Client Certificate. MC displays the Add new Client Certificate and Private Key for TLS Connection screen.
Note
When you add a client certificate to MC, you always add it with its private key file. The client certificate and its key are a key pair.
-
Click one of these file upload options:
- Upload Client Certificate and Private Key for TLS Connection. With this option, you paste a certificate and key into browser fields. MC posts the certificate and key from your browser to the MC server via an https connection over the network, secured with TLS/SSL.
- Manually upload Client Certificate and Private Key on MC host and provide paths. Sending the certificates from your browser to the MC server across an https network connection may not be not your preference. If so, you can use this option to specify the paths on the MC server host where you have manually uploaded the client certificate and private key files, instead. The URL of your MC browser shows the IP address of the MC host. Using this option, you must manually handle the transfer of the certificate and the key files to the server.
-
To provide a single client certificate and private key with either input option:
-
Enter a recognizable alias for the key pair.
-
Browse and select the private key file or provide the path.
-
Browse and select the client certificate file or provide the path.
-
Click Add New Client Certificate.
-
MC adds the key pair to its list.
-
To upload several certificates and private keys and create a certificate chain:
-
Enter an alias for the key pair.
-
Browse and select the private key file or provide the path.
-
Browse and select the client certificate file or provide the path.
-
Click Add Certificate to Chain (or Add More Certificate Paths).
-
Repeat the process until you have added the last certificate and key for this certificate chain.
-
Click Add New Client Certificate.
-
MC adds the resulting certificate chain to its list.
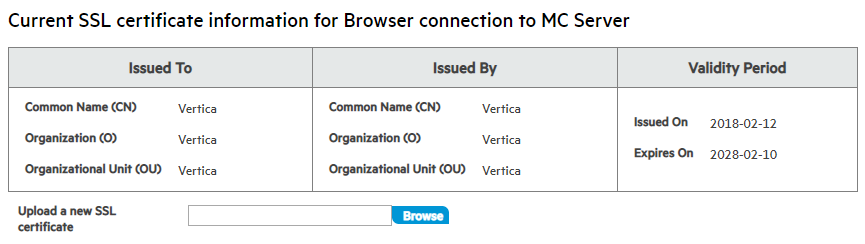
Adding a new certificate for the browser connection
You can view the existing TLS certificate for the browser connection to the MC server, or add a new certificate to replace it.
To view or replace the current SSL/TLS certificate that MC uses for the user's browser's HTTPS connection to the MC server:
-
From the MC home page, navigate to MC Settings > SSL/TLS Certificates.
The top pane displays the current certificate for the browser connection to the MC server, including the certificate's expiration date:
-
To replace the current certificate, click Browse next to the Upload a new SSL certificate field.
MC opens an explorer window.
-
Select the certificate file you wish to upload and click Open. The certificate file must be in PEM (Privacy-enhanced Email Message) format.
MC replaces the prior certificate with the new certificate.
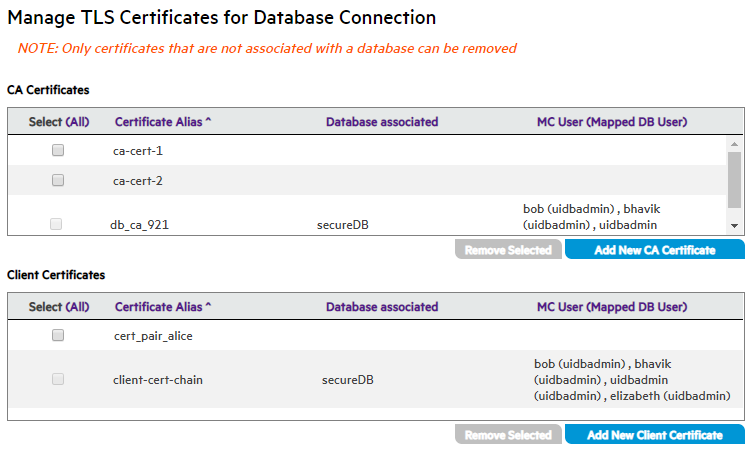
3.4.10 - Managing TLS certificates in MC
MC maintains a secure list containing all the CA certificates, and the client certificates or certificate chains and their corresponding key files, that you have uploaded into MC.
MC maintains a secure list containing all the CA certificates, and the client certificates or certificate chains and their corresponding key files, that you have uploaded into MC.
To manage the certificates already uploaded to MC, navigate to Home > MC Settings > SSL/TLS Certificates. This screen controls the TLS security settings for all of MC.
The top pane displays information about the current TLS certificate used to secure the user's browser connection to the MC server. You can add a new certificate to replace it. See .
The middle and lower panes allow you to add and remove CA and client certificates in MC.
You can perform the following tasks to manage your TLS certificates and keys in MC.
For the security settings for a specific database, open the database in MC and navigate to Home > Databases and Clusters > DatabaseName > Settings and click the Security tab in the left navigation bar.
3.4.11 - Updating a TLS certificate in MC
When a TLS certificate is about to expire, has already expired, or otherwise becomes unusable, it needs to be updated.
When a TLS certificate is about to expire, has already expired, or otherwise becomes unusable, it needs to be updated.
This is the method for updating a certificate:
-
In MC, add the new certificate that will replace the expiring or invalid certificate. See Adding TLS certificates in MC.
Note
You can add and configure the new certificate for the database or user whose existing certificate is or will soon be invalid, as a single step, or two steps. Configuring the new certificate for the database dissociates the previously configured certificate from that database. See
Connecting securely from MC to a Vertica database.
-
After the old certificate has been disassociated from all databases and users, you can remove it from the MC. See Removing TLS certificates from MC.
3.4.12 - Removing TLS certificates from MC
In some cases, it may be appropriate to disable TLS for a database in MC.
In some cases, it may be appropriate to disable TLS for a database in MC. Disabling TLS for the database disassociates all the certificates configured for that database. For more information, see Enabling or disabling TLS for a database in MC.
Disassociating a certificate from a database in MC
Before you can remove a certificate from MC, you must be sure the certificate is not associated with (being used by) any databases. The MC administrator can disassociate a certificate from a database in MC using either of these methods:
Configuring a new certificate on the database in MC
When you configure a new certificate to serve a specific purpose on a database in MC, the new certificate replaces the old certificate. The newly configured certificate is now associated with the database, and the old certificate is no longer associated and can be removed.
Navigate to Databases and Clusters > DbName > Database Settings > Configure TLS.
For details, see Configuring TLS for a monitored database in MC
Removing the TLS configuration on the database
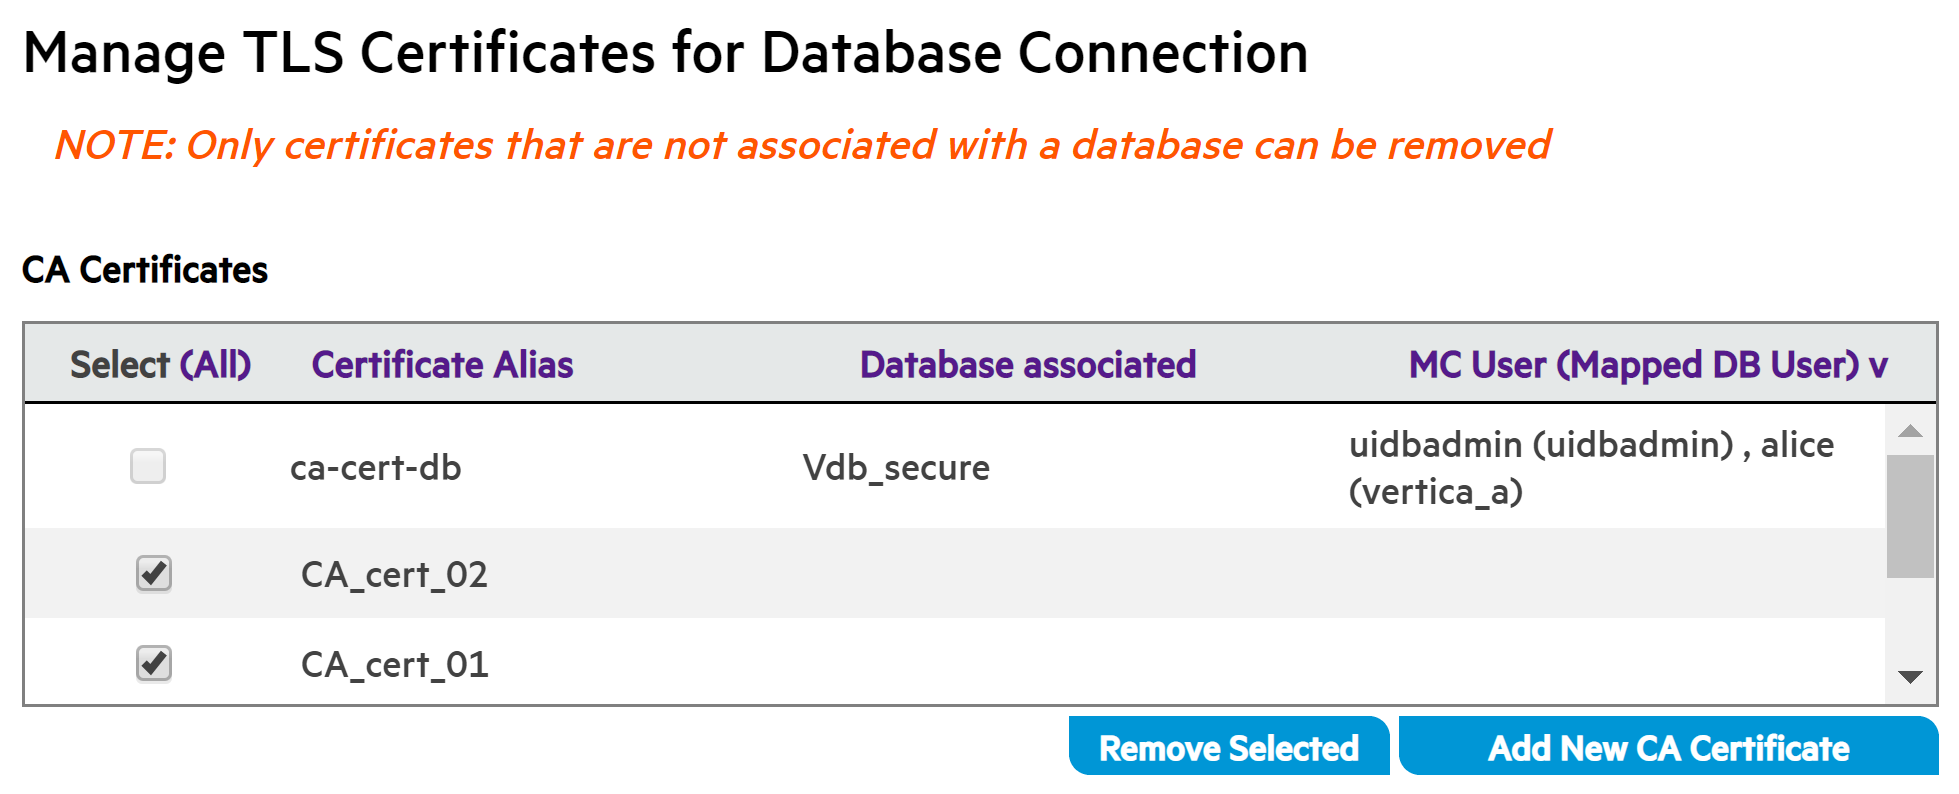
You can remove one or more TLS certificates from the MC, provided the certificates are not associated with a database. To remove a certificate:
-
From the MC home page, navigate to MC Settings > SSL/TLS Certificates.
-
In the Manage TLS Certificates for Database Connection section, locate the row or rows for one or more CA or client certificates you want to remove. This example shows only the CA Certificates pane:
-
If the Database associated field is empty for that certificate, you can click to select the certificate for removal, and click Remove Selected. In the illustration above, CA_cert_02 and CA_cert_01 are selected for removal.
Note
If you remove one client certificate that is part of a certificate chain, MC removes the entire certificate chain.
3.4.14 - Bulk-configure a group of MC users for TLS
You as the MC administrator can create multiple MC users and map them all to the same database user id on the Vertica database server side.
You as the MC administrator can create multiple MC users and map them all to the same database user id on the Vertica database server side. You map the users in MC when you create them. For details, see Creating an MC user.
You can then configure all the MC users that are mapped to a single Vertica database user id, to use the same client certificate or certificate chain and private key in MC, in a single bulk configuration process:
-
Navigate to MC Home > Databases and Clusters > DbName> Settings > Security.
-
Click Configure TLS Connection to launch the MC certificates wizard.
-
Complete steps 1 through 3 in the wizard to configure a CA certificate and the client certificate or certificate chain and key that you want to use for multiple MC users. For details, see MC certificates wizard.
-
After you complete these steps, the wizard displays the Apply TLS configuration to MC users mapped to database page as step 4 in the left wizard pane.
-
To apply the same CA certificate, client certificate and key you just configured to one or more additional users, click the check boxes for those users.
Note
All the users you select must be mapped to the same Vertica database user id.
-
To complete the configuration, click Review. MC displays a confirmation screen:
-
To complete the configuration of this CA certificate for the database and this client certificate/key pair for the selected MC users, click Configure TLS for DB.
-
MC confirms that the action was a success. Click Close to close the Certificate wizard.
3.5 - Upgrading Management Console manually
If you installed MC manually, follow the procedure below to upgrade MC.
If you installed MC manually, follow the procedure below to upgrade MC.
If you installed MC automatically on AWS resources, see Upgrading MC automatically on AWS.
Backing up MC before you upgrade
-
Log in as root or a user with sudo privileges on the server where MC is already installed.
-
Open a terminal window and shut down the MC process:
# /etc/init.d/vertica-consoled stop
For versions of Red Hat 7/CentOS 7 and above, use:
# systemctl stop vertica-consoled
-
Back up MC to preserve configuration metadata.
Important
A full backup is required in order to restore MC to its previous state. Restoring MC is essential if the upgrade fails, or you decide to revert to the previous version of Vertica. For details, see
Backing up MC.
-
Stop the database if MC was installed on an Ubuntu or Debian platform.
Extended monitoring upgrade recommendations
If you use Extended monitoring to monitor a database with MC, Vertica recommends the following upgrade procedure to avoid data loss.
-
Log in to MC as an administrator.
-
To stop the monitored database, navigate to the Existing Infrastructure > Databases and Clusters page, select the monitored database and click Stop.
-
On MC Settings > MC Storage DB Setup, click Disable Streaming to stop the storage database's collection of monitoring data.
-
To stop the storage database, navigate to the Existing Infrastructure > Databases and Clusters page, select the monitored database and click Stop.
-
Upgrade MC and Vertica according to Upgrade MC and Upgrading Vertica instructions.
-
To start the storage database, navigate to the Existing Infrastructure > Databases and Clusters page, select the monitored database and click Start.
-
Start the monitored database.
-
On MC Settings > MC Storage DB Setup, click Enable Streaming to enable collection of monitoring data.
Important
To avoid data loss, enable streaming soon after starting your monitored database. While your storage database is down and streaming is disabled, the Kafka server can retain data from your running monitored database for a limited amount of time. Data loss occurs when the data exceeds the Kafka retention policy's log size or retention time limits.
Upgrading MC
Note
After you upgrade, you are prompted to set up security questions and select a new password.
-
Download the MC package from the Vertica website:
vertica-console-current-version.Linux-distro)
Save the package to a location on the target server, such as /tmp.
-
On the target server, log in as root or a user with sudo privileges.
-
Change to the directory where you saved the MC package.
-
Install MC using your local Linux distribution package management system—rpm, yum, zypper, apt, dpkg. For example:
Red Hat 8
# rpm -Uvh vertica-console-current-version.x86_64.rpm
Debian and Ubuntu
# dpkg -i vertica-console-current-version.deb
-
If you stopped the database before upgrading MC, restart the database.
As the root user, use the following command:
/etc/init.d/verticad start
For versions of Red Hat 8/CentOS 8 and above, run:
# systemctl start verticad
-
Open a browser and enter the URL of the MC installation, one of the following:
By default, mc-port is 5450.
If MC was not previously configured, the Configuration Wizard dialog box appears. Configuration steps are described in Configuring MC.
If MC was previously configured, Vertica prompts you to accept the end-user license agreement (EULA) when you first log in to MC after the upgrade.
Additionally, you can choose to provide Vertica with analytic information about your MC usage. For details, see Management Console settings.
3.6 - Upgrading MC automatically on AWS
If you automatically installed Management Console (MC) version 9.1.1 or later on AWS resources, you can automatically upgrade it from the MC interface using the Upgrade wizard.
If you automatically installed Management Console (MC) version 9.1.1 or later on AWS resources, you can automatically upgrade it from the MC interface using the Upgrade wizard.
This process provisions a new Management Console instance and copies any current MC configuration data to the new MC. All MC settings, users, and monitored clusters will be transferred.
After upgrading, you can terminate the previous Management Console instance.
In addition, when you revive an Eon Mode database through the upgraded Management Console, that database will also be automatically upgraded to the same Vertica version as MC.
Upgrade MC automatically
Automatic upgrade is only available if the existing MC has been installed automatically through the AWS Marketplace.
-
From the MC home page, select MC Settings.
-
From the menu on the left side of the page, select Upgrade MC. The Upgrade MC page displays current Management Console information and indicates whether you are using the latest version of MC, or if a newer version is available.
-
Click Start MC Upgrade at the bottom of the page (this button is only displayed if a newer version of MC is available). The Upgrade wizard appears.
-
Go through the wizard and enter the following information when prompted:
-
AWS access key ID and AWS secret key (only required if existing MC was not installed using an IAM role)
-
AWS key pair
-
MC version to upgrade to
-
EC2 instance type for new MC host
-
EC2 instance tags (optional)
-
When upgrade is successful, the wizard displays the URL for the upgraded Management Console. Save this URL; this how to access your new MC. It is important to save this URL for future use; after you terminate your previous MC, the new MC URL will not be available elsewhere. (The MC URL referenced from the original stack when you created MC will continue to reference the previous MC, not the new MC.)
-
Follow the URL and log into your new MC.
-
To terminate the previous version of MC:
-
If necessary, disable termination protection for the previous MC instance. You can do so from the AWS console. See the AWS guide for enabling and disabling instance termination protection.
-
From the AWS console, terminate the instance on which the previous MC resides. See the AWS guide for how to terminate instances.
Note
Do not delete other associated resources for the previous MC. Some of these resources may still be in use by the new MC, or by any clusters that were created using the previous MC.
Next steps
If you plan to upgrade an Eon Mode database from Vertica version 9.1.0 or above to a later version, you can do so automatically by reviving it through a newer version of Management Console. As MC revives the database, it will also upgrade the Eon Mode database to the same Vertica version as the upgraded MC. See Reviving an Eon Mode database on AWS in MC.
3.7 - Localizing user interface text
You can translate Management Console (MC) user interface (UI) text with language files in the Vertica server.
You can translate Management Console (MC) user interface (UI) text with language files in the Vertica server. After you translate the UI text, users can select the language from the language selector, a dropdown located to the right of the username in the MC toolbar.
The required language files include the locales.json file and the resource bundle, a directory of JSON-formatted files that contain the text strings translated into the target language.
Language files are located in the /opt/vconsole/temp/webapp/resources/i18n/lang directory.
locales.json
The locales.json file contains an array of JSON objects with a name key and properties, where each object represents a language that the MC supports. For example, the following object represents Mexican Spanish:
"es_MX": {
    "code": "es_MX",
    "name": "Spanish - Mexico",
    "country_code": "MX"
}
The preceding object provides the following information that you use to translate UI text:
-
The object name key is a two- or four-letter country code. In the preceding example, the name key is es_MX. The resource bundle name must match this country code, or the MC cannot detect the translation files.
-
The MC lists the name value in the language selector. If you translated the UI text into Mexican Spanish, the language selector would list Spanish - Mexico.
Resource bundle
The resource bundle is a directory in /opt/vconsole/temp/webapp/resources/i18n/lang that stores a collection of JSON-formatted files that contain the UI text strings that you can translate. By default, Vertica provides the following resource bundles:
Creating a custom resource bundle
Important
Custom resource bundles are not preserved when you upgrade Management Console versions. Before you upgrade, you must back up your resource files when you back up your Management Console configuration.
For details, see Upgrading Management Console manually.
To create a resource bundle, you must manually create a new directory and copy files from one of the default resource bundles. For example, to create a resource bundle for Mexican Spanish:
-
Navigate to the directory that contains the language files:
$ cd /opt/vconsole/temp/webapp/resources/i18n/lang
-
Create a new directory named es_MX:
$ mkdir es_MX
Note
If the name of a resource bundle does not exactly match a name key in locales.json, the MC cannot detect the translation, and the translated language is not available in the language selector.
-
Copy all files from the default en_US resource bundle into the new es_MX resource bundle:
$ cp en_US/* es_MX
Text string file structure
Each JSON file in the resource bundle contains text strings for a specific section of the MC interface. For example, the homepage.json file stores text strings for the Management Console home page. Each JSON file represents MC pages and any child UI components that contain text—including subsections, tabs, and buttons—as individual objects. The file nests these pages and child components hierarchically to convey the page structure. For example, the homepage.json file uses the following structure:
{
    "homepage": {
        ...
      },
      "recentDatabase": {
        ...
      },
      "copyright": {
        ...
      },
      ...
The object properties represent the UI text as key/value pairs, where the key is the component with UI text, and the value is the text string that the MC displays in the UI.
Translating text
To translate a text string, edit the text string value. For example, to translate the title of the Recent Databases section into Spanish, open the homepage.json file in a text editor and update homepage.recentDatabase.title value:
{
    "homepage": {
        ...
        },
        "recentDatabase": {
          "title": "Bases de Datos Recientes",
          ...
}
4 - Getting started with MC
Use Management Console to monitor the performance of your Vertica clusters.
Use Management Console to monitor the performance of your Vertica clusters. This tool provides a graphical view of your Vertica database cluster, nodes, network status, and detailed monitoring charts and graphs.
MC allows you to:
-
Create, import, and connect to Vertica databases.
-
Manage your Vertica database and clusters.
-
Receive and view messages regarding the health and performance of your Vertica database and clusters.
-
View diagnostics and support information for Management Console.
-
Manage application and user settings for Management Console.
MC installation process
To install MC, complete these tasks:
-
Follow the steps listed in Installing Management Console.
-
After you have installed MC, configure it according to the instructions in Configuring Management Console.
4.1 - Connecting to MC
To connect to Management Console:.
To connect to Management Console:
-
Open a supported web browser.
-
Enter the IP address or host name of the host on which you installed MC (or any cluster node if you installed Vertica first), followed by the MC port you assigned when you configured MC. For example:
Enter the IP address and port:
https://10.20.30.40:5450/
Enter the host name and port:
https://hostname:5450/
-
When the MC logon dialog appears, enter your MC username and password and click Log in.
Note
When MC users log in to the MC interface, MC checks their privileges on Vertica
Data collector (DC) tables on MC-monitored databases. Based on DC table privileges, along with the role assigned the MC user, each user's access to the MC's Overview, Activity and Node details pages could be limited. See
Users, roles, and privileges for more information.
If you do not have an MC username/password, contact your MC administrator.
Managing client connections
Each client session to MC uses a connection from MaxClientSessions, a database configuration parameter. This parameter determines the maximum number of sessions that can run on a single database cluster node. Sometimes multiple MC users, mapped to the same database account, are concurrently monitoring the Overview and Activity pages.
Tip
You can increase the value for
MaxClientSessions on an MC-monitored database to account for extra sessions. See
Managing sessions for details.
4.2 - Management Console home page
After you connect to MC and sign in, the Home page displays.
After you connect to MC and sign in, the Home page displays. This page is the entry point to all Vertica database clusters and users managed by MC. Information on this page, as well as throughout the MC interface, will appear or be hidden, based on the permissions (access levels) of the user who is logged in. The following image is what an MC super administrator sees.
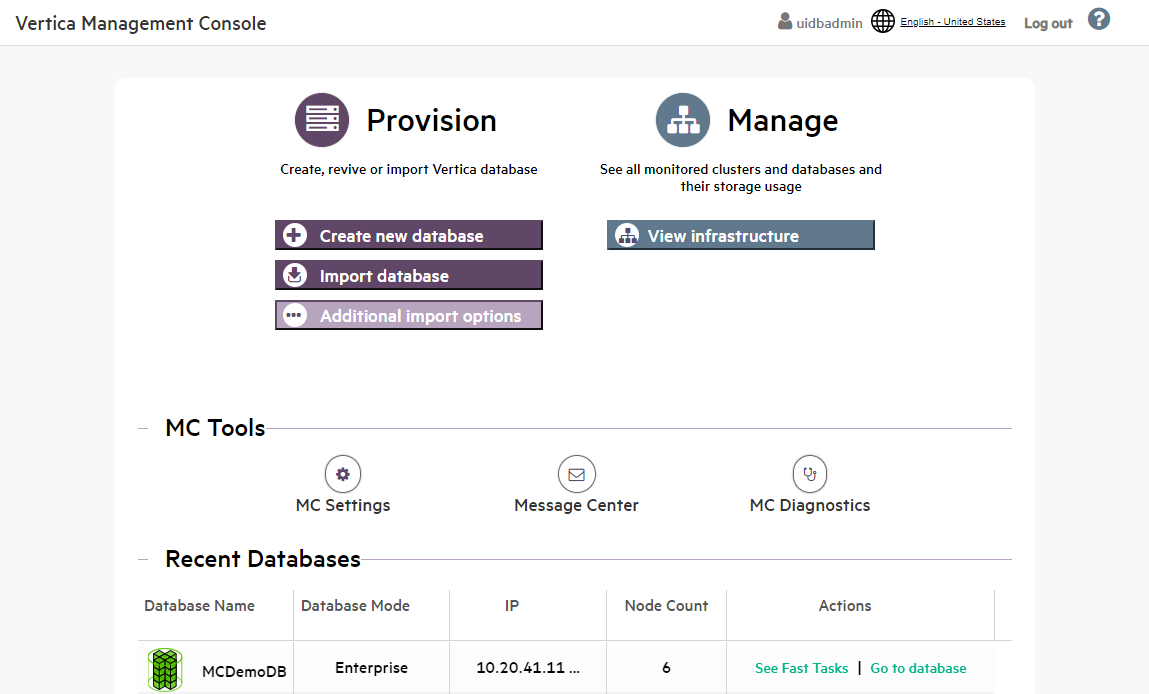
Operations you can perform in Management Console are grouped into the following areas:
-
Provision. Create new Vertica databases, or import existing ones to manage and monitor with MC. You can also import a Vertica cluster that resides in a Hadoop environment. See Managing database clusters.
-
Manage. View all the clusters and databases monitored by MC, stop and remove databases, and view details about databases and clusters. See Viewing cluster infrastructure.
-
MC Settings. Configure MC and user settings, as well as use the MC interface to install Vertica on a cluster of hosts. See Management Console settings.
-
Message Center. View, sort, and search database messages and optionally export messages to a file. See
Monitoring Database Messages in MC.
-
MC Diagnostics. View and resolve MC-related issues, as well as browse Vertica agent and audit logs. See Troubleshooting with MC diagnostics.
Recent databases
The Recent Databases section displays all databases that you created on or imported into MC. An empty space under Recent Databases means that you have not yet created or imported a database into the MC interface, or do not have permission to view any databases managed by MC.
Recent Databases lists each database name, its number of nodes, and two actions: Fast Tasks and Go to Database.
Fast tasks
Fast Tasks are key tasks you can perform on that database using MC. The Fast Tasks page provides the following options:
-
Manage and View Your Vertica Database. See the monitoring dashboard for your database. Explore the tabs below your dashboard, which provide more ways to manage the database.
-
Connect to your Vertica Database Using SQL. Use Management Console to run SQL queries on your database from within your browser.
-
Load Your Data into Vertica Database. The Data Load Activity page allows you to monitor and perform data loading jobs. To load data from an S3 bucket into pre-existing tables in your database, select the Instance tab and click New S3 Data Load.
If you installed Management Console with Provisioning through the AWS Marketplace, you had the option to install a database pre-loaded with example clickstream analytic data. If you did so, the Fast Tasks page lists two additional links:
-
Play with Example Data in Your Vertica Database (PDF). This PDF guide provides instructions and example SQL queries you can use in Vertica to analyze the example data.
-
Vertica Workbook for Tableau (PDF). This PDF guide provides instructions on how to analyze the example data pre-loaded into Vertica, using a Tableau dashboard.
Go to database
View the Overview page, which displays a dynamic dashboard of your database's health and activity. Explore the tabs below your dashboard, which provide more ways to manage the database.
You can install and manage multiple databases with MC, but you can have only one database running on a single cluster at a time. UP databases appear in green and DOWN databases are red.
4.3 - Creating a cluster using MC
After you install and configure MC, you can use Management Console to install a Vertica cluster on hosts where Vertica software has not been installed.
Enterprise Mode only
After you install and configure MC, you can use Management Console to install a Vertica cluster on hosts where Vertica software has not been installed. The Cluster Installation assistant lets you specify the hosts you want to include in your Vertica cluster, loads the Vertica software onto the hosts, validates the hosts, and assembles the nodes into a cluster.
Complete the following tasks:
-
Prepare the hosts - Prepare each host that will become a node in the cluster.
-
Create a private key file - MC needs password-less SSH to connect to hosts and install Vertica software. Create a private key to enable MC access to the hosts.
-
Use the MC cluster installation wizard - Use the wizard to install a Vertica cluster on hosts that do not have Vertica software already installed on them.
-
Validate hosts and create the cluster - Host validation is the process where the MC runs tests against each host in a proposed cluster. You must validate hosts before the MC can install Vertica on each host.
After you successfully create a cluster using MC, see Create a database on a cluster.
4.3.1 - Prepare the hosts
This topic applies only to on-premises installations.
This topic applies only to on-premises installations.
Before you can install a Vertica cluster using the MC, you must prepare each host that will become a node in the cluster. The cluster creation process runs validation tests against each host before it attempts to install the Vertica software. These tests ensure that the host is correctly configured to run Vertica.
Validate the hosts
The validation tests provide:
-
Warnings and error messages when they detect a configuration setting that conflicts with the Vertica requirements or any performance issue
-
Suggestions for configuration changes when they detect an issue
Note
The validation tests do not automatically fix all problems they encounter.
All hosts must pass validation before the cluster can be created.
If you accepted the default configuration options when installing the OS on your host, then the validation tests will likely return errors, since some of the default options used on Linux systems conflict with Vertica requirements. See Operating system configuration overview for details on OS settings. To speed up the validation process you can perform the following steps on the prospective hosts before you attempt to validate the hosts. These steps are based on Red Hat Enterprise Linux and CentOS systems, but other supported platforms have similar settings.
4.3.2 - Create a private key file
Before you can install a cluster, Management Console must be able to access the hosts on which you plan to install Vertica.
Before you can install a cluster, Management Console must be able to access the hosts on which you plan to install Vertica. MC uses password-less SSH to connect to the hosts and install Vertica software using a private key file.
If you already have a private key file that allows access to all hosts in the potential cluster, you can use it in the cluster creation wizard.
Note
The private key file is required to complete the MC cluster installation wizard.
Create a private key file
-
Log into the server as root or as a user with sudo privileges.
-
Change to your home directory.
$ cd ~
-
Create an .ssh directory if one does not already exist.
$ mkdir .ssh
-
Generate a passwordless private key/public key pair.
$ ssh-keygen -q -t rsa -f ~/.ssh/vid_rsa -N ''
This command creates two files: vid_rsa and vid_rsa.pub. The vid_rsa file is the private key file that you upload to the MC so that it can access nodes on the cluster and install Vertica. The vid_rsa.pub file is copied to all other hosts so that they can be accessed by clients using the vid_rsa file.
-
Make your .ssh directory readable and writable only by yourself.
$ chmod 700 /root/.ssh
-
Change to the .ssh directory.
$ cd ~/.ssh
-
Edit sshd.config as follows to disable password authentication for root:
PermitRootLogin without-password
-
Concatenate the public key into to the file vauthorized_keys2.
$ cat vid_rsa.pub >> vauthorized_keys2
-
If the host from which you are creating the public key will also be in the cluster, copy the public key into the local-hosts authorized key file:
cat vid_rsa.pub >> authorized_keys
-
Make the files in your .ssh directory readable and writable only by yourself.
$ chmod 600 ~/.ssh/*
-
Create the .ssh directory on the other nodes.
$ ssh <host> "mkdir /root/.ssh"
-
Copy the vauthorized key file to the other nodes.
$ scp -r /root/.ssh/vauthorized_keys2 <host>:/root/.ssh/.
-
On each node, concatenate the vauthorized_keys2 public key to the authorized_keys file and make the file readable and writable only by the owner.
$ ssh <host> "cd /root/.ssh/;cat vauthorized_keys2 >> authorized_keys; chmod 600 /root/.ssh/authorized_keys"
-
On each node, remove the vauthorized_keys2 file.
$ ssh -i /root/.ssh/vid_rsa <host> "rm /root/.ssh/vauthorized_keys2"
-
Copy the vid_rsa file to the workstation from which you will access the MC cluster installation wizard. This file is required to install a cluster from the MC.
A complete example of the commands for creating the public key and allowing access to three hosts from the key is below. The commands are being initiated from the docg01 host, and all hosts will be included in the cluster (docg01 - docg03):
ssh docg01
cd ~/.ssh
ssh-keygen -q -t rsa -f ~/.ssh/vid_rsa -N ''
cat vid_rsa.pub > vauthorized_keys2
cat vid_rsa.pub >> authorized_keys
chmod 600 ~/.ssh/*
scp -r /root/.ssh/vauthorized_keys2 docg02:/root/.ssh/.
scp -r /root/.ssh/vauthorized_keys2 docg03:/root/.ssh/.
ssh docg02 "cd /root/.ssh/;cat vauthorized_keys2 >> authorized_keys; chmod 600 /root/.ssh/authorized_keys"
ssh docg03 "cd /root/.ssh/;cat vauthorized_keys2 >> authorized_keys; chmod 600 /root/.ssh/authorized_keys"
ssh -i /root/.ssh/vid_rsa docg02 "rm /root/.ssh/vauthorized_keys2"
ssh -i /root/.ssh/vid_rsa docg03 "rm /root/.ssh/vauthorized_keys2"
rm ~/.ssh/vauthorized_keys2
4.3.3 - Use the MC cluster installation wizard
The Cluster Installation Wizard guides you through the steps required to install a Vertica cluster on hosts that do not already have Vertica software installed.
The Cluster Installation Wizard guides you through the steps required to install a Vertica cluster on hosts that do not already have Vertica software installed.
Note
If you are using MC with the Vertica AMI on Amazon Web Services, note that the Create Cluster and Import Cluster options are not supported.
Prerequisites
Before you proceed, make sure you:
-
Installed and configured Management Console.
-
Prepared the hosts that you will include in the Vertica database cluster.
-
Created the private key (pem) file and copied it to your local machine.
-
Obtained a copy of your Vertica license if you are installing the Premium Edition. If you are using the Community Edition, a license key is not required.
-
Downloaded the Vertica server RPM (or DEB file).
-
Have read/copy permissions on files stored on the local browser host that you will transfer to the host on which MC is installed.
Permissions on files to transfer to MC
On your local workstation, you must have at least read/write privileges on files you'll upload to MC through the Cluster Installation Wizard. These files include the Vertica server package, the license key (if needed), the private key file, and an optional CSV file of IP addresses.
Create a Vertica cluster using MC
-
Connect to Management Console and log in as an MC administrator.
-
On MC's Home page, click the Provisioning task. The Provisioning dialog appears.
-
Click Create a cluster.
-
The Create Cluster wizard opens. Provide the following information:
-
Cluster name—A label for the cluster. Choose a name that is unique within MC. IF you do not enter a name here, MC assigns a random unique cluster name. You can edit the name later when you view the cluster on the Infrastructure page. Note that this name is an alias that exists only in MC. If you reimport the cluster, you would need to edit the cluster name again to reestablish this name.
-
Vertica Admin User—The user that is created on each of the nodes when they are installed, typically 'dbadmin'. This user has access to Vertica and is also an OS user on the host.
-
Password for the Vertica Admin User—The password you enter (required) is set for each node when MC installs Vertica.
Note
MC does not support an empty password for the administrative user.
-
Vertica Admin Path—Storage location for catalog files, which defaults to /home/dbadmin unless you specified a different path during MC configuration (or later on MC's Settings page).
Important
The Vertica Admin Path must be the same as the Linux database administrator's home directory. If you specify a path that is not the Linux dbadmin's home directory, MC returns an error.
-
Click Next and specify the private key file and host information:
-
Click Browse and navigate to the private key file (vid_rsa) that you created earlier.
Note
You can change the private key file at the beginning of the validation stage by clicking the name of the private key file in the bottom-left corner of the page. However, you cannot change the private key file after validation has begun unless the first host fails validation due to an SSH login error.
-
Include the host IP addresses. You have three options:
Specify later (but include number of nodes). This option allows you to specify the number of nodes, but not the specific IPs. You can specify the specific IPs before you validate hosts.
Import IP addresses from local file. You can specify the hosts in a CSV file using either IP addresses or host names.
Enter a range of IP addresses. You can specify a range of IPs to use for new nodes. For example 192.168.1.10 to 192.168.1.30. The range of IPs must be on the same or contiguous subnets.
-
Click Next and select the software and license:
-
Vertica Software. If one or more Vertica packages have been uploaded, you can select one from the list. Otherwise, select Upload a new local vertica binary file and browse to a Vertica server file on your local system.
-
Vertica License. Click Browse and navigate to a local copy of your Vertica license if you are installing the Premium Edition. Community Edition versions require no license key.
-
Click Next. The Create cluster page opens. If you did not specify the IP addresses, select each host icon and provide an IP address by entering the IP in the box and clicking Apply for each host you add.
You are now ready to Validate hosts and create the cluster.
4.3.4 - Validate hosts and create the cluster
Host validation is the process where the MC runs tests against each host in a proposed cluster.
Host validation is the process where the MC runs tests against each host in a proposed cluster.
You can validate hosts only after you have completed the cluster installation wizard. You must validate hosts before the MC can install Vertica on each host.
At any time during the validation process, but before you create the cluster, you can add and remove hosts by clicking the appropriate button in the upper left corner of the page on MC. A Create Cluster button appears when all hosts that appear in the node list are validated.
How to validate hosts
To validate one or more hosts:
-
Connect to Management Console and log in as an MC administrator.
-
On the MC Home page, click the Databases and Clusters task.
-
In the list of databases and clusters, select the cluster on which you have recently run the cluster installation wizard (Creating... appears under the cluster) and click View.
-
Validate one or several hosts:
-
To validate a single host, click the host icon, then click Validate Host.
-
To validate all hosts at the same time, click All in the Node List, then click Validate Host.
-
To validate more than one host, but not all of them, Ctrl+click the host numbers in the node list, then click Validate Host.
-
Wait while validation proceeds.
The validation step takes several minutes to complete. The tests run in parallel for each host, so the number of hosts does not necessarily increase the amount of time it takes to validate all the hosts if you validate them at the same time. Hosts validation results in one of three possible states:
-
Green check mark—The host is valid and can be included in the cluster.
-
Orange triangle—The host can be added to the cluster, but warnings were generated. Click the tests in the host validation window to see details about the warnings.
-
Red X—The host is not valid. Click the tests in the host validation window that have red X's to see details about the errors. You must correct the errors re-validate or remove the host before MC can create the cluster.
To remove an invalid host: Highlight the host icon or the IP address in the Node List and click Remove Host.
All hosts must be valid before you can create the cluster. Once all hosts are valid, a Create Cluster button appears near the top right corner of the page.
How to create the cluster
-
Click Create Cluster to install Vertica on each host and assemble the nodes into a cluster.
The process, done in parallel, takes a few minutes as the software is copied to each host and installed.
-
Wait for the process to complete. When the Success dialog opens, you can do one of the following:
See Creating a Database on a Cluster for details on creating a database on the new cluster.
4.3.5 - Create a database on a cluster
After you use the MC Cluster Installation Wizard to create a Vertica cluster, you can create a database on that cluster through the MC interface.
After you use the MC Cluster Installation Wizard to create a Vertica cluster, you can create a database on that cluster through the MC interface. You can create the database on all cluster nodes or on a subset of nodes.
If a database had been created using the Administration Tools on any of the nodes, MC detects (autodiscovers) that database and displays it on the Manage (Cluster Administration) page so you can import it into the MC interface and begin monitoring it.
MC allows only one database running on a cluster at a time, so you might need to stop a running database before you can create a new one.
The following procedure describes how to create a database on a cluster that you created using the MC Cluster Installation Wizard. To create a database on a cluster that you created by running the install_vertica script, see Creating an Empty Database.
Create a database on a cluster
To create a new empty database on a new cluster:
-
If you are already on the Databases and Clusters page, skip to the next step. Otherwise:
-
Connect to MC and sign in as an MC administrator.
-
On the Home page, click Existing Infrastructure.
-
If no databases exist on the cluster, continue to the next step. Otherwise:
-
If a database is running on the cluster on which you want to add a new database, select the database and click Stop.
-
Wait for the running database to have a status of Stopped.
-
Click the cluster on which you want to create the new database and click Create Database.
-
The Create Database wizard opens. Provide the following information:
-
Database name and password. See Creating a database name and password for rules.
-
Optionally click Advanced to open the advanced settings and change the port, and catalog path, and data path. By default the MC application/web server port is 5450 and paths are /home/dbadmin, or whatever you defined for the paths when you ran the cluster creation wizard. Do not use the default agent port 5444 as a new setting for the MC application/web server port. See MC Settings > Configuration for port values.
-
Click Continue.
-
Select nodes to include in the database.
The Database Configuration window opens with the options you provided and a graphical representation of the nodes appears on the page. By default, all nodes are selected to be part of this database (denoted by a green check mark). You can optionally click each node and clear Include host in new database to exclude that node from the database. Excluded nodes are gray. If you change your mind, click the node and select the Include check box.
-
Click Create in the Database Configuration window to create the database on the nodes.
The creation process takes a few moments and then the database is started and a Success message appears.
-
Click OK to close the success message.
The Database Manager page opens and displays the database nodes. Nodes not included in the database are gray.
4.4 - Monitoring existing infrastructure using MC
Use Management Console to monitor the health of your Vertica databases and clusters.
Use Management Console to monitor the health of your Vertica databases and clusters. Click the Infrastructure button on the Home page to see the Databases and Clusters page. Then click the cluster of interest to view the health of the nodes in that cluster and the key information associated with the cluster such as:
-
Vertica version
-
Number of hosts
-
CPU type
-
Last updated date
-
Node list.
You can also zoom in and out for better view of this page.
On the Databases and Clusters page or the Home page, click the database which you want to monitor, to go to its Overview page:
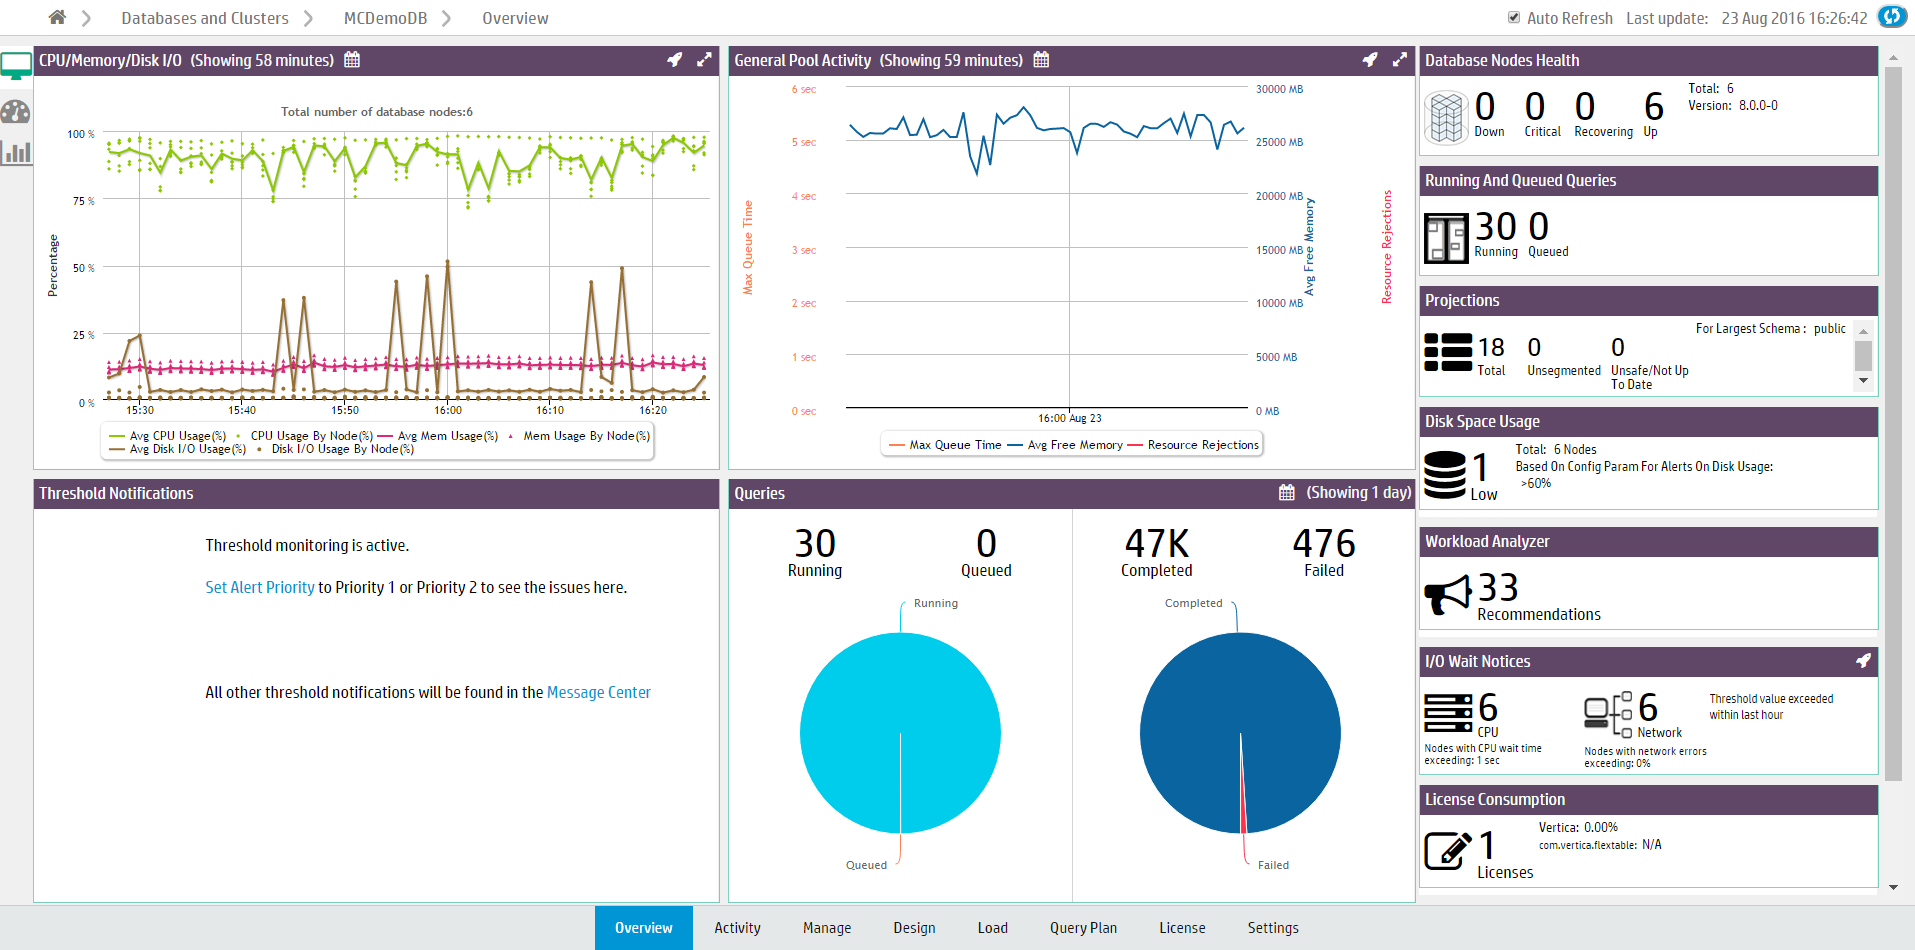
You can perform the following tasks from the Overview page:
-
View Quick Stats to get instant alerts and information about your cluster's status.
-
View Status Summary that provides a general overview of the status of your cluster (as shown in preceding figure).
-
Analyze System Health using a comprehensive summary of your system resource usage and node information, with configurable statistics that allow you to specify acceptable ranges of resource usage.
-
Use Query Synopsis to monitor system query activity and resource pool usage.
For Eon mode databases, the Status Summary and Query Synopsis pages allow you to display information for the entire database. If subclusters are defined, you can also display information for a specific subcluster or node, or the nodes not assigned to a subcluster.
Additionally, you can perform the following tasks from the Overview page:
Monitoring system resources
On the main window, you can click the database, and navigate to the MC Activity tab to monitor system resources such as:
Monitoring node and MC user activity
You can use the MC Manage page to monitor node activity. When you click the node you want to investigate, the Node Detail page opens and provides:
You can also browse and export log-level data from AgentTools and Vertica log files. MC retains a maximum of 2000 log records. See Monitoring node activity with MC for further details.
Use MC Diagnostics tab and navigate to Audit Log page to manage MC User activity. See Monitoring MC user activity using audit log.
Monitoring messages in databases managed by MC
You can view critical database related messages from MC Message Center. The MC Message Center reports on several critical database-related conditions using a color code to indicate the message severity. For further details, see Monitoring database messages and alerts with MC.
You can also search and sort database messages, mark messages read or unread and delete them. You can filter messages by message type, and export messages. For additional information, refer to Message center and Exporting MC-managed database messages and logs.
Monitoring and configuring resource pools
Use the MC Activity page to monitor resource pools. Select the resource pool you want to monitor. MC displays the following charts for the selected pool:
-
Resource Usages in Pool
-
Memory Usage in Node and Subclusters
-
Average Query Execution and Query Time in Pool
-
Resource Rejections in Pool
If you are a database administrator, you can click the database you want on the main window. You can then use the MC Settings tab to view and edit the resource pool parameters. Only the database administrator can monitor and configure the resource pools in Management Console.
See Monitoring resource pools with MC for further information.
5 - Users, roles, and privileges
If you are a Management Console (MC) administrator, you can use MC Settings to grant MC users privileges to one or more Vertica users.
If you are a Management Console (MC) administrator, you can use MC Settings to grant MC users privileges to one or more Vertica users.
Users
MC users are not the same as system (Linux) users. MC users are external to the database, and their information is stored on an internal database on the MC application or web server. See Users in Management Console for further details.
The MC super account is the default user. The super user needs to create all other MC users.
You can create MC users using either of two authentication techniques, LDAP or MC (internal). See Creating an MC user. After you create the MC users, you can manage them from MC Settings page. Refer to Managing MC users.
To control the level of access for the MC Users, you can grant them privileges (through roles) from the MC Settings page.
Roles and privileges
You control user access to MC through groups of privileges (also referred to as access levels) that fall into two types, those that apply to MC configuration, and those that apply to MC-managed Vertica databases.
MC permission groups
-
MC configuration privileges are made up of roles that control what users can configure on the Management Console, such as modify MC settings, create and import Vertica databases, restart MC, create a Vertica cluster through the MC interface, and create and manage MC users.
-
MC database privileges are made up of roles that control what users can see or do on a Vertica database monitored by MC, such as view the database cluster state, query and session activity, monitor database messages and read log files, replace cluster nodes, and stop databases.
Note
When you grant an MC user a database role, that user inherits the privileges assigned to the database user account to which the MC user is mapped. For maximum access, use the dbadmin username and password.
MC database privileges cannot alter or override the Vertica database user's privileges and roles.
Note
If TLS/SSL is configured in mutual mode on the Vertica database, each MC user must be configured with an individual client certificate and private key, to log into the database from MC. See
Configuring mutual TLS for MC users. If the individual certificate has not been configured, you see an error message. See your Management Console administrator.
See also
5.1 - Users in Management Console
Unlike database users, which you create on the Vertica database and then grant privileges and roles through SQL statements, you create MC users on the Management Console interface.
Unlike database users, which you create on the Vertica database and then grant privileges and roles through SQL statements, you create MC users on the Management Console interface. MC users are external to the database. Their information is stored on an internal database on the MC application/web server. Their access to both MC and to databases managed by MC is controlled by groups of privileges (also referred to as access levels). MC users are not system (Linux) users; they are entries in the MC internal database.
Permission group types
There are two types of permission groups on MC, those that apply to MC configuration and those that apply to database access:
-
MC configuration privileges are made up of roles that control what users can configure on the Management Console, such as modify MC settings, create and import Vertica databases, restart MC, create a Vertica cluster through the MC interface, and create and manage MC users.
-
MC database privileges are made up of roles that control what users can see or do on a Vertica database monitored by MC, such as view the database cluster state, query and session activity, monitor database messages and read log files, replace cluster nodes, and stop databases.
If you are using MC, you might want to allow one or more users in your organization to configure and manage MC, and you might want other users to have database access only. You can meet these requirements by creating MC users and granting them a role from each privileges group. See Creating an MC user for details.
MC user types
The following table describes the five types of role-based users on MC:
|
User Type |
Description |
|
SUPER Role (MC) |
The default superuser administrator (Linux account) who gets created when you install and configure MC and oversees all of MC. |
|
ADMIN Role (MC) |
Users who can configure all aspects of MC and control all databases managed by MC. |
|
MANAGER Role (MC) |
Users who can configure MC user settings and monitor all databases managed by MC. |
|
IT Role (MC) |
Users who can configure some aspects of MC user settings and monitor all databases managed by MC. |
|
NONE Role (MC) |
Users who cannot configure MC and have access to one or more databases managed by MC. |
For details about each role, see Configuration privileges.
You create users and grant them privileges (through roles) on the MC Settings page in the User management tab.
Creating users and choosing an authentication method
You create users and grant them privileges (through roles) on the MC Settings page. You can also choose how to authenticate their access to MC.
- To add users who are authenticated against the MC, click User Management
- To add users who are authenticated through your organization's LDAP repository, click Authentication
MC supports only one method for authentication, so if you choose MC, all MC users will be authenticated using their MC login credentials.
Default MC users
The MC super account is the only default user. The super or another MC administrator must create all other MC users.
See also
5.1.1 - Creating an MC user
MC provides two authentication schemes for MC users: LDAP or MC (internal).
MC provides two authentication schemes for MC users: LDAP or MC (internal). The method you choose when you configure MC is the method MC uses to authenticate all MC users. It is not possible to authenticate some MC users against LDAP and other MC users against credentials in the database through MC.
-
MC (internal) authentication. Internal user authorization is specific to MC itself. You create a user with a username and password combination. This method stores MC user information in an internal database on the MC application/web server, and encrypts passwords. Note that these MC users are not system (Linux) users; they are entries in the MC’s internal database.
-
LDAP authentication. All MC users—except for the MC super administrator, which is a Linux account—are authenticated based on search criteria against your organization's LDAP repository. MC uses information from LDAP for authentication purposes only and does not modify LDAP information. Also, MC does not store LDAP passwords but passes them to the LDAP server for authentication.
Instructions for creating new MC users are in this topic.
-
If you chose MC authentication, follow the instructions under Create a New User Authenticated by MC.
-
If you chose LDAP authentication, follow the instructions under Create a New User from LDAP.
See Configuring Management Console, Users in Management Console and LDAP authenticationfor more information.
Prerequisites
Before you create an MC user, ensure that:
-
You have created a database directly on the server or through the MC interface, or you imported an existing database cluster into the MC interface. See Managing database clusters.
-
You have created a database user account (source user) on the server, which has the privileges and/or roles you want to map to the new (target) MC user. See Creating a database user.
-
You know which MC privileges you want to grant to the new MC user. See Users, roles, and privileges.
-
You will be mapping the MC user to a Vertica DB user who has sysmonitor privileges assigned, or to the Vertica database super user. Without sysmonitor (or super user) privileges, the mapped MC user will not be able to view information in MC monitoring tables, and will not be able to load Kafka streaming data.
If you have not yet met the first two above prerequisites, you can still create new MC users; you just won't be able to map them to a database until after the database and target database user exist. To grant MC users database access later, see Granting database access to MC users.
Create a new user authenticated by MC
-
Sign in to MC as an administrator and navigate to MC Settings > User Management.
-
Click Add.
-
Enter the MC username.
Note
It is not necessary to give the MC user the exact same name as the database user account you'll map the MC user to in Step 7. What matters is that the source database user has privileges and/or roles similar to the database role you want to grant the MC user. The most likely scenario is that you map multiple MC users to a single database user account.
-
Let MC generate a password or create one by clicking Edit password. If LDAP has been configured, the MC password field will not appear.
-
Optionally enter the user's e-mail address.
-
Select an MC configuration permissions level. See Configuration privileges. Your choice in this field also fills in the appropriate User API Key value.
-
Next to the DB access levels section, click Add to grant this user database permissions.
-
Choose a database. Select a database from the list of MC-discovered (databases that were created on or imported into the MC interface).
-
Database username. Enter an existing database user name or, if the database is running, click the ellipsis [...] to browse for a list of database users, and select a name from the list.
-
Database password. Enter the password to the database user account (not this username's password).
-
Restricted access. Choose a database level (ADMIN, IT, or USER) for this user.
-
Click OK to close the Add permissions dialog box.
-
If the Vertica database is configured to require TLS, select Yes in the Use TLS Connection drop-down. MC launches the Certificates wizard to let you configure TLS. See MC certificates wizard.
-
Leave the user's Status as enabled (the default). If you need to prevent this user from accessing MC, select disabled.
-
Click Add User to finish.
Create a new LDAP-authenticated user
When you add a user from LDAP on the MC interface, options on the Add a new user dialog box are slightly different from when you create users without LDAP authentication. Because passwords are store externally (LDAP server) the password field does not appear. An MC administrator can override the default LDAP search string if the user is found in another branch of the tree. The Add user field is pre-populated with the default search path entered when LDAP was configured.
-
Sign in to MC and navigate to MC Settings > User management.
-
Click Add and provide the following information:
-
LDAP user name.
-
LDAP search string.
-
User attribute, and click Verify user.
-
User's email address.
-
MC configuration role. NONE is the default. See Configuration privileges for details.
-
Database access level. See Database privileges for details.
-
Accept or change the default user's Status (enabled).
-
Click Add user.
If you encounter issues when creating new users from LDAP, you'll need to contact your organization's IT department.
How MC validates new users
After you click OK to close the Add permissions dialog box, MC tries to validate the database username and password entered against the selected MC-managed database or against your organization's LDAP directory. If the credentials are found to be invalid, you are asked to re-enter them.
If the database is not available at the time you create the new user, MC saves the username/password and prompts for validation when the user accesses the Database and Clusters page later.
See also
5.1.2 - Managing MC users
You manage MC users through the following pages on the Management Console interface:.
You manage MC users through the following pages on the Management Console interface:
Who manages users
The MC superuser administrator (SUPER Role (MC)) and users granted ADMIN role (MC) manage all aspects of users, including their access to MC and to MC-managed databases.
Users granted IT Role (MC) can enable and disable user accounts. For more information, see Users, roles, and privileges and Users in Management Console.
Editing an MC user's information follows almost the same steps as creating a new user, except that you select an existing user and click Edit. The user's information will be pre-populated, so that you can edit and save it.
The only user account you cannot alter or remove from the MC interface is the MC super account.
For details about each user type, see Configuration privileges.
You can change the following user properties:
-
MC password
-
Email address. This field is optional. If the user is authenticated against LDAP, the email field is pre-populated with that user's email address if one exists.
-
Configuration privileges role
-
Database privileges role
You can also change a user's status (enable/disable access to MC) and delete users.
About user names
After you create and save a user, you cannot change that user's MC user name, but you can delete the user account and create a new user account under a new name. The only thing you lose by deleting a user account is its audit activity, but MC immediately resumes logging activity under the user's new account.
5.1.3 - Granting database access to MC users
If you did not grant an MC user a database-level role when you created the user account, you can do so in the User Management tab in MC Settings.
If you did not grant an MC user a database-level role when you created the user account, you can do so in the User Management tab in MC Settings.
Granting the user an MC database-level role associates the MC user with a database user's privileges and ensures that the MC user cannot do or see anything not allowed by the privileges set up for the user account on the server database. When that MC user logs in to MC, his or her MC privileges for database-related activities are compared to that user's privileges on the database itself. Only when the user has both MC privileges and corresponding database privileges will the operations be exposed in the MC interface.
Prerequisites
Before you grant database access to an MC user, see the prerequisites in Creating an MC user.
Grant a database-level role to an MC user
-
Log in to Management Console as an administrator and navigate to MC Settings > User management.
-
Select an MC user and click Edit.
-
Verify the Configuration privileges are what you want them to be. NONE is the default.
-
Next to the DB access levels section, click Add and provide the following database access credentials:
-
Choose a database. Select a database from the list of MC-discovered (databases that were created on or imported into the MC interface).
-
Database username. Enter an existing database user name or, if the database is running, click the ellipsis [...] to browse for a list of database users, and select a name from the list.
-
Database password. Enter the password to the database user account (not this username's password).
-
Restricted access. Choose a database level (ADMIN, IT, or USER) for this user.
-
Click OK to close the Add permissions dialog box.
-
If the Vertica database is configured to require TLS, select Yes in the Use TLS Connection drop-down. MC launches the Certificates wizard to let you configure TLS. See MC certificates wizard.
-
Optionally change the user's Status (enabled is the default).
-
Click Save.
How MC validates new users
After you click OK to close the Add permissions dialog box, MC tries to validate the database username and password entered against the selected MC-managed database or against your organization's LDAP directory. If the credentials are found to be invalid, you are asked to re-enter them.
If the database is not available at the time you create the new user, MC saves the username/password and prompts for validation when the user accesses the Database and Clusters page later.
5.1.4 - Managing MC user passwords
MC user passwords must be different from the username and must contain at least one of each of the following character types:.
MC user passwords must be different from the username and must contain at least one of each of the following character types:
Configurable password requirements
You can configure additional password requirements by navigating to Home > MC Settings > Configuration > MC Password configuration settings.
|
Parameter |
Settings |
|
Minimum password length |
The minimum number of characters required in a password.
-
Minimum: 8 (default)
-
Maximum: 30
|
Security questions
When a user creates an MC account, they must set security questions. If a user forgets their password, they can reset their password by answering these questions. These answers:
- must only contain letters, numbers, and spaces
- must be between 2 and 30 characters in length, inclusive
- are case insensitive
5.2 - Configuration privileges
When you create a Management Console (MC) user, you assign them an MC configuration access level (role).
When you create a Management Console (MC) user, you assign them an MC configuration access level (role). MC roles control a user's ability to create users and manage MC settings on the MC interface.
You can assign a user one of the following MC access levels:
-
ADMIN Role (MC): Full access to all MC functionality.
-
Manager Role (MC): Access to MC user management functionality. Access to non-database MC alerts.
-
IT Role (MC): Limited access to MC user management functionality. Access to MC log and to non-database MC alerts.
-
NONE Role (MC): Database access only, to the databases an administrator assigns to this user.
You grant MC configuration privileges at the same time you create the user's account, on the User Management tab of the MC Settings page. You can change MC access levels using this page. See Creating an MC user for details.
You can also use the User Management tab to grant users access to one or more databases managed by MC. See Database privilegesfor details.
SUPER role (MC)
The default superuser administrator, called Super on the MC UI, is a Linux user account that gets created when you install and configure MC. During the configuration process, you can assign the Super any name you like; it need not be dbadmin.
The MC SUPER role, a superset of the ADMIN Role (MC), has the following privileges:
-
Oversees the entire Management Console, including all MC-managed database clusters
Note
This user inherits the privileges/roles of the user name supplied when importing a Vertica database into MC. Vertica recommends that you use the database administrator's credentials.
-
Creates the first MC user accounts and assigns them an MC configuration role
-
Grants MC users access to one or more MC-managed Vertica databases by assigning Database privileges to each user
The MC super administrator account is unique. Unlike other MC users you create, including other MC administrators, the MC super account cannot be altered or dropped, and you cannot grant the SUPER role to other MC users. The only property you can change for the MC super is the password. Otherwise the SUPER role has the same privileges on MC as the ADMIN Role (MC).
On MC-managed Vertica databases, SUPER has the same privileges as ADMIN Role (DB).
The MC super account does not exist within the LDAP server. This account is also different from the special dbadmin account that gets created during a Vertica installation, whose privileges are governed by the DBADMIN. The Vertica-created dbadmin is a Linux account that owns the database catalog and storage locations and can bypass database authorization rules, such as creating or dropping schemas, roles, and users. The MC super does not have the same privileges as dbadmin.
ADMIN role (MC)
This user account is the user who can perform all administrative operations on Management Console, including configure and restart the MC process and add, change, and remove all user accounts. By default, MC administrators inherit the database privileges of the main database user account used to set up the database on the MC interface. Therefore, MC administrators have access to all MC-managed databases. Grant the ADMIN role to users you want to be MC administrators.
The difference between this ADMIN user and the default Linux account, the MC SUPER Role, is you cannot alter or delete the MC SUPER account, and you can't grant the SUPER role to any other MC users. You can, however, change the access level for other MC administrators, and you can delete this user's accounts from the MC interface.
There is also the ADMIN Role (DB) that controls a user's access to MC-managed databases. The two ADMIN roles are similar, but they are not the same, and you do not need to grant users with the ADMIN (mc) role an ADMIN (db) role because MC ADMIN users automatically inherit all database privileges of the main database user account that was created on or imported into MC.
MANAGER role (MC)
Users assigned the Manager role can configure user settings in MC. The Manager role allows full access to the User Management tab in MC Settings. Managers can also view a full list of databases monitored by MC on the Home page, view the MC log, and see non-database MC alerts.
The Manager role has similar configuration privileges to the IT configuration role. Unlike IT users, Managers can also create, edit, and delete users in User Settings.
IT role (MC)
MC IT users can monitor all MC-managed databases, view MC-level (non database) messages, logs, and alerts, disable or enable user access to MC, and reset non-LDAP user passwords. You can also assign MC IT users specific database privileges, which you do by mapping IT users to a user on a database. In this way, the MC IT user inherits the privileges assigned to the database user that they are mapped to.
There is also an IT Role (DB) that controls a user's access to MC-managed databases. If you grant an MC user both IT roles, it means the user can perform some configuration on MC and also has access to one or more MC-managed databases. The database mapping is not required, but it gives the IT user wider privileges.
NONE role (MC)
The default role for all newly-created users on MC is NONE, which prevents users granted this role from configuring the MC. When you create MC users with the NONE role, you grant them an MC database-level role. This assignment maps the MC user to a user account on a specific database and specifies that the NONE user inherits the database user’s privileges to which he or she is mapped.
Which database-level role you grant this user with NONE privileges—whether ADMIN (db) or IT (db) or USER (db)—depends on the level of access you want the user to have on the MC-managed database. Database roles have no impact on the ADMIN and IT roles at the MC configuration level.
MC configuration privileges by user role
You grant the following configuration privileges by MC role.
|
MC access privileges |
ADMIN |
MANAGER |
IT |
NONE |
|
Configure MC settings:
-
Configure storage locations and ports
-
Upload new SSL certificates
-
Manage LDAP authentication
-
Update Vertica installation
-
Change MC theme
-
Map to an external data source
|
Yes |
|
|
|
|
Configure user settings:
-
Add, edit, delete users
-
Add, change, delete user permissions
-
Map users to one or more databases
|
Yes |
Yes |
|
|
|
Configure user settings:
|
Yes |
Yes |
Yes |
|
|
Monitor user activity on MC using audit log |
Yes |
|
|
|
|
Create and manage databases and clusters:
-
Create a new database or import an existing one
-
Create a new cluster or import an existing one
-
Remove databases and clusters from MC
|
Yes |
|
|
|
|
Reset MC to its original, preconfigured state |
Yes |
|
|
|
|
Restart Management Console |
Yes |
|
|
|
|
View full list of databases monitored by MC |
Yes |
Yes |
Yes |
|
|
View MC log |
Yes |
|
Yes |
|
|
View non-database MC alerts |
Yes |
Yes |
Yes |
Yes |
See also
5.3 - Database privileges
When you create (MC) users, you first assign them MC configuration privileges, which controls what they can do on the MC itself.
When you create Management Console (MC) users, you first assign them MC configuration privileges, which controls what they can do on the MC itself. In the same user-creation operation, you grant access to one or more MC-managed databases. MC database access does not give the MC user privileges directly on Vertica; it provides MC users varying levels of access to assigned database functionality through the MC interface.
Assign users an MC database level through one of the following roles:
-
ADMIN Role (DB): Full access to all databases managed by MC. Actual privileges ADMINs inherit depend on the database user account used to create or import the Vertica database into the MC interface.
-
Associate Role (DB): Full access to all databases managed by MC. Cannot start, stop, or drop a database. Actual privileges that Associates receive depend on those defined for the database user account to which the Associate user is mapped.
-
IT Role (DB): Can start and stop a database but cannot remove it from the MC interface or drop it.
-
USER Role (DB): Can view database information through the database Overview and Activities pages but is restricted from viewing more detailed data.
ADMIN role (DB)
ADMIN is a superuser with full privileges to monitor MC-managed database activity and messages. Other database privileges (such as stop or drop the database) are governed by the user account on the Vertica database that this ADMIN (db) user is mapped to. ADMIN is the most permissive role and is a superset of privileges granted to the Associate, IT, and USER roles.
Note
Database access granted through Management Console never overrides roles granted on a specific Vertica database.
There is also an MC configuration administrator role that defines what the user can change on the MC itself. The two ADMIN roles are not the same. Unlike the MC configuration role of ADMIN, which can manage all MC users and all databases imported into the UI, the MC database ADMIN role has privileges only on the databases you map this user to. See ADMIN Role (MC) for additional details.
Associate role (DB)
The Associate role is an MC database access role. It is similar to the Admin role. It has privileges to monitor activity and messages on databases managed by MC. Unlike Admin users, Associate users cannot start, stop, or drop the database. The Associate user role is mapped to a user account on the database. This mapped user role determines what other database privileges the Associate role has (such as modifying settings, installing licenses, and viewing the database designer).
The following database operations depend on the database user's role that you mapped this Associate user to:
-
Install or audit a license
-
Manage database settings
-
View Database Designer
-
View the database Activity page
Note
Database access granted through Management Console never overrides roles granted on a specific Vertica database.
IT role (DB)
IT can view most details about an MC-managed database, such as messages (and mark them read/unread), the database overall health and activity/resources, cluster and node state, and MC settings. You grant and manage user role assignments through the MC Settings > User management page on the MC.
There is also an IT role at the MC configuration access level. The two IT roles are similar, but they are not the same. If you grant an MC user both IT roles, it means the user can perform some configuration on MC and also has access to one or more MC-managed databases. For additional details, see IT Role (MC).
User role (DB)
USER has limited database privileges, such as viewing database cluster health, activity/resources, and messages. MC users granted the USER database role might have higher levels of permission on the MC itself, such as the IT Role (MC). Alternatively, USER users might have no (NONE) privileges to configure MC. How you combine the two levels is up to you.
Mapping MC users to a database to avoid conflicts
When you assign an MC database level to an MC user, map the MC user account to a database user account to ensure that:
Privileges assigned to the database user supersede privileges of the MC user if there is a conflict, such as stopping a database. When the MC user logs into MC using an MC user name and password, Vertica compares privileges for database-related activities to the privileges on the database account to which you mapped the MC user. Vertica allows the user to perform operations in MC only when that user has both MC privileges and corresponding database privileges.
Tip
As a best practice, you should identify, in advance, the appropriate Vertica database user account that has privileges or roles similar to one of the MC database roles.
See Creating an MC user for more information.
MC database privileges by role
The following table summarizes MC database-level privileges by user role. The table shows the default privileges each role has. Operations marked "database user privilege" are dependent on the privileges of the Vertica database user account to which the MC user is mapped.
|
Default database-level privileges |
ADMIN |
ASSOCIATE |
IT |
USER |
|
View database Overview page |
Yes |
Yes |
Yes |
Yes |
|
View database messages |
Yes |
Yes |
Yes |
Yes |
|
Delete messages and mark read/unread |
Yes |
Yes |
Yes |
|
|
Audit and install Vertica licenses |
Database user privilege |
Database user privilege |
|
|
|
View database Activity page:
-
Queries chart
-
Internal Sessions chart
-
User Sessions chart
-
System Bottlenecks chart
-
User Query Phases chart
|
Yes |
Database user privilege |
Database user privilege |
Database user privilege |
|
View database Activity page:
|
Database user privilege |
Database user privilege |
|
|
|
Start a database |
Yes |
|
|
|
|
Rebalance, stop, or drop databases |
Database user privilege |
|
|
|
|
View Manage page |
Yes |
Yes |
Yes |
Yes |
|
View node details |
Yes |
Yes |
Yes |
|
|
Replace, add, or remove nodes |
Database user privilege |
|
|
|
|
Start/stop a node |
Yes |
|
|
|
|
View database Settings page |
Yes |
Yes |
Yes |
|
|
Modify database Settings page |
Database user privilege |
Database user privilege |
|
|
|
View Database Designer |
Database user privilege |
Database user privilege |
|
|
6 - Database management
The Management Console provides tools to manage Eon Mode and Enterprise Mode databases, including creating a database, provisioning resources, subcluster management, and query optimization.
The Management Console provides tools to manage Eon Mode and Enterprise Mode databases, including creating a database, provisioning resources, subcluster management, and query optimization.
6.1 - Creating a database using MC
If you installed the Management Console using an RPM, there is a wizard to help you create a new database on an existing Vertica cluster.
If you installed the Management Console using an RPM, there is a wizard to help you create a new database on an existing Vertica cluster.
Note
If you did not install MC with an RPM, see one of the following:
- Connect to Management Console, and log in.
- On the home page, click View Infrastructure to go to the Database and Cluster View. This tab provides a summary of your environment, clusters, and databases.
- If the Database row displays a database running on the cluster that you want to add a new database to, select the database and click Stop. Wait until the database status is Stopped.
- In the Clusters row, click the existing cluster that you want to create a database on. If a database is already running on it, you must stop the database.
- Click Create Database in the window to start the database creation wizard.
- Follow the steps in the wizard to successfully create a database.
You can close the web browser during the process and sign back in to MC later. The creation process continues unless an unexpected error occurs.
See also
6.2 - Provisioning databases using MC
Management Console allows all users to create, import, and connect to Vertica databases using the MC Provision Databases tab.
Management Console allows all users to create, import, and connect to Vertica databases using the MC Provision Databases tab.
6.3 - Managing database clusters
Management Console allows you to monitor multiple databases on one or more clusters at the same time.
Management Console allows you to monitor multiple databases on one or more clusters at the same time. MC administrators can see and manage all databases and clusters monitored by MC, while non-administrative MC users see only databases on which they have been assigned the appropriate access levels.
Depending on your access level, you can use the MC to perform the following database and cluster-related management operations:
-
Create an Eon Mode and Enterprise Mode database.
-
Install an Eon Mode and Enterprise Mode database in a cloud or on-premises environment.
-
Create an empty database in an existing cluster.
-
Import an existing database or cluster into the MC interface.
-
Start the database, unless it is already running.
-
Stop the database, if no users are connected.
-
Remove the database from the MC interface.
Note
Remove does not drop the database. A Remove operation leaves it in the cluster, hidden from the UI. To add the database back to the MC interface, import it using the IP address of any cluster node. A Remove operation also stops metrics gathering on that database, but statistics gathering automatically resumes after you re-import.
-
Drop the database when you are certain that no users are connected. Drop is a permanent action that drops the database from the cluster.
Database clusters in the cloud
When you use the Management Console to create a database or cluster on a supported cloud provider, you can perform the following operations on individual machines or the entire cluster:
-
Start
-
Stop
-
Revive
-
Reboot
-
Terminate
For details, see Viewing and managing your cluster.
6.3.1 - Viewing cluster infrastructure
For a summary of all databases and clusters currently monitored by MC, click View Infrastructure on the MC Home page.
For a summary of all databases and clusters currently monitored by MC, click View Infrastructure on the MC Home page.
Note
Some of the features on this page are currently available in MC only on AWS and GCP.
The first tab on the Infrastructure page, Database and Cluster View, is overview of the infrastructure of all the clusters and databases currently monitored by MC.
Three rows are displayed: Infrastructure, Clusters, and Databases.
-
Infrastructure. Specifies the type of environment on which your clusters reside:
-
Cloud: Displays the name of the cloud platform, such as AWS or GCP
-
On premises: Displays "Data Center"
-
Apache Hadoop: Displays "Hadoop Environment"
-
Clusters. You can click a cluster to see its full details. From the dialog that opens, you can:
-
Databases. A numbered badge on the top right displays the number of highest-priority messages from that database that are in your inbox. If a handshake icon ( ) displays next to "Type," that indicates the database is running in Eon Mode. If the handshake is absent, the database is running in Enterprise Mode. Click any database for more details. From the dialog that opens, you can:
In the illustration below, MC is monitoring two different clusters that both reside on an AWS environment. One database is running on each cluster. The DemoDB database, displayed on the left, has a handshake icon next to its "Type" label that indicates it is running in Eon Mode. The VMart database on the 3-node cluster, displayed on the right, is running in Enterprise Mode.
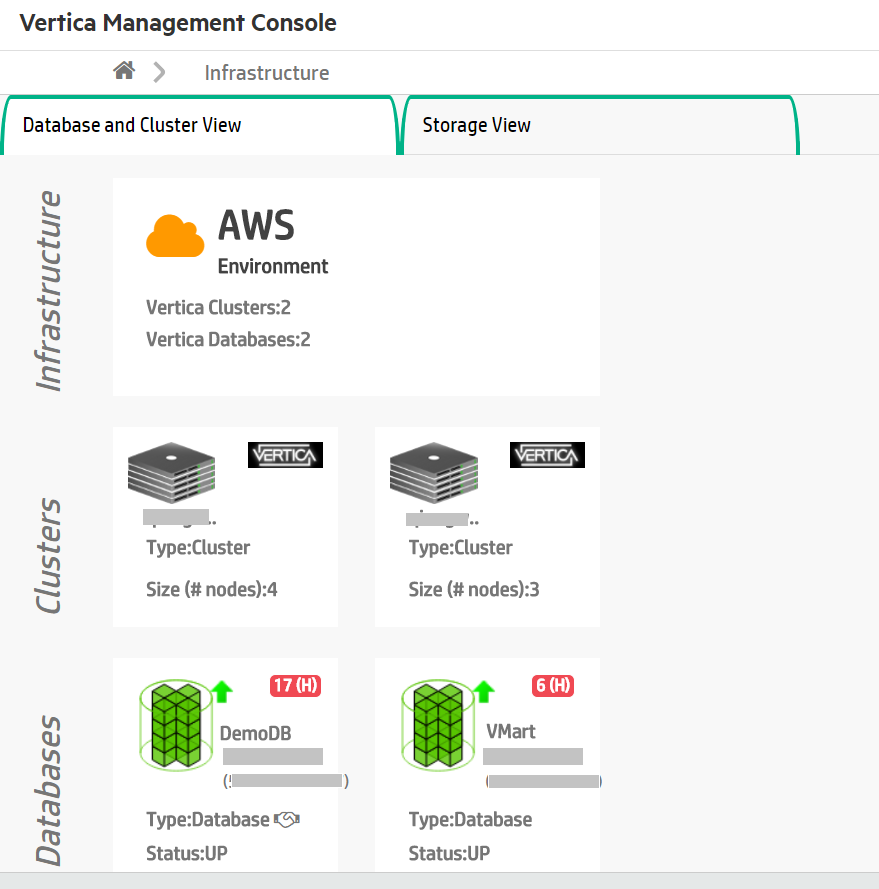
6.3.2 - Viewing and managing your cluster
The Cluster page in Management Console shows a node-based visualization of your cluster.
The Cluster page in Management Console shows a node-based visualization of your cluster. This page shows the cluster's host addresses, the installed version of Vertica running, and a list of the databases on the cluster that MC is currently monitoring.
Note
Some of the features on this page are currently available in MC only on AWS and GCP.
From the Cluster page, you can also create a new empty database on the cluster, or import any existing databases MC discovers on the cluster. (These features are currently available only on AWS and GCP.)
MC displays different options depending on whether you imported the cluster to MC, or created the cluster using MC:
-
Imported cluster: MC displays monitoring information about the cluster.
-
Cluster created using MC: MC displays both monitoring information and management options for third-party cloud platforms such as AWS. For clusters you created using the current MC, the Cluster page provides cluster and instance management options.
Cluster and instance management option availability
For Eon Mode databases, MC supports actions for subcluster and node management for the following public and private cloud providers:
Note
Enterprise Mode does not support subclusters.
For Enterprise Mode databases, MC supports these actions:
Note
In the cloud on GCP, Enterprise Mode databases are not supported.
Go to the cluster page
To view the Cluster page:
-
On the MC Home page, click View Infrastructure to go to the Infrastructure page. This page lists all the clusters the MC is monitoring.
-
Click any cluster shown on the Infrastructure page.
-
Select View or Manage from the dialog that displays, to view its Cluster page. (In a cloud environment, if MC was deployed from a cloud template the button says "Manage". Otherwise, the button says "View".)
Note
You can click the pencil icon beside the cluster name to rename the cluster. Enter a name that is unique within MC.
Monitor imported clusters
Whether you have imported or created a cluster using MC, you can view information about it through the Cluster page.
This page includes the following information:
-
Node visualization: A visualization of all nodes within the cluster. Icons at the top right of each node indicate if the nodes are up. Click any node to see details about its host name, CPU information and total memory. If there are many nodes in the cluster, use the Zoom Level slider at the bottom right of the page to zoom the visualization in or out.
-
Instance List: A list of all the instance IPs within the cluster. Click any instance in the list to see details about it.
-
Cluster Summary: A summary of details about the cluster, including the version of Vertica running on the cluster and the number of hosts. If the cluster is running on cloud-platform resources such as AWS, you can also see region and instance type information.
-
Databases: Lists all databases monitored by MC and their current state.
The following image shows an overview of a 7-node cluster, which was created in MC using a Cloud Formation Template. This cluster has a running Eon Mode database on it.
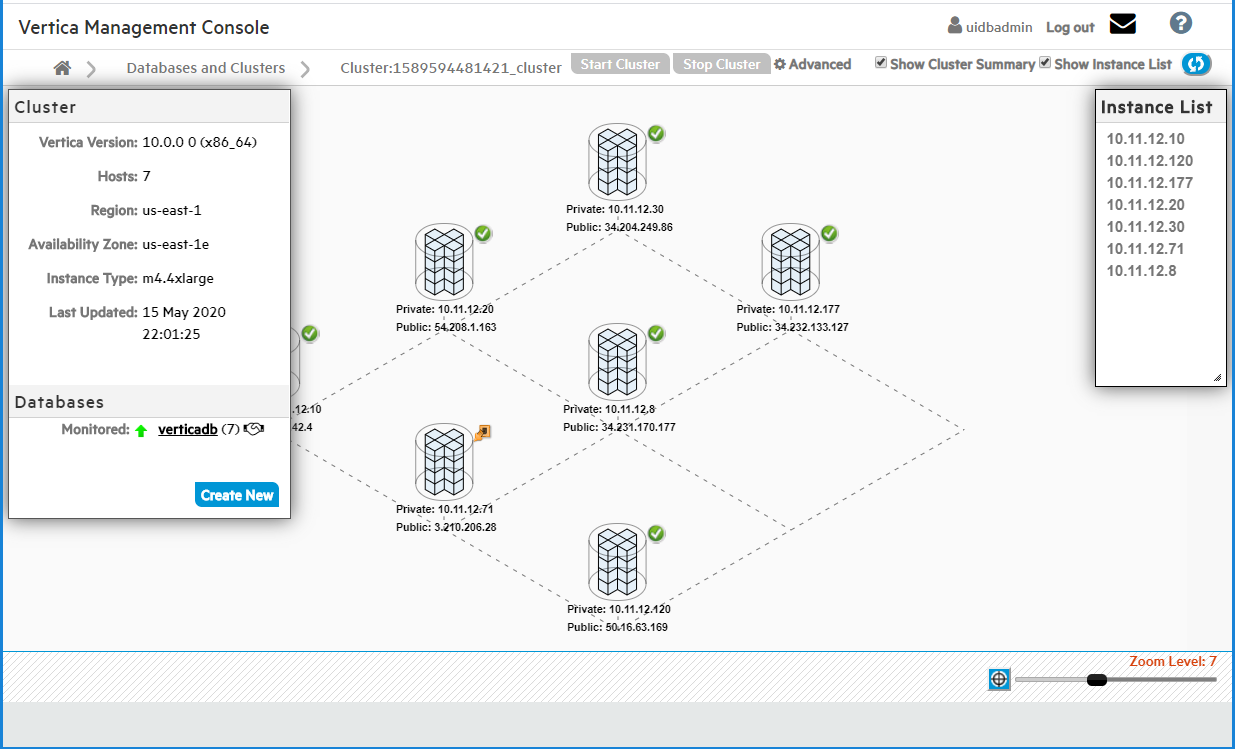
Manage a cluster created on AWS with the cluster creation wizard
If you installed Vertica from the AWS Marketplace using AWS resources, MC offers cluster management operations that are specific to the cloud. Using MC, you can manage a cluster running on AWS without going to the AWS console.
Note
Note: The AWS management operations to add or terminate instances are only available for clusters on AWS resources that were created using the current MC. Add and terminate capabilities are disabled for any cluster imported to MC, even if the imported cluster is on an AWS environment.
If you upgrade the cluster's Vertica version manually through the command line, AWS management operations in MC become disabled for the cluster, even if you created that cluster using MC. Make sure to upgrade the cluster's Vertica version through MC in order to preserve AWS management capabilities for that cluster in MC.
In the screen capture below, the Cluster page shows a 7-node cluster, which was provisioned using the Cluster Creation wizard. Use the wizard to create an Eon Mode or Enterprise Mode.
Cluster management actions (Eon Mode and Enterprise Mode)
You can perform the following operations on your cluster through the Cluster page. These options are available at the top of the Cluster page or in the Advanced menu at the top of the page:
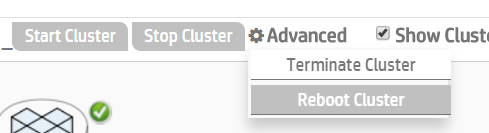
You can perform the following operations on your cluster through the cluster page:
-
Start Cluster: Start all the instances in the cluster. Available at the top of the Cluster page.
-
Stop Cluster: Stop all the instances in the cluster. You must first stop any running database on the cluster. Available at the top of the cluster page.
-
Reboot Cluster: Restart all instances in the cluster. Available under the Advanced menu at the top of the page. Note: Reboot Cluster is currently available only on AWS.
-
Terminate Cluster: Terminate all instances in the cluster, the databases on it, and all AWS resources from the cluster. The Terminate Cluster operation is available under the Advanced menu at the top of the page.
-
For Enterprise Mode databases, this operation permanently deletes any data you had on the cluster or its databases.
-
For Eon Mode databases, the data is preserved in communal storage and you can later revive the database in a new cluster. When you choose to terminate the cluster, MC gives you the option to also stop the database before termination, which is recommended in order to safely revive later.
View cluster instance details
You can view the details for any instance in your cluster. Select the IP address of an instance in the Instance List. MC displays a popup beside that instance showing information about its private and public IP addresses, host name, total memory, and other details.
Manage individual instances/nodes in Eon Mode
If your database is Eon Mode, you use actions available on the Database > Manage > Subclusters tab in MC to manage individual nodes.
To change the state of individual nodes in your Eon Mode database, you can:
- Start, stop, or terminate a node in a subcluster.
See Node action rules in MC.
To change the number of nodes in your Eon Mode database, you can:
See Subcluster action rules in MC.
Manage individual instances in Enterprise Mode
If your database is Enterprise Mode, the Cluster page Instance List includes action icons you use to manage individual instances in your cluster.
In the Instance List panel of the Cluster page, select the IP address of any instance in your cluster that you want to perform the action on. Then click an icon from the icon menu at the top of the panel. Hover over an icon to read the action it performs.
-
Start Instance: Start an individual instance in the cluster.
-
Stop Instance: Stop an individual instance in the cluster.
-
Add Instance: Add another instance to your cluster. When you select this action, Management Console opens the Add AWS Instance wizard, where you specify volume and storage information for the instance. You must supply your AWS key pair (and a Vertica Premium Edition license if you are adding more nodes to the cluster than a Community Edition license allows). You can add up to 10 instances at a time using the Add Instance action.
-
Restart Instance: Restart an individual instance in the cluster.
-
Terminate Instance: Permanently remove the instance from your cluster.
6.3.3 - Importing an existing database into MC
If you have already created a Vertica database, you can import it into MC to monitor its health and activity.
If you have already created a Vertica database, you can import it into MC to monitor its health and activity.
When you install MC on the same cluster as the existing database you intend to monitor, MC automatically discovers the cluster and any databases installed on it, whether those databases are currently running or are down.
Import a database existing on a monitored cluster
The following procedure describes how to import an existing database that is on a cluster MC is already monitoring.
-
Connect to Management Console and sign in as an MC administrator.
-
On the MC Home page, click View Your Infrastructure.
-
On the Databases and Clusters page, click the cluster and click View in the dialog box that opens.
-
On the left side of the page under the Databases heading, click Import Discovered.
Tip
A running database appears as Monitored; any non-running databases appear as Discovered. MC supports only one running database on a single cluster at a time. You must shut down a running database on a cluster in order to monitor another database on that cluster.
-
In the Import Database dialog box:
-
Select the database you want to import.
-
Optionally clear auto-discovered databases you don't want to import.
-
Supply the database administrator username and password and click Import. (Supplying a non-administrator username prevents MC from displaying some charts after import.)
-
If the Vertica database is configured for TLS security, you need to configure TLS for all Management Console connections to this database over JDBC. Click Use TLS. Management Console launches the Certificates wizard. See MC certificates wizard.
After Management Console connects to the database it opens the Manage page, which provides a view of the cluster nodes. See Monitoring Cluster Status for more information.
You perform the import process once per existing database. Next time you connect to Management Console, your database appears under the Recent Databases section on the Home page, as well as on the Databases and Clusters page.
Note
The system clocks in your cluster must be synchronized with the system that is running Management Console to allow automatic discovery of local clusters.
Import a database existing on a new cluster
If the database you intend to monitor is on a cluster MC is not currently monitoring, MC cannot automatically discover it. You can import it with the following procedure.
-
Connect to Management Console and sign in as an MC administrator.
-
On the MC Home page, click Import a Vertica Database Cluster.
-
Enter the IP address of one of the database's cluster nodes.
-
Enter the master API key for the cluster. Find the key here: /opt/vertica/config/apikeys.dat
-
In the Import Database dialog box:
-
Select the database you want to import.
-
Optionally clear auto-discovered databases you don't want to import.
-
Supply the database administrator username and password and click Import. (Supplying a non-administrator username prevents MC from displaying some charts after import.)
-
To configure TLS security for all Management Console connections to this database over JDBC, click Use TLS. Management Console launches the Certificates wizard. For instructions on completing the wizard, see Configuring TLS while importing a database on MC.
6.4 - Subclusters in MC
In Eon Mode databases, you can use subclusters (groups of nodes) to separate different workloads, to control how those workloads use resources, and to facilitate scaling your database up and down as workloads fluctuate.
In Eon Mode databases, you can use subclusters (groups of nodes) to separate different workloads, to control how those workloads use resources, and to facilitate scaling your database up and down as workloads fluctuate. This allows you to better manage your cloud resource expenses or data center resources. For an overview of subcluster concepts and how subclusters work, see Subclusters.
MC makes it easy to view and manage your subclusters. You can track how queries are performing and how well your subcluster resources are balanced. Using MC, you can use the information to adjust the number and size of your subclusters to improve your query throughput and system performance.
Visualizing your subclusters
The charts on the Database Overview page allow you to view and drill down into the resource usage of your database at any level. You can look at the resource usage of all nodes, or all subclusters, or individual subclusters. For details, see Charting subcluster resource usage in MC.
You can view statistics for the individual nodes in each subcluster in table format on the Database Manage page, in the Subclusters tab.
For a tour of the monitoring features of the Manage > Subclusters tab, see Viewing subcluster layout in MC.
Managing your subclusters
For Eon Mode databases, MC supports actions for subcluster and node management for the following public and private cloud providers:
Note
Enterprise Mode does not support subclusters.
For Enterprise Mode databases, MC supports these actions:
Note
In the cloud on GCP, Enterprise Mode databases are not supported.
To view and manage your subclusters, select your database from the MC Home page or the Databases and Clusters page. MC displays your database's Overview page. Select Manage at the bottom of the Overview page.
To view the Subclusters page, click the Manage > Subclusters tab:
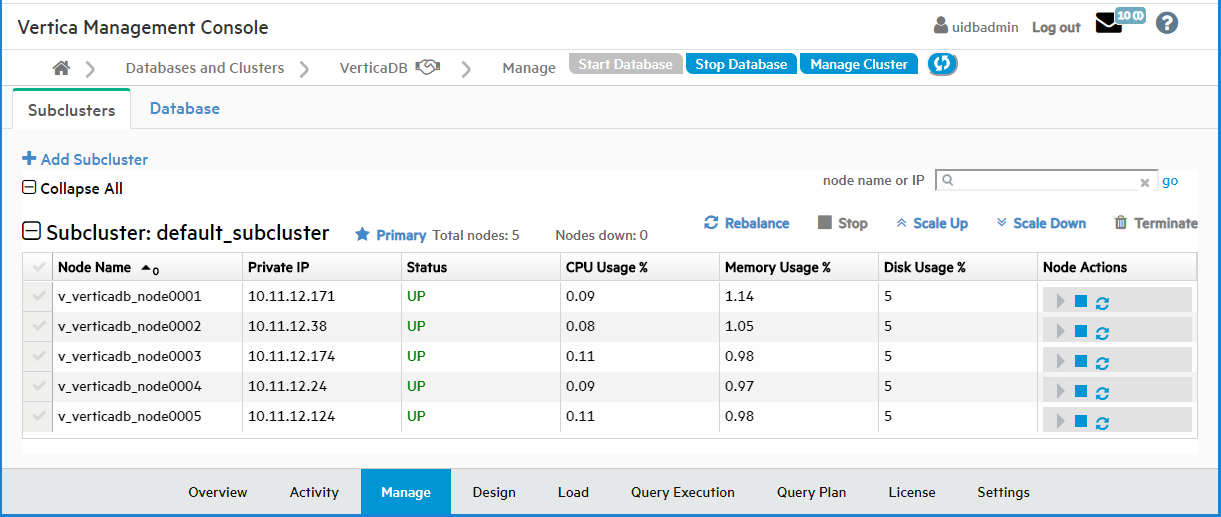
Eon Mode in the cloud
In Eon Mode on cloud platforms, you can use the Manage > Subclusters tab to add subclusters, rebalance your subclusters, stop and start subclusters, scale subclusters up or down, or terminate a subcluster. You can also stop or start a node, or restart a database node and its underlying instance.
Eon Mode on-premises
In Eon Mode on-premises, available subcluster and node actions behave a little differently than in the cloud, because your Vertica nodes reside on actual machines in your data center rather than on cloud instances.
Subcluster Actions in Eon Mode on Premises
-
In Eon Mode on-premises, you can use the Manage > Subclusters tab to add subclusters, rebalance your subclusters, or delete a subcluster.
-
You can add (create) a subcluster only if additional Vertica host machines are available.
-
When you delete a subcluster, MC deletes the subcluster from the database but does not delete the actual machines. MC stops the nodes in the subcluster, removes them from the subcluster, and deletes the subcluster. The Vertica host machines are then available to be added to other subclusters.
-
When you start or stop a subcluster in an Eon Mode database on-premises, MC starts or stops the subcluster nodes on the Vertica host machines, but not the machines themselves.
-
When you scale up a subcluster on-premises, the MC wizard displays a list of the available Vertica host machines that are not currently part of a database. You select the ones you want to add to the subcluster as nodes, then confirm that you want to scale up the subcluster.
When you scale down a subcluster on-premises, MC removes the nodes from the subcluster in the database, but does not terminate the Vertica host machines. The hosts are now available for scaling up other subclusters.
-
Scale Up displays the IP addresses of all available Vertica hosts that are not part of the database. The Scale Up button is grayed out if there are no Vertica hosts in the cluster that are not part of the database.
Node actions in Eon Mode on premises
When you start or stop a node on-premises, MC starts or stops the node in the database, but does not start or stop the Vertica host machine. The Restart Node action is not available for on-premises Eon Mode databases.
6.4.1 - Charting subcluster resource usage in MC
On the Database Overview page, in the CPU/Memory/Disk I/O chart and the Database General Pool Usage chart, you can use the dropdown in the title bar to focus the chart on:.
On the Database Overview page, in the CPU/Memory/Disk I/O chart and the Database General Pool Usage chart, you can use the dropdown in the title bar to focus the chart on:
-
All nodes in the database
-
All subclusters in the database
-
An individual subcluster, by name
For example, the CPU/Memory/Disk I/O chart dropdown allows you to choose the database nodes, one named subcluster, or all subclusters.
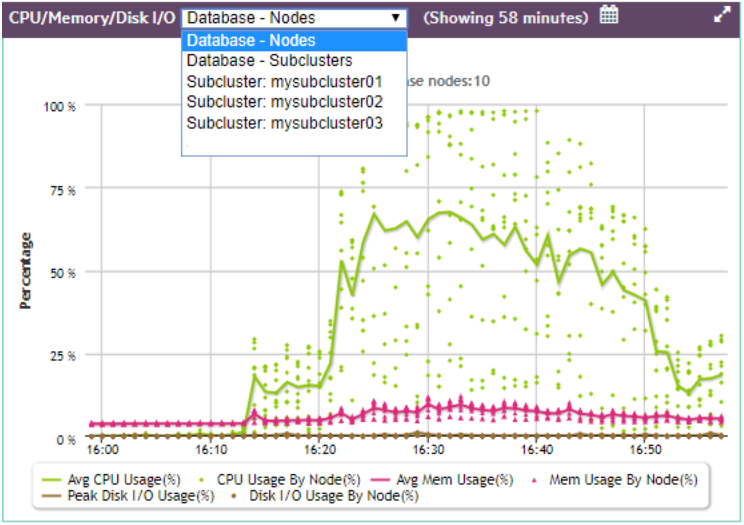
If you choose Database - Subclusters, the line in a given color represents the trend of all subclusters averaged together for that statistic, and each dot of the same color represents an individual subcluster at a certain time, for that same statistic.
For more in-depth information on how expand detail areas of charts and drill into the details, see Viewing the overview page.
6.4.2 - Viewing subcluster layout in MC
The MC Database Manage page displays two tabs, the Subclusters tab and the Database tab.
The MC Database Manage page displays two tabs, the Subclusters tab and the Database tab.
This topic describes the monitoring functions of the Subclusters tab. To monitor your subclusters, on the Subclusters tab you can view, sort, and search for subclusters and view their layout and statistics.
For information about using the Subclusters tab to make changes — adding, rebalancing, stopping and starting, scaling up or down, or terminating subclusters — see Subclusters in MC and its subtopics.
The Subclusters tab includes the following statistics in table form for the nodes in each subcluster:
-
Node name
-
Private IP address
-
Status (UP or DOWN)
-
CPU Usage %
-
Memory Usage %
-
Disk Usage %
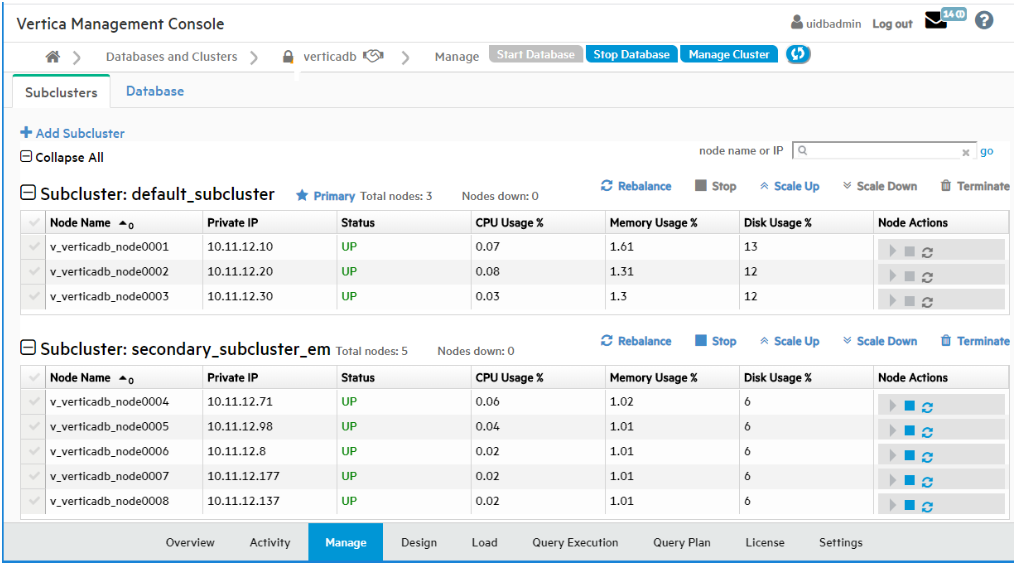
Searching for nodes
To find a particular node, enter its node name or IP address in the "node name or IP" search field at the top right of the Subclusters tab. Searching for nodes is especially helpful if your cluster is very large. To find a specific node, enter its complete node name or IP address. You can enter a partial node name or IP address to find all nodes whose name or IP address contains that string. For example, if you enter "240" in the search field, MC would find both of the following nodes:
Note
Wildcard characters are not supported in the search field.
Starting, stopping, or removing nodes
The right column provides icons for executing node actions. You can start, stop, or remove a node in the subcluster. Removing a node also removes it from the database. Only the Start, Stop, and Remove actions are available on this page. For details, see Starting, stopping, and restarting nodes in MC
Note
If you change the layout of your subcluster, for example by removing nodes, you must rebalance shards. See
REBALANCE_SHARDS.
Sorting nodes within a subcluster
You can sort the nodes within each subcluster by the values in any column, by clicking on the column heading.
Collapsing or expanding a subcluster, or the entire table
To collapse a subcluster section to one summary row, click the minus icon or the subcluster heading. To collapse the entire table to summary rows, click the minus icon or "Collapse All".
To expand a collapsed subcluster section, click the plus icon or the subcluster heading. To expand the entire table, click the plus icon or Expand All.
6.4.3 - Adding subclusters in MC
You can add a subcluster to an Eon Mode database on-premises or in the cloud, to provide your database with more compute power, and to separate workloads.
You can add a subcluster to an Eon Mode database on-premises or in the cloud, to provide your database with more compute power, and to separate workloads.
For more information about the rules governing subclusters, see Subclusters.
When you use MC to add an Eon Mode subcluster on a cloud platform, MC provisions the requested instances, configures them as nodes in your database cluster, and forms those nodes into a new subcluster.
You can add a second primary subcluster in order to stop the original primary. Be sure to make the replacement primary subcluster at least one node larger than the original. (If you make them the same size, they both count equally toward the quorum, and stopping either would violate the quorum, so you cannot stop either one. For more information, see Data integrity and high availability in an Eon Mode database.)
Amazon Web Services (AWS)
The following steps add a subcluster on AWS:
-
On the Manage > Subclusters tab, click Add Subcluster to open the Add Subcluster window.
-
On Enter AWS Credentials and preferences, some values might populate based on your current configuration. Accept the defaults or enter the following values:
-
AWS Region: Enter the same region as your cluster.
-
AWS Subnet: The subnet for your cluster. By default, Vertica creates your cluster in the same subnet as your MC instance.
Important
Use security groups and network access control lists (ACLs) to secure your subnet. For details, see the
Amazon documentation.
-
AWS Key Pair: Your Amazon key pair for SSH access to EC2 instances.
-
Select Next. On the Specify Subcluster Information screen, supply the following information:
-
Subcluster Name: Enter a name for your subcluster.
-
Subcluster type from the dropdown list. Select Primary or Secondary.
-
Number of instances in this subcluster: Select the number of nodes that you want in the subcluster. If you are using the free Community Edition license, you are limited to 3 nodes. If you enter a value greater than 3, you are prompted to enter an upgraded license to continue.
-
Vertica License: Click Browse to locate and upload your Vertica license key file.
If you do not supply a license key file here, the MC uses the Vertica Community Edition license. This license has a three node limit, so the value in Number of instances in this subcluster cannot be larger than 3 if you do not supply a license. See Managing licenses for more information.
-
Node IP setting: Choose a node IP setting. If you choose Public IP, the address is not persistent across instance stop and start.
-
Select Next. On the Specify cloud instance and data storage info screen, Database Depot Path is populated to match the original cluster configuration. Choose or enter a value in the following:
-
EC2 Instance Type: For recommended instance types, see Choosing AWS Eon Mode Instance Types. For a comprehensive list of Vertica supported instance types, see Supported AWS instance types.
-
Database Depot Path: This field is populated with the existing subcluster's depot path.
-
EBS Volume Type: This field is populated with the volume configuration defaults for the associated instance type. Select a new value to change the default.
-
EBS Volume Size (GB) per Volume per Available Node: This field is populated with the volume configuration defaults for the associated instance type. Enter a new value to change the default.
-
Select Next. On the Specify additional storage and tag info screen, the following fields are populated:
-
Database Catalog Path: The path to a persistent storage location.
-
Database Temp Path: The path to an ephemeral storage location if the node instance type includes the ephemeral storage option.
Under each path, there are EBS Volume Type and EBS Volume Size (GB) per Volume per Available Node fields that are populated with volume configuration defaults for the associated instance type. Select or enter a new value to change the default path.
-
Optionally, select Tag EC2 Instances to assign distinctive, searchable metadata tags to the instances in your new subcluster. Existing tags are displayed.
-
Select Next. On Review 'Add Subcluster' information, confirm the configuration details for your new subcluster.
-
Select Add Subcluster to create the subcluster.
After the subcluster is created, The Subcluster page displays. The MC automatically subscribes the nodes in your new subcluster to shards so that the nodes are ready to use.
The following steps add a subcluster on GCP:
-
On the Manage > Subclusters tab, click Add Subcluster to open the Add Subcluster window.
-
On Specify Subcluster Information, supply the following information:
-
Subcluster Name: Enter a name for your subcluster.
-
Subcluster type from the dropdown list. Select Primary or Secondary.
-
Number of instances in this subcluster: Select the number of nodes that you want in the subcluster. If you are using the free Community Edition license, you are limited to 3 nodes. If you enter a value greater than 3, you are prompted to enter an upgraded license to continue.
-
Vertica License: Click Browse to locate and upload your Vertica license key file.
If you do not supply a license key file here, the MC uses the Vertica Community Edition license. This license has a three node limit, so the value in Number of instances in this subcluster cannot be larger than 3 if you do not supply a license. See Managing licenses for more information.
-
Node IP setting: Choose a node IP setting. If you choose Public IP, the address is not persistent across instance stop and start.
-
Select Next. Cluster configuration might take a few minutes.
-
On Specify cloud instance and depot storage info, supply the following information:
-
Select Next. On Specify additional storage and label info, supply the following:
-
Database Catalog Path: The path to a persistent storage location.
-
Disk Type: Volume type for the database catalog.
-
Size (GB) per Available Node: Volume size for the database catalog.
-
Database Temp Path: The path to an ephemeral storage location if the node instance type includes the ephemeral storage option.
-
Disk Type: Volume type for the database temp storage location.
-
Size (GB) per Available Node: Volume size for the database temp storage location.
-
Label Instances: Optional. Assign distinctive, searchable metadata tags to the instances in your new subcluster. Existing tags are displayed.
-
Select Next. On Review Information, confirm the configuration details for your new subcluster, and accept the terms and conditions.
-
Select Add Subcluster to create the subcluster.
After the subcluster is created, The Subcluster page displays. The MC automatically subscribes the nodes in your new subcluster to shards so that the nodes are ready to use.
Microsoft Azure
The following steps add a subcluster on Azure:
-
On the Manage > Subclusters tab, click Add Subcluster to open the Add Subcluster window.
-
On Specify Subcluster Information, supply the following information:
-
Subcluster Name: Enter a name for your subcluster.
-
Subcluster type from the dropdown list. Select Primary or Secondary.
-
Number of instances in this subcluster: Select the number of nodes that you want in the subcluster. If you are using the free Community Edition license, you are limited to 3 nodes. If you enter a value greater than 3, you are prompted to enter an upgraded license to continue.
-
Vertica License: Click Browse to locate and upload your Vertica license key file.
If you do not supply a license key file here, the MC uses the Vertica Community Edition license. This license has a three node limit, so the value in Number of instances in this subcluster cannot be larger than 3 if you do not supply a license. See Managing licenses for more information.
-
Node IP setting: Choose a node IP setting. If you choose Public IP, the address is not persistent across instance stop and start.
-
Select Next. Cluster configuration might take a few minutes.
-
On Specify cloud instance and depot storage info, supply the following information:
-
Virtual Machine (VM) Size: Select the instance type. For a comprehensive list of Vertica supported instance types, see Recommended Azure VM types and operating systems.
-
Database Depot Path: This value is populated to match the original cluster configuration.
-
Managed Disk Volume Type: Volume type for each node. This value is populated with the volume configuration defaults for the associated instance type.
-
Managed Disk Volume Size (GB) per Volume per Available Node: Volume size for each node. This value is populated with the volume configuration defaults for the associated instance type.
-
Select Next. On Specify additional storage and label info, supply the following:
-
Database Catalog Path: The path to a persistent storage location.
-
Managed Disk Volume Type: Volume type for the database catalog.
-
Managed Disk Volume Size (GB) per Available Node: Volume size for the database catalog.
-
Database Temp Path: The path to an ephemeral storage location if the node instance type includes the ephemeral storage option.
-
(E16_v4 VMs only) Managed Disk Volume Type: Volume type for the database temp storage location.
-
(E16_v4 VMs only) Managed Disk Volume Size (GB) per Available Node: Volume size for the database temp storage location.
-
Label Instances: Optional. Assign distinctive, searchable metadata tags to the instances in your new subcluster. Existing tags are displayed.
-
Select Next. On Review Information, confirm the configuration details for your new subcluster.
-
Select Add Subcluster to create the subcluster.
After the subcluster is created, The Subcluster page displays. The MC automatically subscribes the nodes in your new subcluster to shards so that the nodes are ready to use.
On-premises
For an Eon Mode database on-premises, you can use MC to create additional subclusters. MC displays all available Vertica hosts that are not part of the database. It configures the ones you select to become the nodes in the new subcluster in your database.
-
On the Manage > Subclusters tab, click Create Subcluster at top left. MC opens the Create Subcluster wizard.
-
In the first screen, respond in the following fields:
-
**Subcluster Name:**Enter a name for the new subcluster.
-
**Subcluster type dropdown (unlabeled):**Select Primary or Secondary.
-
**Select nodes that will be added to a subcluster:**Select from the list of IP addresses. MC displays all available Vertica hosts within the cluster that are not currently members of a database.
-
**Confirmation:**Click the Confirmation check box to indicate that you want to create the named subcluster, to include the Vertica hosts you selected as nodes.
-
After you click the Confirmation check box, the Proceed button becomes active. Click Proceed.
MC displays a progress screen while it creates the requested subcluster. Wait for all steps to complete.
See also
Subcluster action rules in MC
6.4.4 - Rebalancing data using Management Console
Vertica can rebalance your subcluster when you add or remove nodes.
Vertica can rebalance your subcluster when you add or remove nodes. If you notice data skew where one node shows more activity than another (for example, most queries processing data on a single node), you can manually rebalance the sublcluster using MC if the database is imported into the MC interface.
On the Management Console Manage page in the Subclusters tab, click Rebalance above the subcluster to initiate the rebalance operation.
During a rebalance operation, you cannot perform any other activities on the database, such as start, stop, add, or remove nodes.
6.4.5 - Subcluster action rules in MC
The table below summarizes when each subcluster action is available for the primary subcluster or a secondary subcluster.
The table below summarizes when each subcluster action is available for the primary subcluster or a secondary subcluster.
For Eon Mode databases, MC supports actions for subcluster and node management for the following public and private cloud providers:
Note
Enterprise Mode does not support subclusters.
In the cloud
The explanations in this table apply to subcluster actions in the cloud. For the differences on-premises, see On-Premises further below.
|
Subcluster Action |
Primary Subcluster |
Secondary Subcluster |
|
Add Subcluster |
Allowed.
Must include at least one node. The subcluster cannot be empty.
Vertica recommends having only one primary subcluster.
You can add a second primary subcluster in order to stop the original primary. Be sure to make the replacement primary subcluster at least one node larger than the original. (If you make them the same size, they both count equally toward the quorum, and stopping either would violate the quorum, so you cannot stop either one. For more information, see Data integrity and high availability in an Eon Mode database.)
|
Allowed. Creates a new subcluster.
Provisions cloud instance(s).
Adds nodes to that subcluster.
Defaults to minimum of one node.
|
|
Rebalance
- This button applies to shard subscriptions in Eon Mode.
|
Always allowed.
Note
When you scale down a subcluster, Vertica rebalances the shards automatically, whereas when you scale up a subcluster, you must rebalance the shards yourself.
|
Always allowed.
See note for primary subcluster.
|
|
Start Subcluster
- Includes starting cloud instances if not already running.
|
Available if primary subcluster is stopped. |
Available if:
|
|
Stop Subcluster
- Includes stopping cloud instances.
|
Stop Subcluster is available for the primary subcluster only under certain conditions:
-
Theprimary subcluster must be running.
-
One or more additional primary subclusters must exist in the database.
-
It must be true that stopping this primary subcluster will shut down less than 50% of the primary nodes in the database.
|
Available if running. |
|
Scale Up
- Adds cloud instances which become added nodes.
|
Always allowed.
- Vertica adds nodes that are the same instance type as the existing nodes that are already in the target subcluster.
|
Always allowed. |
|
Scale Down
-
Removes nodes.
-
Terminates instances.
|
Allowed only under the following conditions:
-
If K-safety is >= 1, the remaining number of nodes after scaling down the primary subcluster must be >= 3.
-
The number of nodes you remove must be fewer than half the nodes.
|
Same as for primary. |
|
Terminate Subcluster
|
Available if another primary subcluster exists in the database. |
Always allowed.
- Removes subcluster entry from SUBCLUSTERS table.
|
On-premises
When you start or stop a subcluster in an Eon Mode database on-premises, MC starts or stops the subcluster nodes on the Vertica host machines, but not the machines themselves.
When you scale up a subcluster on-premises, the MC wizard displays a list of the available Vertica host machines that are not currently part of a database. You select the ones you want to add to the subcluster as nodes, then confirm that you want to scale up the subcluster.
When you scale down a subcluster on-premises, MC removes the nodes from the subcluster in the database, but does not terminate the Vertica host machines. The hosts are now available for scaling up other subclusters.
6.4.6 - Starting and stopping subclusters in MC
On the Manage > Subclusters tab, the tool bar displays the available subcluster actions above each subcluster.
For Eon Mode databases, MC supports actions for subcluster and node management for the following public and private cloud providers:
Note
Enterprise Mode does not support subclusters.
On the Manage > Subclusters tab, the tool bar displays the available subcluster actions above each subcluster. For example, the screen capture below shows the available actions for the default subcluster, which is also the primary subcluster: Rebalance, Stop (grayed out), Scale Up, Scale Down, and Terminate (grayed out).
Note
Terminate Subcluster is available for Eon Mode databases only in the cloud, not on premises.
Why are some actions grayed out?
Stop and Terminate are grayed out in this example because if you stopped or terminated the only primary subcluster, the database would shut down. For each subcluster, Stop displays if the subcluster is currently running, or Start displays if the subcluster is currently stopped. Both Stop and Terminate are grayed out if their execution would be unsafe for the database.
Starting a subcluster in the cloud
You can start any subcluster that is currently stopped.
-
In the Manage > Subclusters tab, locate the subcluster you want to start.
-
Just above it on the right, click Start.
-
In the Start Subcluster screen, click the check box to confirm you want to start the subcluster.
MC displays a progress screen while the startup tasks are executing.
-
When all the tasks are checked, click Close.
The Manage > Subclusters tab shows that your subcluster is started and its nodes are up.
Stopping a subcluster in the cloud
Important
Stopping a subcluster does not warn you if there are active user sessions connected to the subcluster. This behavior is the same as stopping an individual node. Before stopping a subcluster, verify that no users are connected to it.
You can stop a primary subcluster only if there is another primary subcluster in the database with node count greater at least by 1 node, to maintain K-safety.
You can add a second primary subcluster in order to stop the original primary. Be sure to make the replacement primary subcluster at least one node larger than the original. (If you make them the same size, they both count equally toward the quorum, and stopping either would violate the quorum, so you cannot stop either one. For more information, see Data integrity and high availability in an Eon Mode database.)
You can stop a secondary subcluster anytime, to save money on cloud resources.
-
In the Manage > Subclusters tab, locate the subcluster you want to stop.
If the Stop button is displayed but grayed out, you cannot stop this subcluster because doing so would shut down the database.
-
Just above the subcluster on the right, click Stop.
-
In the Stop Subcluster window, click the check box to confirm you want to stop the subcluster.
MC displays a progress screen while the subcluster stopping tasks are executing.
-
When all the tasks are checked, click Close.
The Manage > Subclusters tab shows that your subcluster is stopped and its nodes are down.
Starting or stopping a subcluster on premises
When you start or stop a subcluster in an Eon Mode database on-premises, MC starts or stops the subcluster nodes on the Vertica host machines, but not the machines themselves.
See also
Subcluster action rules in MC
6.4.7 - Scaling subclusters in MC
You can scale an Eon Mode subcluster up or down, to increase or decrease the number of nodes in the subcluster.
You can scale an Eon Mode subcluster up or down, to increase or decrease the number of nodes in the subcluster. This lets you add compute capacity when you need it, and reduce it to save money or redirect resources when you don't.
For Eon Mode databases, MC supports actions for subcluster and node management for the following public and private cloud providers:
Note
Enterprise Mode does not support subclusters.
Scaling up in the cloud
When you scale up a subcluster, MC adds one or more cloud instances to your database cluster as hosts, and adds them to your subcluster as nodes.
-
On the Manage > Subclusters tab, click Scale Up immediately above the subcluster you want to enlarge. MC launches the Scale Up wizard.
-
Wait a moment or two while MC pre-populates the fields on the Enter AWS Credentials and preferences screen with your credentials, then click Next.
-
On the Specify Subcluster information screen, enter the number of instances you want to add to the subcluster in Number of Instances to Add. MC pre-populates the number of existing hosts in the cluster.
-
Click Browse and select your Vertica license to insert in the license field, then click Next.
-
The Specify cloud instance and data storage info screen has fields that specify the cloud instance and data storage information. MC sets all the fields to the same values as the existing instances in your subcluster. Select Next to accept the existing values.
-
The Specify additional storage and tag info screen displays any tags you specified for your instances when you created the database cluster. You can use the same tags for the instances you are adding, or use the fields on the screen to add new tags for these instances. You can keep and apply or delete the existing tags. If you delete tags, they are not used for the instances you are adding now. When you are done modifying the tags, click Next.
-
MC displays the Review 'Scale Up' information screen for your approval. If the information is correct, click Scale Up to add the instances to the subcluster.
-
Wait until all operations on the progress screen show check marks, then click Close.
Scaling down in the cloud
When you scale down a subcluster, MC removes the requested number of nodes from the subcluster, and removes their hosts from the database cluster. It then terminates the underlying cloud instances. Scaling down a subcluster is allowed only when doing so will not cause the database to shut down.
For details on when Scale Down is or is not available for a subcluster, see Subcluster action rules in MC.
-
On the Manage > Subclusters tab, click Scale Down above the subcluster to launch the Scale Down page:
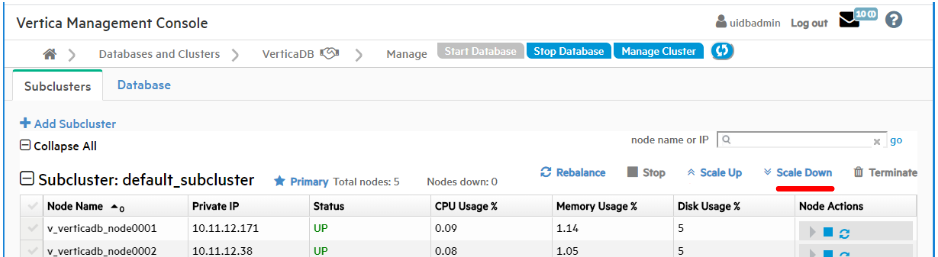
-
In the Number of hosts to remove field, enter the number of hosts you would like to remove from the subcluster.
-
Under Confirmation, click the checkbox to affirm that you want to scale down the named subcluster, and terminate the instances the nodes were using.
-
Click Scaledown Subcluster.
The scale down operation may take a little time. When it finishes, the progress screen displays the details about the removed nodes and their hosts and the terminated instances.
-
When all steps show check marks, click Close.
Note
If you import a cloud-hosted subcluster into MC, scale up and scale down operations are not supported.
Scaling on-premises
When you scale up a subcluster on-premises, the MC wizard displays a list of the available Vertica host machines that are not currently part of a database. You select the ones you want to add to the subcluster as nodes, then confirm that you want to scale up the subcluster.
When you scale down a subcluster on-premises, MC removes the nodes from the subcluster in the database, but does not terminate the Vertica host machines. The hosts are now available for scaling up other subclusters.
6.4.8 - Terminating subclusters in MC
The Terminate action for subclusters is available for Eon Mode databases only in the cloud.
For Eon Mode databases, MC supports actions for subcluster and node management for the following public and private cloud providers:
Note
Enterprise Mode does not support subclusters.
In the cloud
The Terminate action for subclusters is available for Eon Mode databases only in the cloud.
You can terminate any subcluster that will not cause the database to go down. You can terminate:
Terminate a subcluster
-
On the Manage > Subclusters tab, click Terminate immediately above the target subcluster.
-
In the Terminate Subcluster window, click the check box to confirm you want to delete the chosen subcluster and terminate its instances.
-
Click Terminate Subcluster.
MC displays a progress window that shows the steps it is executing to terminate the subcluster.
-
When all the steps are checked, click Close.
On-premises
The Terminate action for subclusters is not available for Eon Mode on-premises. You can stop a subcluster on-premises, provided doing so will not bring down the database. You cannot terminate a subcluster on-premises, because terminating a subcluster stops the nodes and then terminates the cloud instances those nodes reside on. MC cannot terminate on-premises Vertica host machines.
To free up some of the Vertica host machines in an on-premises subcluster, scale down the subcluster.
See also
Subcluster action rules in MC
6.4.9 - Node action rules in MC
The table below summarizes when each node action is available for nodes in the primary subcluster or in a secondary subcluster.
The table below summarizes when each node action is available for nodes in the primary subcluster or in a secondary subcluster.
For Eon Mode databases, MC supports actions for subcluster and node management for the following public and private cloud providers:
Note
Enterprise Mode does not support subclusters.
For Enterprise Mode databases, MC supports these actions:
Note
In the cloud on GCP, Enterprise Mode databases are not supported.
|
Node Action |
Primary Subcluster |
Secondary Subcluster |
|
Start Node
Starts instance if needed.
|
Always allowed. |
Always allowed. |
|
Stop Node
Stops the instance on a cloud platform.
|
-
Allowed when K-safety is >=1. After the node is stopped, there must be 3 or more remaining UP nodes.
-
Not allowed when K-safety is 0.
|
-
Allowed when K-safety is >=1. After the node is stopped, there must be 3 or more remaining UP nodes.
-
Allowed when K-safety is 0.
|
|
Restart Node |
|
|
|
The Remove Node action has been deleted from existing actions for all nodes. Use Scale Down subcluster instead. |
When you start or stop a node on-premises, MC starts or stops the node in the database, but does not start or stop the Vertica host machine. The Restart Node action is not available for on-premises Eon Mode databases.
See also
Starting, stopping, and restarting nodes in MC
6.4.10 - Starting, stopping, and restarting nodes in MC
In MC you can start, stop, and restart nodes in a subcluster in your database.
In MC you can start, stop, and restart nodes in a subcluster in your database. This allows you to tailor the amount of compute power you are using to the current demands for the workload assigned to that subcluster.
For Eon Mode databases, MC supports actions for subcluster and node management for the following public and private cloud providers:
Note
Enterprise Mode does not support subclusters.
For Enterprise Mode databases, MC supports these actions:
Note
In the cloud on GCP, Enterprise Mode databases are not supported.
On the Manage > Subcluster page in the right column, the Node Actions column displays icons that let you start, stop, or restart a node and the underlying cloud machine. Hover over an icon to read the action it performs. If an icon is grayed out, that action is not available for that node.
-
Start Node. Start an individual node in the subcluster.
-
Stop Node. Stop an individual node in the subcluster.
-
Restart Node (GCP only). Restart an individual node in the subcluster.
See also
Node action rules in MC
6.5 - Eon Mode on-premises
6.5.1 - Reviving an Eon Mode database on premises with FlashBlade using MC
An
Eon Mode database keeps an up-to-date version of its data and metadata in its communal storage location. After a cluster hosting an Eon Mode database is terminated, this data and metadata continue to reside in communal storage. When you revive the database later, Vertica uses the data in this location to restore the database in the same state on a newly provisioned cluster.
(For details on how to stop or terminate a cluster using Management Console, see Viewing and managing your cluster.)
Prerequisites
You can revive a terminated Eon Mode database on premises that uses a Pure Storage FlashBlade appliance as its communal storage location if you have the following facts available:
-
The endpoint IP address of the FlashBlade.
-
The endpoint port for the FlashBlade.
-
The access key and secret key for FlashBlade.
-
The S3 URL for the FlashBlade.
-
The name of the stopped database stored on the FlashBlade, that you wish to revive.
Revive an Eon Mode database from communal storage on FlashBlade
-
On the MC Infrastructure page, click the box for the cluster you wish to revive. MC displays a pop-up with cluster details and action buttons.
-
Click Revive Database. MC launches the Revive an Eon Mode Database wizard.
-
In the S3 Communal Storage Information screen, enter the following fields, then click Next:
|
S3-compatible End Point IP |
The IP address of the Pure Storage FlashBlade appliance. |
|
End Point IP |
The port for the FlashBlade. |
|
Access ID |
The access key for the FlashBlade. |
|
Secret Key |
The secret key for the FlashBlade. |
-
When you click Next, MC validates your credentials. If validation is successful, MC reads the list of S3 buckets on the end point (the FlashBlade).
-
In the Path for Database Communal Location screen, enter the following field , then click Discover.
|
S3 path for Communal Storage of database(s) |
Enter the complete S3 bucket URL for the database you wish to revive, in the following format:
s3://bucket-name/subfolder-name
|
-
MC populates the table under the Discover button with the database names and complete S3 URLs of all the databases it finds on the S3 location.
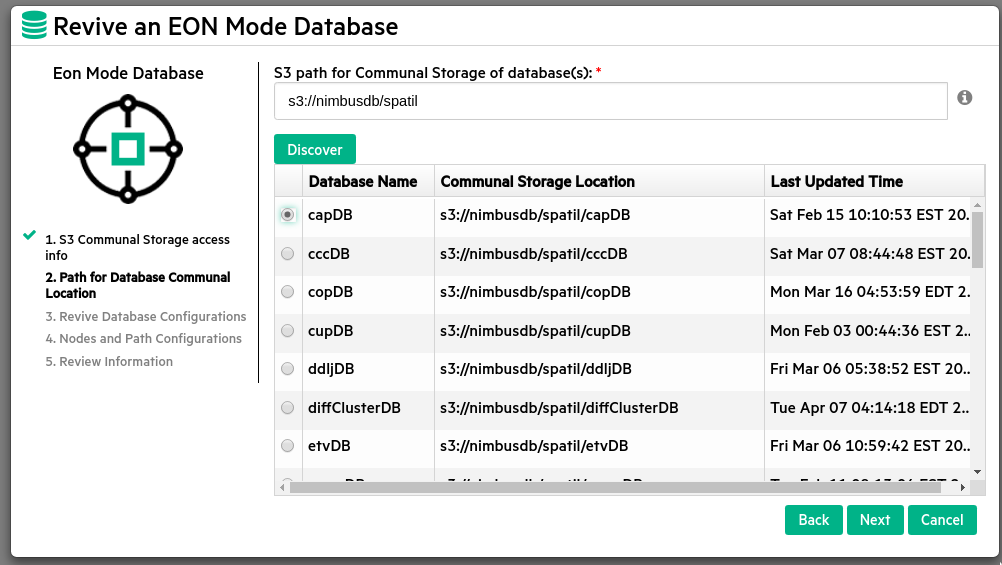
-
Click the radio button for the database you want to revive, then click Next.
-
In the Details of Selected Database to Revive screen, MC pre-fills most of the fields. Enter and confirm your password:
|
Vertica Database Name |
Database name is pre-entered. |
|
Original Database Version |
Database Vertica version is pre-filled. |
|
Cluster Vertica Version |
Cluster Vertica version is pre-filled. |
|
Database size |
Number of nodes is pre-filled. |
|
Original Vertica Database Super User Name |
Database super user name is pre-filled. |
|
Password |
Enter the database password. |
|
Confirm Password |
Re-enter the password to confirm. |
-
MC validates the information. If validation is successful, the Next button changes from grayed out to active. Click Next.
-
In the Eon Mode Database screen, select the IP addresses of the nodes in the cluster on which you wish to revive the database. MC fills in the Number of Nodes field and displays the catalog path and depot path that were configured for the database when it was created.
-
In the Temp Path field, enter the complete path for the Temp directory. Then click Next.
-
MC displays the S3 Provider Details screen with a summary of all the information you have entered to revive the database. Review the information to verify it is correct. Then click Revive Database.
-
MC displays a progress screen indicating the database revival tasks that have been completed and the overall percentage of the revival that is complete. Wait until the revive is 100% complete, then click Close.
When the work is complete, Vertica displays the MC landing page.
6.5.2 - Creating an Eon Mode database on premises with FlashBlade in MC
This topic describes how to create an Eon Mode database using only on-premises machines, with Pure Storage FlashBlade as the communal storage reservoir, using Management Console.
This topic describes how to create an Eon Mode database using only on-premises machines, with Pure Storage FlashBlade as the communal storage reservoir, using Management Console.
Step 1: create a bucket and credentials on the Pure Storage FlashBlade
To use a Pure Storage FlashBlade appliance as a communal storage location for an Eon Mode database you must have:
-
The IP address of the FlashBlade appliance. You must also have the connection port number if your FlashBlade is not using the standard port 80 or 443 to access the bucket. All of the nodes in your Vertica cluster must be able to access this IP address. Make sure any firewalls between the FlashBlade appliance and the nodes are configured to allow access.
-
The name of the bucket on the FlashBlade to use for communal storage.
-
An access key and secret key for a user account that has read and write access to the bucket.
See the Pure Storage support site for instructions on how to create the bucket and the access keys needed for a communal storage location.
Install and configure Management Console on one of the on-premises machines.
Step 3: create or import a Vertica cluster
In MC, create a Vertica cluster on a group of on-premises machines, or import a previously created cluster to MC.
Step 4: create an Eon Mode database with FlashBlade as communal storage
Create an Eon Mode database on the on-premises cluster, using Pure Storage FlashBlade as your S3-compatible communal storage, as explained below.
-
In MC on the Infrastructure page, click the square for the specific cluster where you want to create the database. MC displays a pop-up with cluster details and action buttons.
-
Click Create Database. MC launches the Create a New Database wizard.
-
In the Vertica Database Mode screen, click the icon for Eon Mode Database, then click Next.
-
In the S3 Communal Storage Information screen, enter the following information, then click Next:
|
S3-compatible End Point IP |
Enter the IP address of the Pure Storage FlashBlade appliance. |
|
End Point Port |
Enter the port of the FlashBlade appliance for a valid connection with the Management Console (80 for an unencrypted connection or 443 for an encrypted connection). |
|
Access ID |
Enter the access key for the FlashBlade. |
|
Secret Key |
Enter secret key for the FlashBlade. |
|
Communal Location URL |
Enter a communal location URL beginning with s3:// that points to the third-party storage appliance you will be using, for example Pure Storage FlashBlade. For example, s3://bucket/subfolder or s3://bucket/folder/subfolder. The bucket must already exist, and the subfolder must not exist. |
-
In the Database Parameters screen, enter these fields, then click Next:
|
Database Name |
Enter 1-30 letters, numbers, and underscores. The first character must be alphabetic. |
|
Password |
Enter a new administrator password for the new Eon Mode database. Allowed characters: Alphanumeric (letters and digits) and ASCII special characters. Maximum is 100 characters. |
|
Confirm Password |
Enter the same password again to confirm it. |
|
Port |
Currently, Vertica supports only port 5433. |
|
Catalog Path |
Enter the directory path for the catalog of the Eon Mode database. The catalog should always reside on persistent storage. This path must exist on the host machines. If the path does not exist on the host machines you must create it manually before specifying it in this wizard. |
|
Depot Path |
Enter the directory path for the Eon Mode depot. MC populates the depot with recently used data. Queries that find their data in the depot get better performance. The directory must exist on the filesystem that was mounted during cluster creation. If the path does not exist on the host machines you must create it manually before specifying it in this wizard. |
|
Depot Size |
Enter the percentage of total disk space to use for the Eon Mode depot. The default is 60% of available disk. The maximum is 99,999T, or the equivalent in G or M units. |
|
Temp Path |
Directory path to use for temp data. This path must exist on the host machines. If the path does not exist on the host machines you must create it manually before specifying it in this wizard. For Temp, you may want to use a scratch disk. |
-
In the Specify Node Preferences screen, select the IP addresses of the hosts for the database nodes. Then enter these fields, and click Next:
|
Number of nodes selected for the database |
This value is set automatically. Always equal to the number of IP addresses you select. |
|
Data Segmentation Shards |
The number of shards is the number of segments that the data will be divided into in communal storage. For best performance, Vertica recommends you choose a number of shards that is a multiple of the number of nodes in the database. Vertica requires a minimum of 1 and allows a maximum of 960 shards. A good strategy is to choose an even number divisible by multiple factors. Consider the future growth of your database, as Vertica requires that the number of nodes be no greater than the number of shards, and you add nodes later but you cannot change the number of shards later. |
-
MC displays a confirmation screen labeled S3 Provider Details, that summarizes all of your choices for configuring the Eon database. Verify the details are correct, then click Create Database.
-
MC creates the database, displaying a progress indicator screen. Wait for all steps to complete, which may take several minutes.
When the work is complete, navigate to the MC landing page to use your new database.
6.6 - Managing queries using MC
Management Console allows you to view the query plan of an active query or a manually entered query specified by the user.
Management Console allows you to view the query plan of an active query or a manually entered query specified by the user.
-
On the MC Home Page, click the database you want to view the Overview page.
-
Select the Activity tab to view the query activity.
-
Click the Explain tab to access the query plan.
See Working with query plans in MC and Accessing query plans in Management Console for further information.
Management Console provides two options for viewing the query plan: Path Information and Tree Path. For details on each, refer Query plan view options.
Additionally, you can also Viewing projection and column metadata using the MC Explain tab.
See also
6.6.1 - About profile data in Management Console
After you profile a specific query, the Management Console Explain page displays profile data like query duration, projection metadata, execution events, optimizer events, and metrics in a pie chart.
After you profile a specific query, the Management Console Explain page displays profile data like query duration, projection metadata, execution events, optimizer events, and metrics in a pie chart.
See the following links for more information on the kinds of profile data you can review on the Management Console Explain page:
6.6.1.1 - Projection metadata
To view projection metadata for a specific projection, click the projection name in the EXPLAIN output.
To view projection metadata for a specific projection, click the projection name in the EXPLAIN output. Metadata for that projection opens in a pop-up window.
To view projection data for all projections accessed by that query, click the View Projection Metadata button at the top of the Explain page. The metadata for all projections opens in a new browser window.
Note
If the View Projection Metadata button is not enabled, click Profile to retrieve the profile data, including the projection metadata.
The projection metadata includes the following information:
-
Projection ID
-
Schema name
-
Whether or not it is a superprojection
-
Sort columns
-
IDs of the nodes the projection is stored on
-
Whether or not it is segmented
-
Whether or not it is up to date
-
Whether or not it has statistics
-
Owner name
-
Anchor table name
To display a SQL script that can recreate the projection on a different cluster, click Click to get export data. This script is identical to the output of the EXPORT_OBJECTS function. The SQL script opens in a pop-up window.
Copy and paste the command from this window, and click Close.
6.6.1.2 - Query phase duration
This pie chart appears in the upper-right corner of the Query Plan window.
This pie chart appears in the upper-right corner of the Query Plan window. It shows what percentage of total query processing was spent in each phase of processing the query.
The phases included in the pie chart (when applicable) are:
Hover over the slices on the pie chart or over the names of the phases in the box to get additional information. You can see the approximate number of milliseconds (ms) and percentage used during each phase.
Note
The time data in the profile metrics might not match the times in the query phase duration. These times can differ because the query phase duration graph uses the longest execution time for a given phase from all the nodes. Network latency can add more data, which is not taken into account in these calculations.
6.6.1.3 - Profile metrics
In the Path Information view, the area to the right of each query path contains profile metrics for that path.
In the Path Information view, the area to the right of each query path contains profile metrics for that path.
-
Disk—Bytes of data accessed from disk by each query path. If none of the query paths accessed the disk data, all the values are 0.
-
Memory—Bytes of data accessed from memory by each query path.
-
Sent—Bytes of data sent across the cluster by each query path.
-
Received—Bytes of data received across the cluster by each query path.
-
Time—Number of milliseconds (ms) that the query path took to process on a given node, shown on progress bars. The sum of this data does not match the total time required to execute the query. This mismatch occurs because many tasks are executed in parallel on different nodes.
Hover over the progress bars to get more information, such as total bytes and percentages.
Note
The time data in the profile metrics might not match the times in the
Query phase duration chart. These times can differ because the query phase duration graph uses the longest execution time for a given phase from all the nodes. Network latency can add more data, which is not taken into account in these calculations.
6.6.1.4 - Execution events
To help you monitor your database system, Vertica logs significant events that affect database performance and functionality.
To help you monitor your database system, Vertica logs significant events that affect database performance and functionality. Click View Execution Events to see information about the events that took place while the query was executing.
If the View Execution Events button is not enabled, click Profile to retrieve the profile data, including the execution events.
The arrows on the header of each column allow you to sort the table in ascending or descending order of that column.
The execution events are described in the following table.
|
Event Characteristic |
Details |
|
Time |
Clock time when the event took place. |
|
Node Name |
Name of the node for which information is listed. |
|
Session ID |
Identifier of the session for which profile information is captured. |
|
User ID |
Identifier of the user who initiated the query. |
|
Request ID |
Unique identifier of the query request in the user session. |
|
Event Type |
Type of event processed by the execution engine. For a list of events and their descriptions, see Initial process for improving query performance. |
|
Event Description |
Generic description of the event. |
|
Operator Name |
Name of the Execution Engine component that generated the event. Examples include but are not limited to:
-
DataSource
-
DataTarget
-
NetworkSend
-
NetworkRecv
-
StorageUnion
Values from the Operator name and Path ID columns let you tie a query event back to a particular operator in the query plan. If the event did not come from a specific operator, then this column is NULL.
|
|
Path ID |
Unique identifier that Vertica assigns to a query operation or a path in a query plan. If the event did not come from a specific operator, this column is NULL. |
|
Event OID |
A unique ID that identifies the specific event. |
|
Event Details |
A brief description of the event and details pertinent to the specific situation. |
|
Suggested Action |
Recommended actions (if any) to improve query processing. |
6.6.1.5 - Optimizer events
To help you monitor your database system, Vertica logs significant events that affect database performance and functionality.Click View Optimizer Events to see a table of the events that took place while the optimizer was planning the query.
To help you monitor your database system, Vertica logs significant events that affect database performance and functionality.Click View Optimizer Events to see a table of the events that took place while the optimizer was planning the query.
If the View Optimizer Events button is not enabled, click Profile to retrieve the profile data, including the optimizer events.
The arrows on the header of each column allow you to sort the table in ascending or descending order of that column.
The following types of optimizer events may appear in the table:
|
Event characteristic |
Details |
|
Time |
Clock time when the event took place. |
|
Node Name |
Name of the node for which information is listed. |
|
Session ID |
Identifier of the session for which profile information is captured. |
|
User ID |
Identifier of the user who initiated the query. |
|
Request ID |
Unique identifier of the query request in the user session. |
|
Event Type |
Type of event processed by the optimizer. |
|
Event Description |
Generic description of the event. |
|
Event OID |
A unique ID that identifies the specific event. |
|
Event Details |
A brief description of the event and details pertinent to the specific situation. |
|
Suggested Action |
Recommended actions (if any) to improve query processing. |
6.6.2 - Profiling queries using MC
Management Console allows you to view profile data for a query.
Management Console allows you to view profile data for a query.
-
On the MC Home Page, click the database to view the Overview page.
-
Click the Explain tab to perform tasks related to profiling a query.
See Viewing profile data in MC for further details.
On the Explain tab, you can view the following profile data using MC:
You can use any of the four different formats to view the profile data:
-
Path Information view
-
Query Drilldown view
-
Tree Path view
-
Profile Analysis view
See Viewing different profile outputs for detailed explanation of each view.
Additionally, Management Console supports different color codes for viewing the progress of profiling a query. For an explanation of these color codes, see Monitoring profiling progress.
See also
6.6.3 - Viewing profile data in MC
Management Console allows you to view profile data about a single query.
Management Console allows you to view profile data about a single query. You can:
-
Review the profile data in multiple views
-
View details about projection metadata, execution events, and optimizer events
-
Identify how much time was spent in each phase of query execution and which phases took the most amount of time
After you select the database you want to use, you can view the profile data using Management Consolein either of two ways:
- Focus on specific areas of database activity, such as spikes in CPU usage
- Review the profile data for a specific query
To focus on specific areas of database activity:
-
At the bottom of the Management Console window, click the Activity tab.
-
From the list at the top of the page, select Queries.
-
On the activity graph, click the data point that corresponds to the query you want to view.
-
In the View Plan column, click Profile next to the command for which you want to view the query plan. Only certain queries, like SELECT, INSERT, UPDATE, and DELETE, have profile data.
-
In The Explain Plan window, Vertica profiles the query.
-
You can view the output in Path Information view, Query Plan Drilldown view, Tree Path view, or Profile Analysis view. To do so, click the respective buttons on the left of the output box.
To review the profile data for a specific query:
-
In the Explain window, type or paste the query text into the text box. Additionally, you can monitor queries that are currently running. To do so, perform one of the following. In the Find a Query By ID input window:
Caution
If you enter more than one query, Management Console profiles only the first query.
-
To receive periodic updates about the query's progress and resources used, select the Enable Monitoring check box. As a best practice, avoid specifying an interval time of less than 60 seconds because doing so may slow your query's progress.
-
Click the Profile button.
While Vertica is profiling the query, a Cancel Query button is enabled briefly, allowing you to cancel the query and profiling task. If the Cancel Query button is disabled, that means Management Console does not have the proper information to cancel the query or the query is no longer running in the database.
When processing completes, the profile data and metrics display below the text box. You can view the output in Path Information view, Query Plan Drilldown view, Tree Path view , or Profile Analysis view. To do so, click the respective view buttons on the left of the output box.
6.6.3.1 - Viewing different profile outputs
Vertica Management Console allows you to examine the results of your query profile in multiple views.
Vertica Management Console allows you to examine the results of your query profile in multiple views. You can view your profile in the following formats:
-
Path Information view
-
Query Drilldown view
-
Tree Path view
-
Profile Analysis view
You can change the query profile output using the icons on the bottom portion of the Explain page.
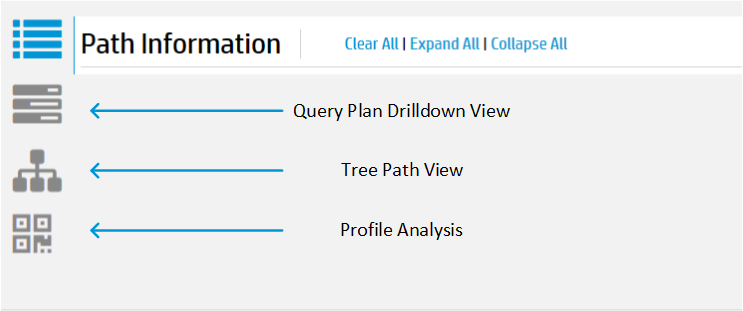
The Path Information view displays the query plan path along with metric data. If you enable profile monitoring, the data will update at the specified interval. To view metadata for a projection or a column, click the object name in the path output. A pop-up window displays the metadata if it is available.
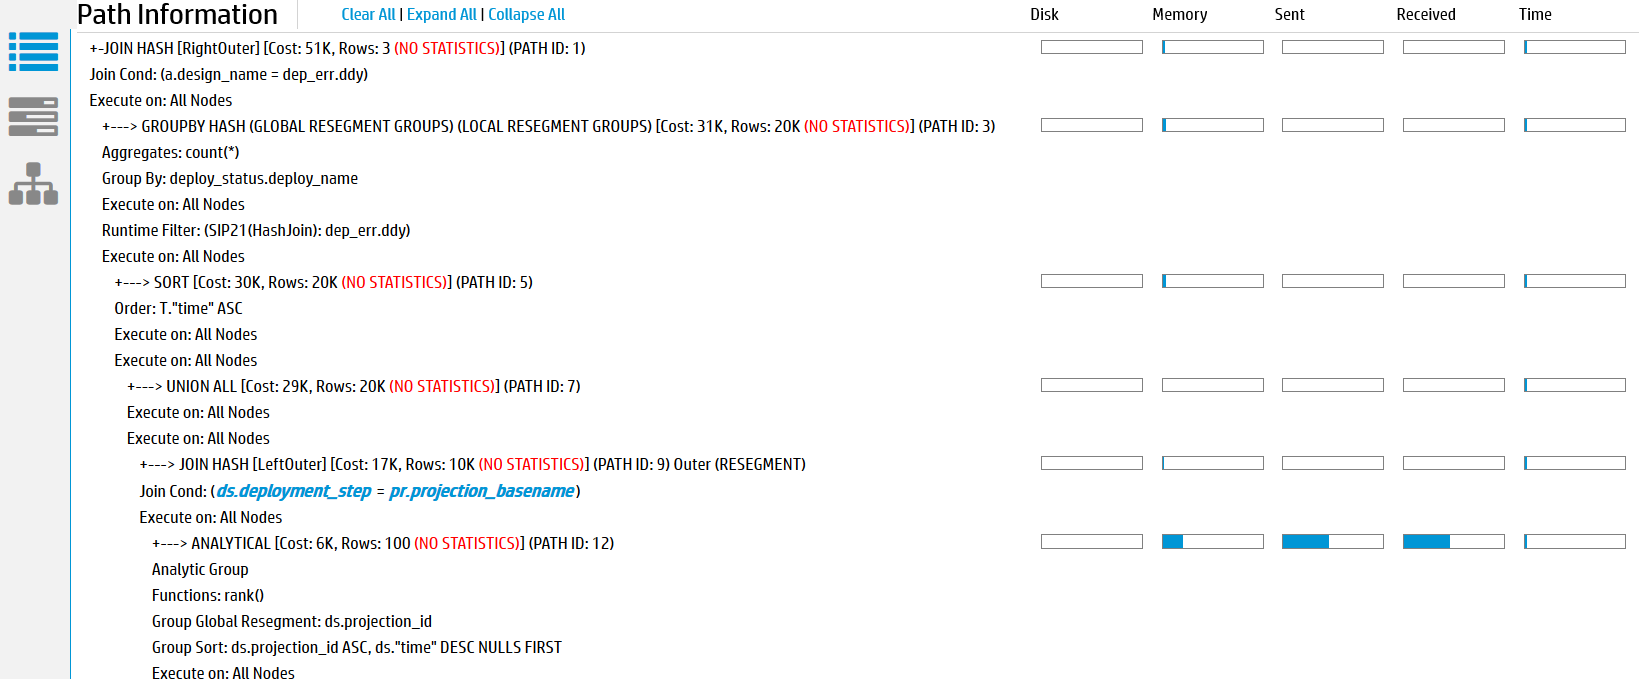
The Query Plan Drilldown view shows detailed counter information at the node and operator level.
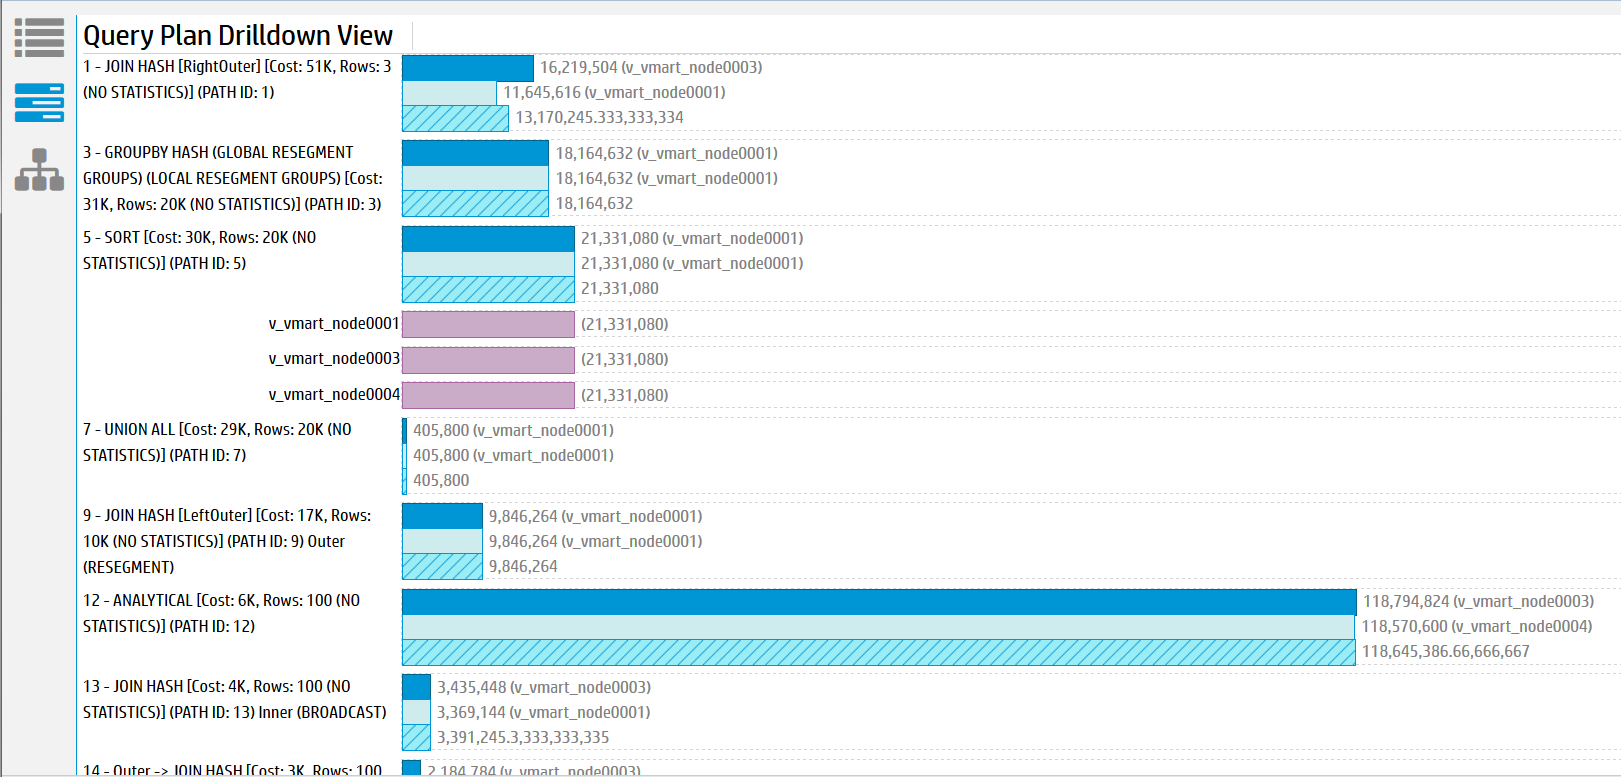
For each path, the path number is listed along with statistical information on the node and operator level. This view allows you to see which nodes are acting as outliers. Click on any of the bars to expand details for that node.
The Tree Path details the query plan in the form of a tree. If you enable monitoring, the state of the path blocks will change depending on whether the path is running, done, or has not started. Metric information is displayed in each path block for the counters you specified in the Profile Settings.
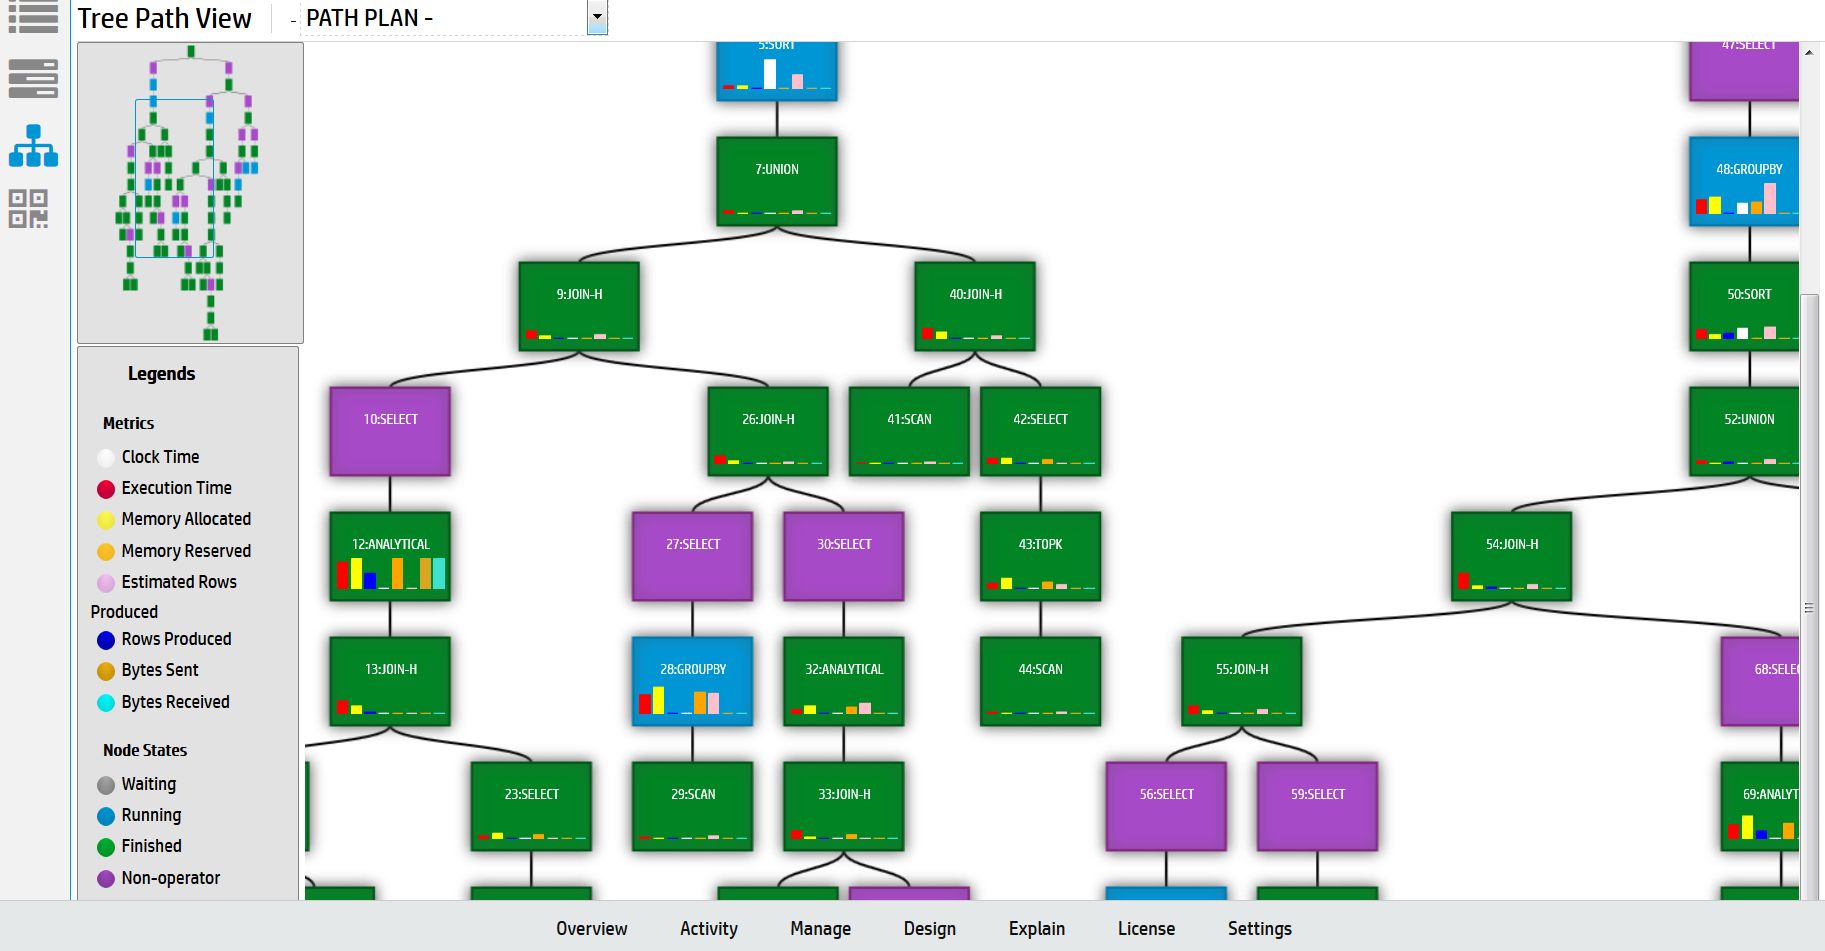
The Profile Analysis view allows you to identify any resource outliers. You can compare the estimated rows produced count with the actual rows produced count, view execution time per path, and identify memory usage per path.
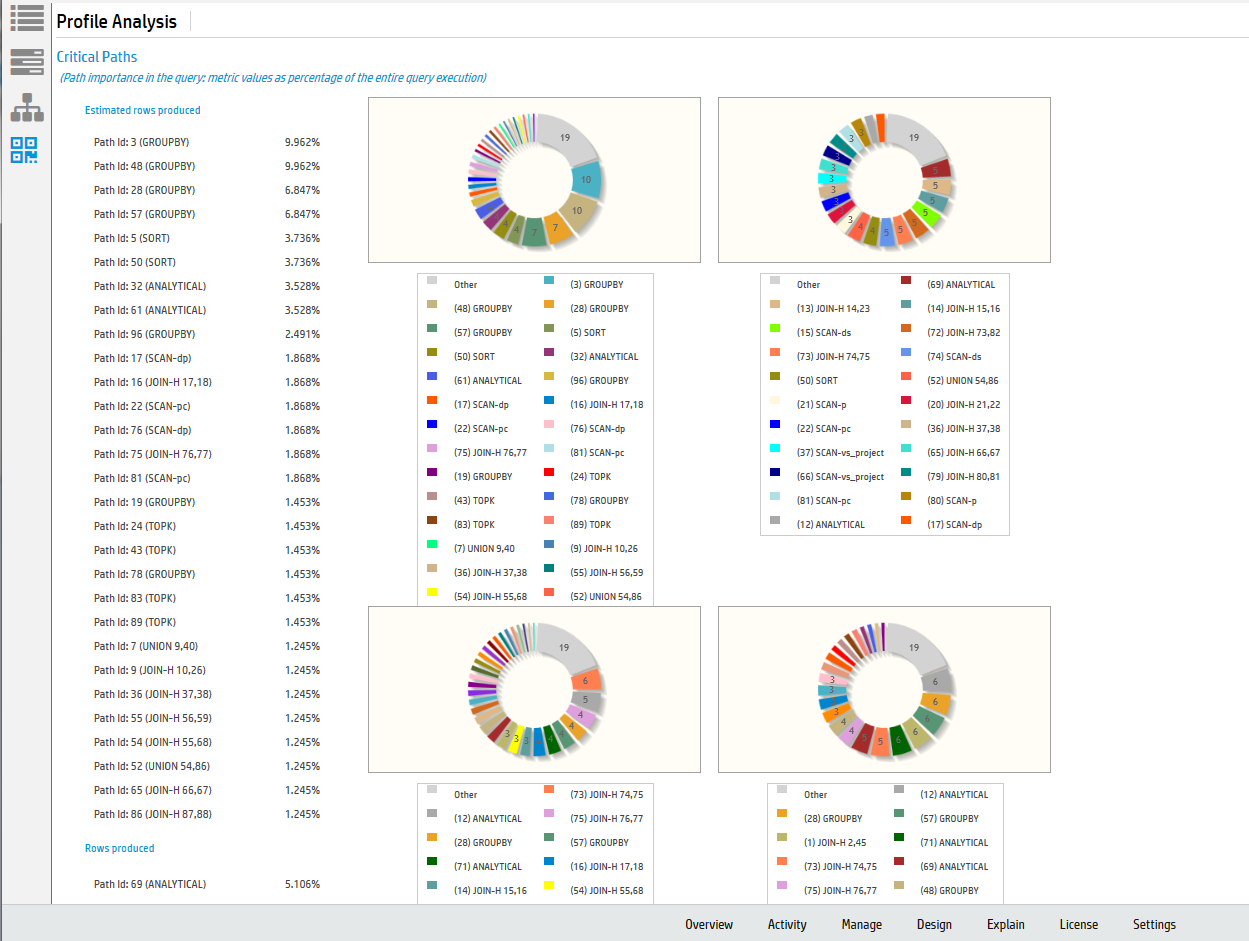
When you profile a query, you will also see a pie chart detailing the query phase duration. You can also view projection metadata, execution events, and optimizer events by clicking on the respective buttons next to the pie chart.
6.6.3.2 - Monitoring profiling progress
While loading profile data for a query, Management Console can provide updates about the query's progress and resources used.
While loading profile data for a query, Management Console can provide updates about the query's progress and resources used.
To enable profiling progress updates, select the Enable Monitoring check box when profiling a query. See Viewing Profile Data in Management Console.
The default interval time is 60 seconds. At the specified interval, Management Console displays an updated view of the query's progress. Note that interval times of less than 60 seconds may slow down your query.
Viewing updated profile metrics
At every interval, Management Console displays a new set of profile metrics. You can view these metrics in Path Information view, Query Plan Drilldown view, or Tree view by clicking the respective view buttons on the left of the output box.
-
A dark blue bar indicates the current metric percentage.
-
When a metric bar has decreased, a dark blue line indicates the previous metric percentage.
-
When a metric bar has increased, a light blue bar indicates the added percentage. The previous percentage appears as a dark blue bar.
-
A metric bar highlighted in yellow indicates it has changed since the last interval.
-
A metric bar highlighted in red indicates the absolute value of the metric has decreased. This typically means Vertica reported the previous value incorrectly, and has readjusted. (For example, if Vertica previously reported path's Time value as 75 seconds, then reports it as 50 seconds at the next interval, the metric bar turns red to indicate the decrease in absolute Time value.)
6.6.3.3 - Expanding and collapsing query path profile data
When you have a query on the EXPLAIN window, the profile data displays in the right-hand side of the lower half of the window.
When you have a query on the EXPLAIN window, the profile data displays in the right-hand side of the lower half of the window. The query path information can be lengthy, so you can collapse path information that is uninteresting, or expand paths that you want to focus on.
-
To collapse all the query paths, click Collapse All.
-
To expand all the query paths, click Expand All.
-
To expand an individual query path so you can see details about that step in processing the query, click the first line of the path information. Click the first line again to collapse the path data.
For information about what the profile data means, see About profile data in Management Console.
6.7 - Working with query plans in MC
Management Console can show you a query plan in easy-to-read format, where you can review the optimizer's strategy for executing a specific query.
Management Console can show you a query plan in easy-to-read format, where you can review the optimizer's strategy for executing a specific query. You can view a query plan in either of two ways:
Access the plan of an active query
-
At the bottom of the Management Console window, click the Activity tab.
-
From the list at the top of the page, select Queries.
-
On the activity graph, click the data point that corresponds to the query you want to view.
-
In the View Plan column, click Explain next to the command for which you want to view the query plan. Only certain queries use query plans—for example, SELECT, INSERT, DELETE, and UPDATE.
-
In the Explain Plan window, click Explain. Vertica generates the query plan.
-
(Optional) View the output in Path Information view or Tree Path view. To do so, click the respective view buttons on the left of the output box.
Access the plan for a specific query
-
Locate the query for which you want to see the query plan in either of the following ways:
-
Queries Not Running — In the Explain window, type or paste the query text into the text box.
-
Queries Currently Running — In the Find a Query By ID input window, perform one of the following actions:
Caution
Entering the word EXPLAIN before the query results in a syntax error.
-
Click Explain. Vertica generates the plan.
If the query is invalid, Management Console highlights in red the parts of your query that might have caused a syntax error.
-
(Optional) View the output in Path Information view or Tree Path view. To do so, click the respective view buttons on the left of the output box.
6.7.1 - Accessing query plans in Management Console
You can access query plans in Management Console in two ways:.
You can access query plans in Management Console in two ways:
-
In the Detail page for query-related charts on the database's Activity page, click Explain next to a query to view a plan for that query.
-
Enter a query manually on the Explain page and click Explain Plan.
In both cases, the following window opens:
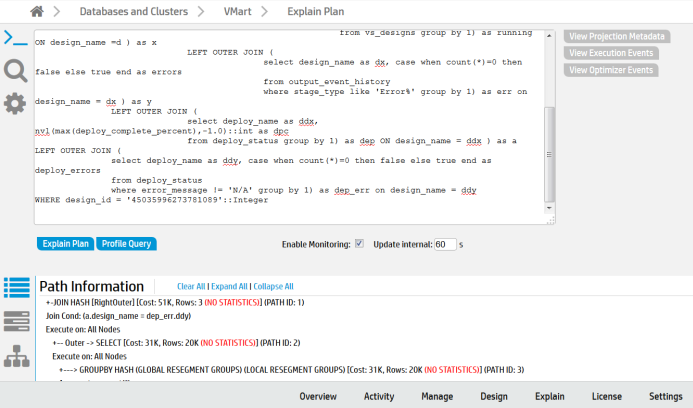
You can also enter the transaction ID and statement ID or browse running or completed queries in the Find a Query input window:
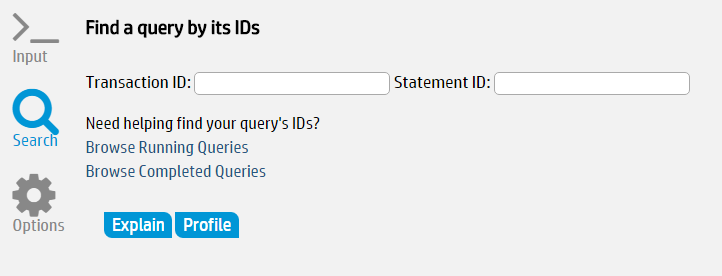
In the output window, you can perform the following tasks related to the query you entered:
6.7.2 - Query plan view options
Vertica Management Console provides two views for displaying query plans:.
Vertica Management Console provides two views for displaying query plans:
-
Path Information
-
Tree Path
Note
Query Plan Drilldown and Profile Analysis output views are only available when you run
PROFILE.
You can change the query plan view using the icons on the bottom portion of the Explain page.
The Path Information view displays the query plan path. You can expand or collapse the view to see different levels of detail. To view metadata for a projection or a column, click the object name in the path output. A pop-up window displays the metadata, if it is available.
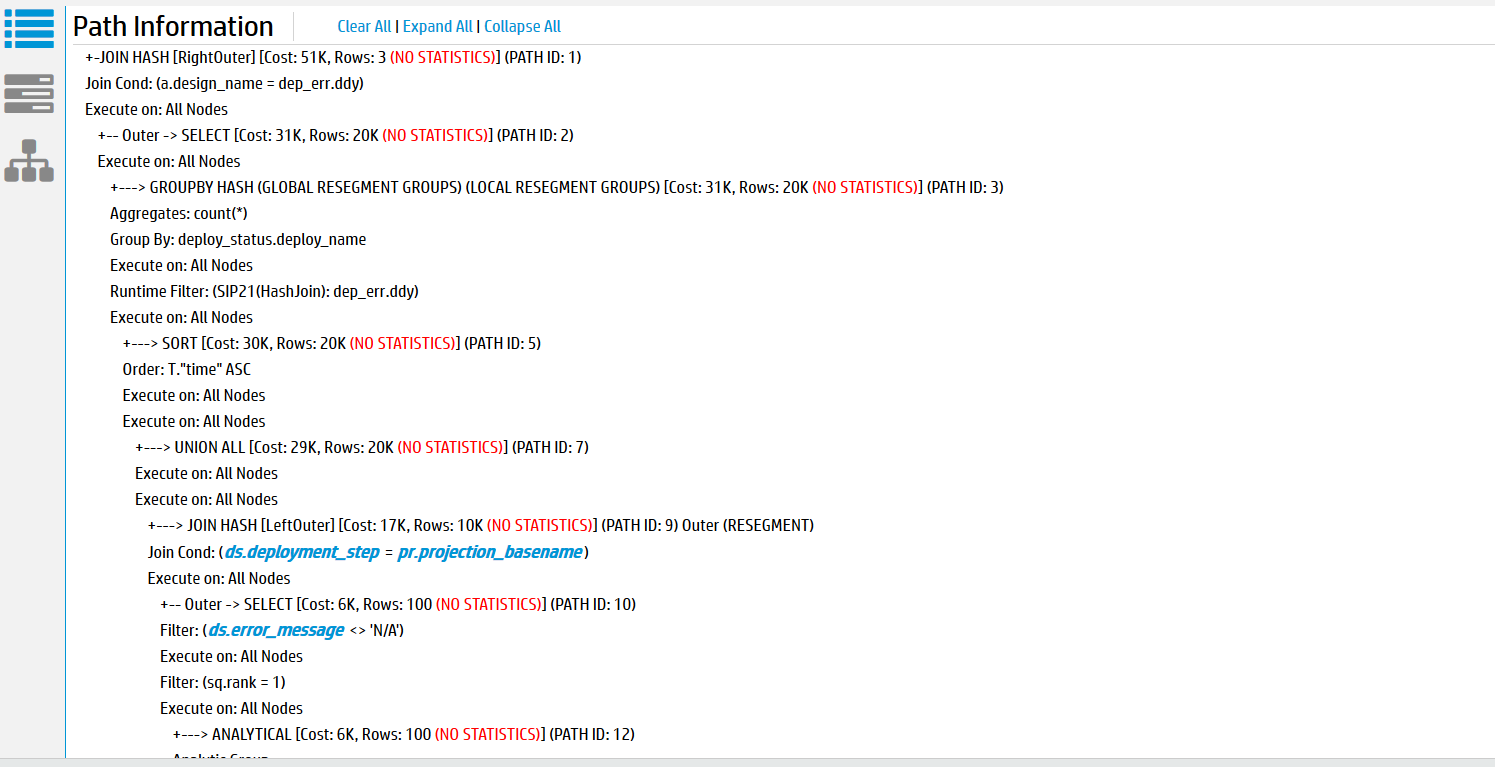 The
The
The Tree Path view details the query plan in the form of a tree. When you run EXPLAIN, the tree view does not contain any metrics because the query has not yet executed.
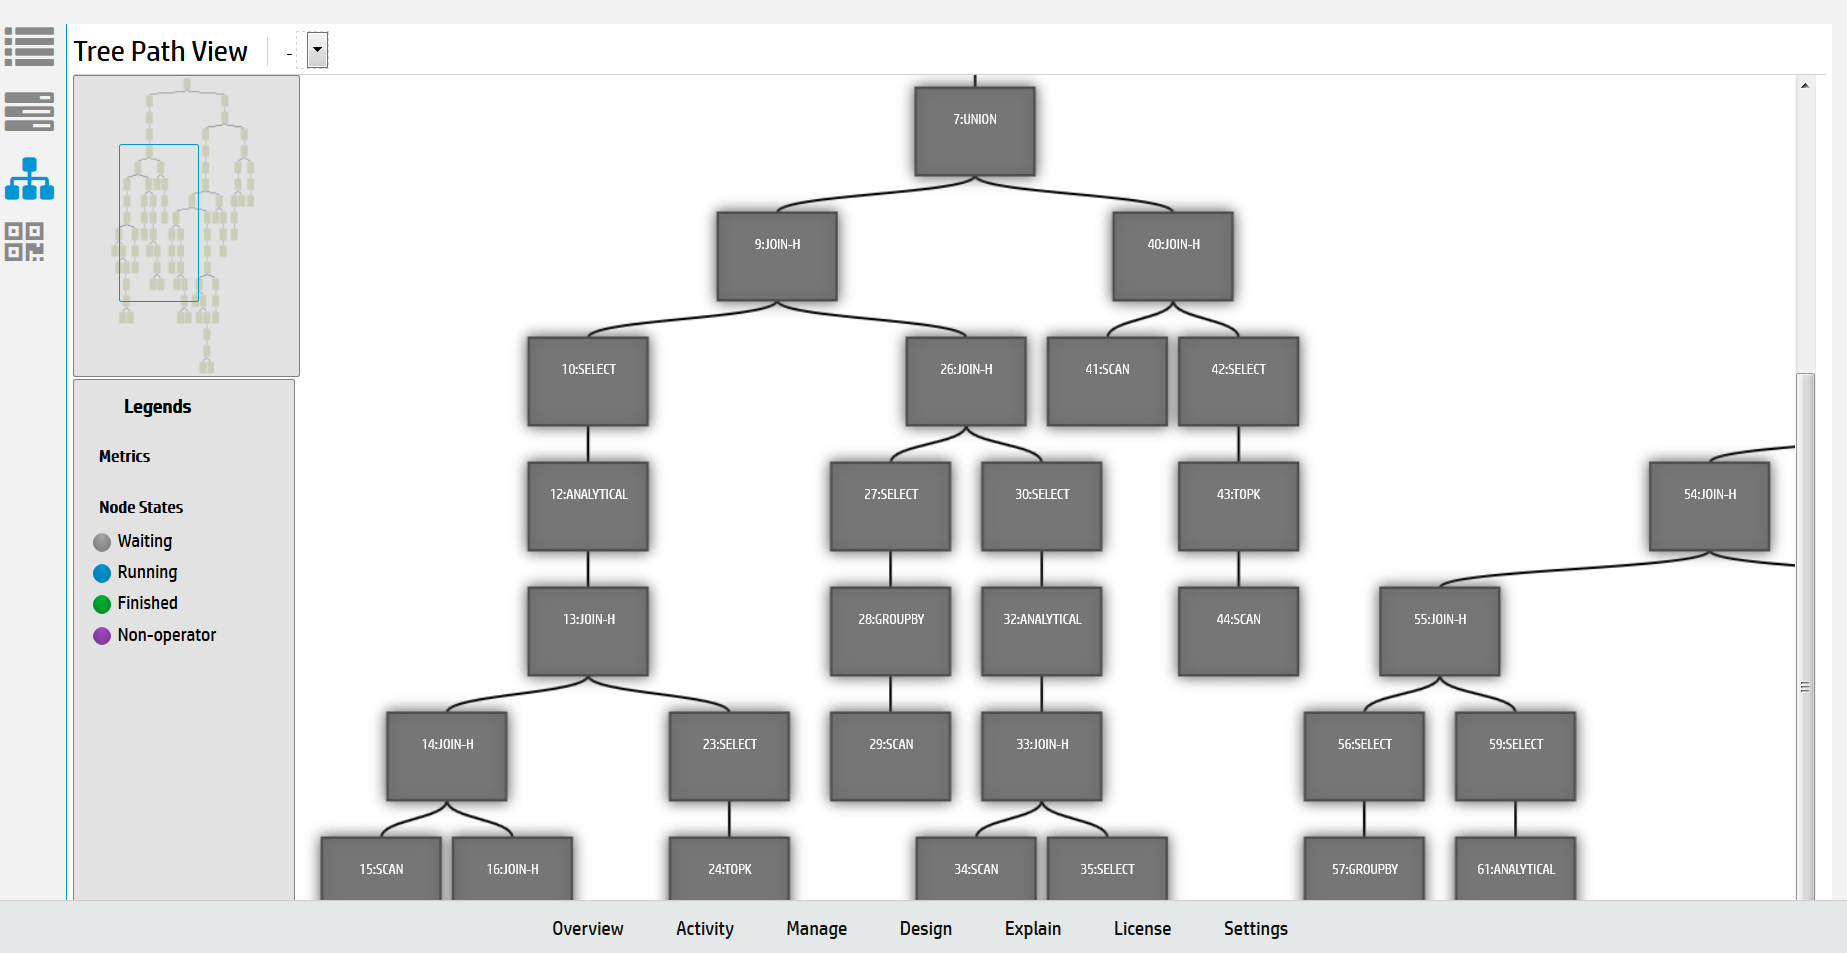
6.7.3 - Expanding and collapsing query paths
The EXPLAIN window initially displays the full query plan as generated by the EXPLAIN command.
The EXPLAIN window initially displays the full query plan as generated by the EXPLAIN command. Query plans can be lengthy, so you might want to modify the display so you can focus only on areas of interest:
-
Collapse All collapses all query paths, and displays only a summary of each path.
-
Expand All expands all query paths.
-
Click the first line of a path to display details for that path. To collapse that path, click its first line again.
For details about EXPLAIN command output, see EXPLAIN-Generated query plans.
6.7.4 - Clearing query data
After you finish reviewing the current query data, click Clear All to clear the query text and data.
After you finish reviewing the current query data, click Clear All to clear the query text and data. Alternatively, to display information about another query, enter the query text and click Explain or Profile.
6.7.5 - Viewing projection and column metadata
In the Management Console EXPLAIN window, when query paths are expanded in the Path Information view, Projection lines contain a projection name and Materialize lines contain one or more column names.
In the Management Console EXPLAIN window, when query paths are expanded in the Path Information view, Projection lines contain a projection name and Materialize lines contain one or more column names.
To view metadata for a projection or a column, click the object name. A pop-up window displays the metadata. The following image on the left shows example projection metadata and the image on the right shows example column metadata.
Note
Most system tables do not have metadata.
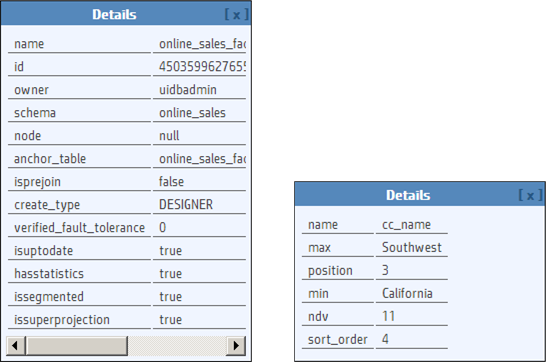
When you are done viewing the metadata, close the pop-up window.
6.8 - Creating a database design in Management Console
Database Designer creates an design that provides excellent performance for ad-hoc queries and specific queries while using disk space efficiently.
Database Designer creates an design that provides excellent performance for ad-hoc queries and specific queries while using disk space efficiently. Database Designer analyzes the logical schema definition, sample data, and sample queries, and creates a physical schema that you can deploy.
For more about how Database Designer works, see the Creating a database design section of the documentation, and About Database Designer.
To use Management Console to create an optimized design for your database, you must be a DBADMIN user or have been assigned the DBDUSER role.
Management Console provides two ways to create a design:
-
Wizard—This option walks you through the process of configuring a new design. Click Back and Next to navigate through the Wizard steps, or Cancel to cancel creating a new design.
To learn how to use the Wizard to create a design, see Using the wizard to create a design.
-
Manual—This option creates and saves a design with the default parameters.
To learn how to create a design manually, see Creating a design manually.
Tip
If you have many design tables that you want Database Designer to consider, it might be easier to use the Wizard to create your design. In the Wizard, you can submit all the tables in a schema at once; creating a design manually requires that you submit the design tables one at a time.
6.8.1 - Using the wizard to create a design
Take these steps to create a design using the Management Console's Wizard:.
Take these steps to create a design using the Management Console's Wizard:
-
On your database's dashboard, click the Design tab at the bottom of the page to navigate to the Database Designer page.
The left side of the Database Designer page lists the database designs you own, with the most recent design you worked on highlighted. That pane also lists the current status of the design. Details about the most recent design appear in the main pane.
The main pane contains details about the selected design.
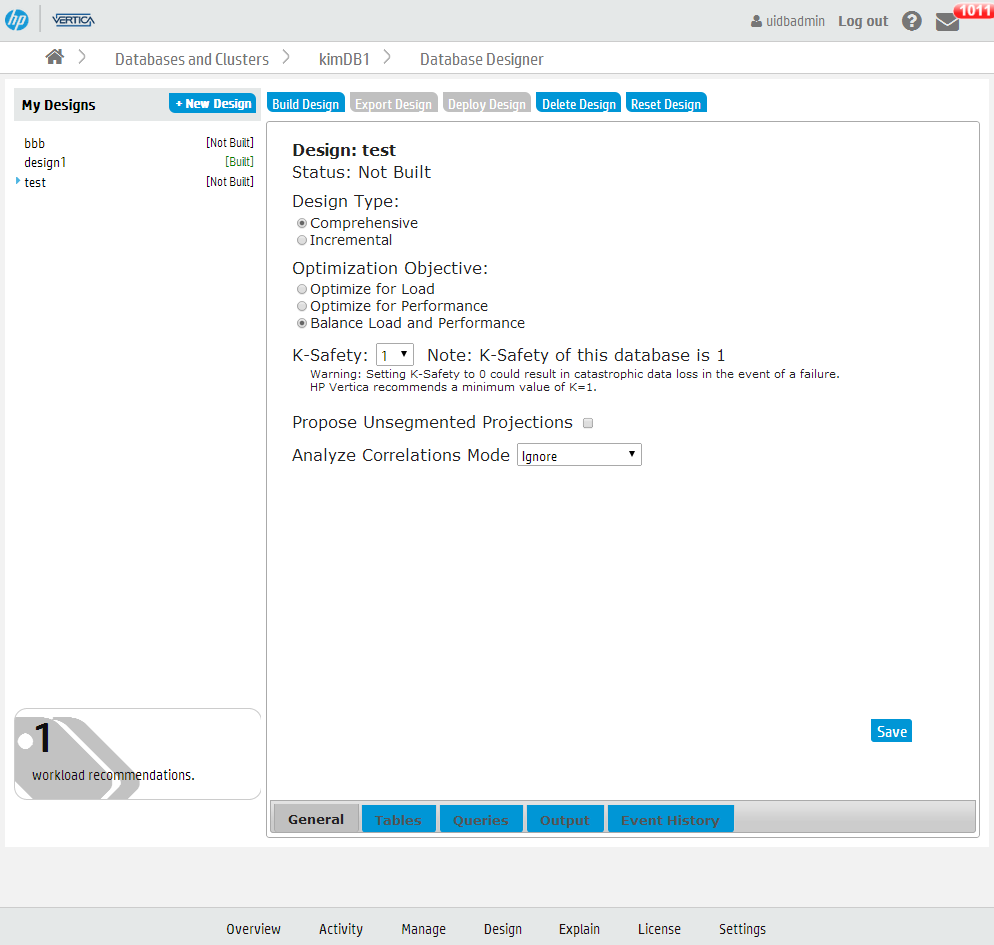
-
To create a new design, click New Design.
-
Enter a name for your design, and click Wizard.
-
Navigate through the Wizard using the Back and Next buttons.
-
To build the design immediately after exiting the Wizard, on the Execution Options window, select Auto-build.
Important
Vertica does not recommend that you auto-deploy the design from the Wizard. There might be a delay in adding the queries to the design, so if the design is deployed but the queries have not yet loaded, deployment might fail. If this happens, reset the design, check the Queries tab to make sure the queries are loaded, and deploy the design.
-
After you enter all the information, the Wizard displays a summary of your choices. Click Submit Design to build your design.
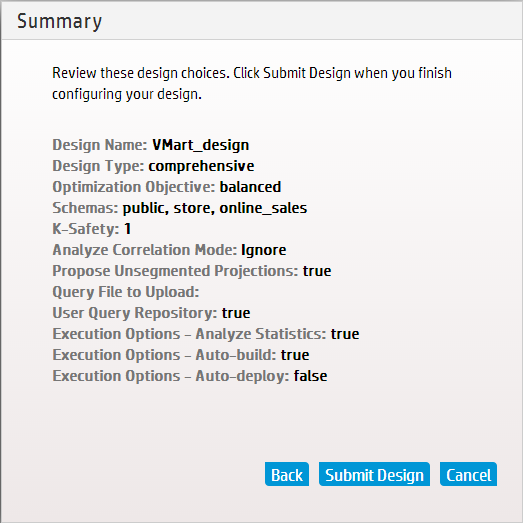
See also
6.8.2 - Creating a design manually
To create a design using Management Console and specify the configuration, take these steps.
To create a design using Management Console and specify the configuration, take these steps.
-
On your database's dashboard, click the Design tab at the bottom of the page to navigate to the Database Designer page.
The left side of the Database Designer page lists the database designs you own, with the most recent design you worked on highlighted. That pane also lists the current status of the design. Details about the most recent design appear in the main pane.
The main pane contains details about the selected design.
-
To create a new design, click New Design.
-
Enter a name for your design and select Manual.
The main Database Design window opens, displaying the default design parameters. Vertica has created and saved a design with the name you specified, and assigned it the default parameters.
-
On the General window, modify the design type, optimization objectives, K-safety, Analyze Correlations Mode, and the setting that allows Database Designer to create unsegmented projections.
If you choose Incremental, the design automatically optimizes for the desired queries, and the K-safety defaults to the value of the cluster K-safety; you cannot change these values for an incremental design.
Analyze Correlations Mode determines if Database Designer analyzes and considers column correlations when creating the design.
-
Click the Tables tab. You must submit tables to your design.
-
To add tables of sample data to your design, click Add Tables. A list of available tables appears; select the tables you want and click Save. If you want to remove tables from your design, click the tables you want to remove, and click Remove Selected.
If a design table has been dropped from the database, a red circle with a white exclamation point appears next to the table name. Before you can build or deploy the design, you must remove any dropped tables from the design. To do this, select the dropped tables and and click Remove Selected. You cannot build or deploy a design if any of the design tables have been dropped.
-
Click the Queries tab. To add queries to your design, do one of the following:
- To add queries from the QUERY_REQUESTS system table, click Query Repository. In the Queries Repository dialog that appears, you can sort queries by most recent, most frequently executed, and longest running. Select the desired queries and click Save. All valid queries that you selected appear in the Queries window.
Database Designer checks the validity of the queries when you add the queries to the design and again when you build the design. If it finds invalid queries, it ignores them.
If you have a large number of queries, it may take time to load them. Make sure that all the queries you want Database Designer to consider when creating the design are listed in the Queries window.
-
Once you have specified all the parameters for your design, you should build the design. To do this, select your design and click Build Design.
-
Select Analyze Statistics if you want Database Designer to analyze the statistics before building the design.
For more information see Statistics Analysis.
-
If you do not need to review the design before deploying it, select Deploy Immediately. Otherwise, leave that option unselected.
-
Click Start. On the left-hand pane, the status of your design displays as Building until it is complete.
-
To follow the progress of a build, click Event History. Status messages appear in this window and you can see the current phase of the build operation. The information in the Event History tab contains data from theOUTPUT_EVENT_HISTORY system table.
-
When the build completes, the left-hand pane displays Built. To view the deployment script, select your design and click Output.
-
After you deploy the design using Management Console, the deployment script is deleted. To keep a permanent copy of the deployment script, copy and paste the SQL commands from the Output window to a file.
-
Once you have reviewed your design and are ready to deploy it, select the design and click Deploy Design.
-
To follow the progress of the deployment, click Event History. Status messages appear in this window and you can see the current phase of the deployment operation.
In the Event History window, while the design is running, you can do one of the following:
-
Click the blue button next to the design name to refresh the event history listing.
-
Click Cancel Design Run to cancel the design in progress.
-
Click Force Delete Design to cancel and delete the design in progress.
-
When the deployment completes, the left-hand pane displays Deployment Completed. To view the deployment script, select your design and click Output.
Your database is now optimized according to the parameters you set.
6.9 - Running queries in Management Console
You can use the Query Runner to run SQL queries on your database through Management Console (MC).
You can use the Query Runner to run SQL queries on your database through Management Console (MC). After executing a query, you can also get the query plan and profile information for the query on this page.
To reach the Query Runner, select your database from the Home page or the Databases and Clusters page to view your database's Overview page. Select Query Execution at the bottom of the Overview page.
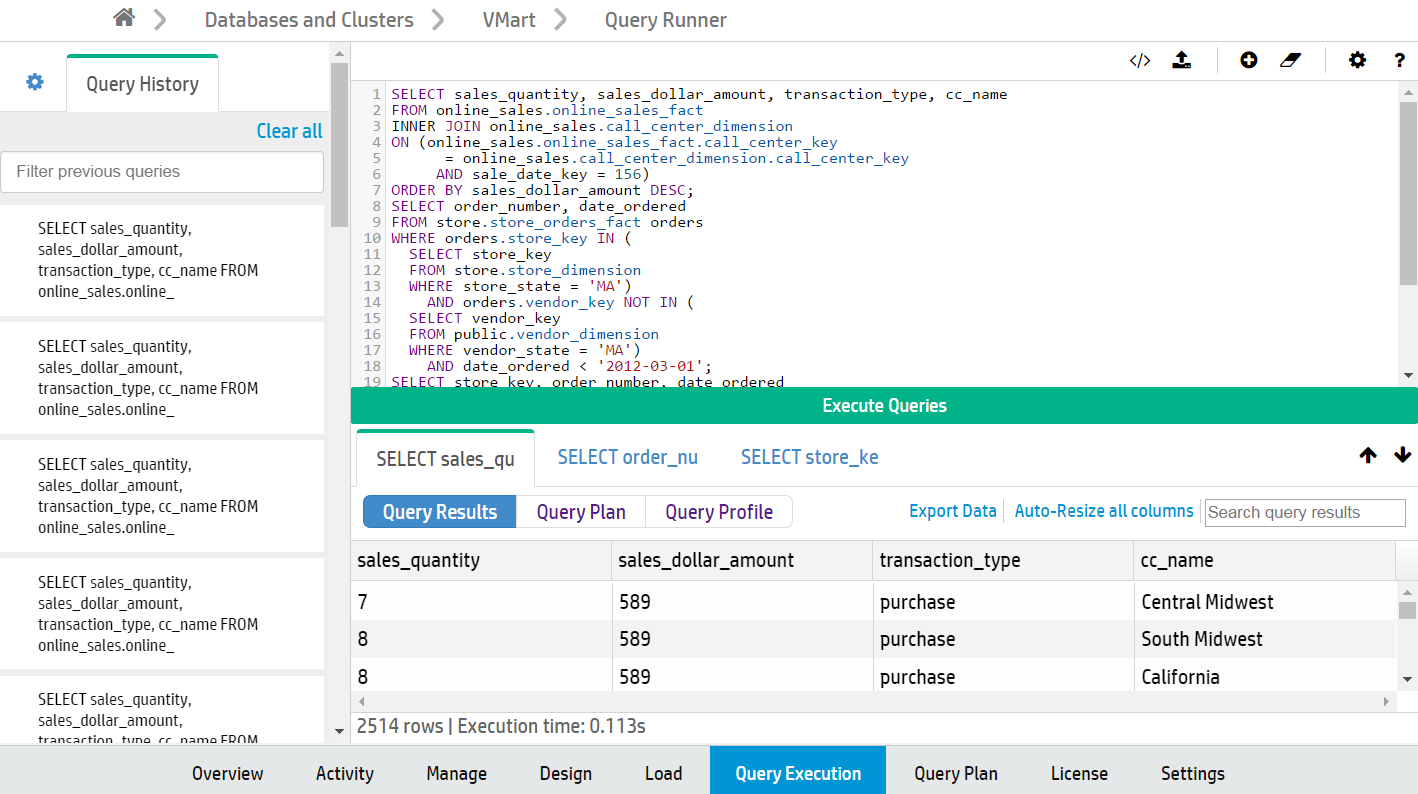
To familiarize yourself with how queries work in Vertica, you can refer to the Queries section of the documentation, as well as the SQL reference.
Limitations
You cannot execute COPY LOCAL statements using the Query Runner. To do so, use the vsql client installed on the server. See Using vsql. (To use MC to import data from Amazon S3 storage to your Vertica database, see Loading data from Amazon S3 using MC.)
Manually commit any transactions (INSERT and COPY statements) you perform by adding the COMMIT statement in the text box after the transaction statements. If you do not do so, the transaction rolls back.
In the following example, to insert values into table1, include a COMMIT statement in the text box and execute the two statements together:
INSERT INTO table1 VALUES (1,2); COMMIT;
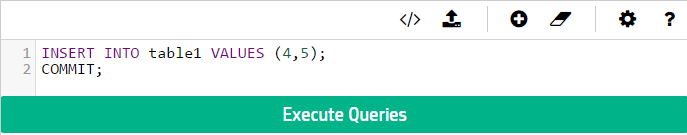
To input a series of queries, delimit them with a semicolon (;).
To automatically format the SQL text you have input, click the Format icon ( ).
).
Privileges
It is important when running queries in MC that the database administrator has correctly set up MC user privileges. The administrator must map all MC user profiles to their corresponding database user.
The Query Runner only permits MC users to perform actions that their corresponding Vertica database roles allow.
To set up user mappings, go to Home > MC Settings > User Management.
For more about how mapping MC user profiles to database users works, see Granting database access to MC users. For information about database-level users and privileges, see the Database users and privileges section of the documentation.
Execute a query
The Query Runner provides several ways to input a query to run:
-
Input text. Enter the text for a query or series of queries into the text box.
-
Import a SQL script. Click the Upload icon ( ) to the top right of the text box to upload a SQL script (plain text file, typically with an extension of
 .sql). The queries from that file appears in the text box.
-
Enter a previous query from the Query History tab. The Query History tab, on the left side of the page, displays the last 100 queries you have executed using the Query Runner on your current device and browser. Click any previous query in this tab to enter that query into the text box.
Hover over a query in the Query History tab to view all the query text. To clear queries from your history, hover over an individual query and click x, or click Clear all at the top of the tab. Click the star to the left of any query to favorite it, so it won't be cleared when you click Clear all.
Cick Execute Query to run the queries you have input.
You can also execute only a portion of the text entered into the text box, as long as the selected text is a valid query. To do so, select that portion of the text. The Execute selected text as query button then appears below the text box.
For example, you might execute only a part of the entered text if you have uploaded a SQL script that containing multiple queries, but you decide to run only one of those queries.
To customize your execution settings, click the Settings icon ( ) at the top right of the text box:
-
Row Limit: Set the maximum number of rows to return. By default, the limit is 10000 rows.
-
Search Path: Specify the schema to query.
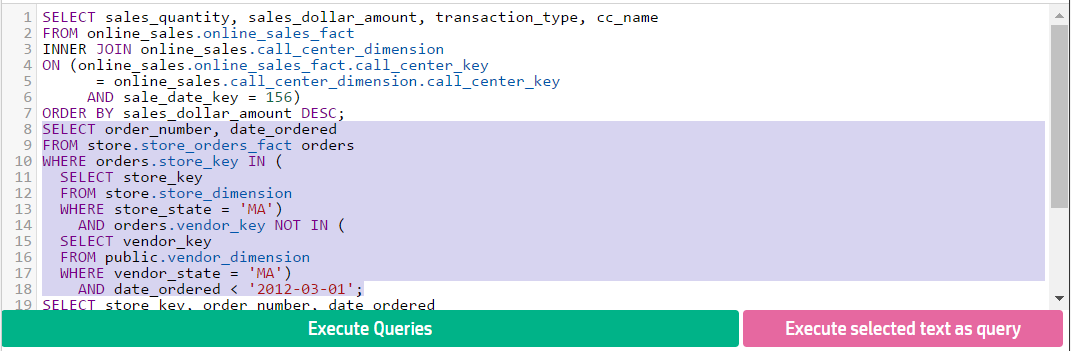
Get query results
The Query Runner returns results in a table format. If you ran multiple queries simultaneously, the results window displays a tab for each set of results. View the number of rows returned and the query execution time at the bottom of the results window.
If your result returns many columns, you can click Auto-resize all columns in the top right of the results window for a better fit, or click and drag column borders to manually resize individual columns.
Sort results by clicking on a column name, or use the search bar to narrow down results.
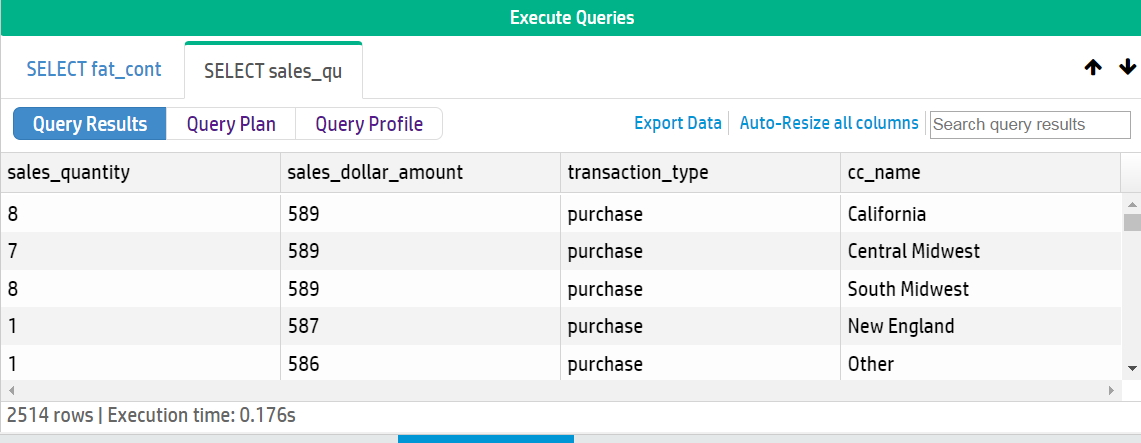
Query plans and profiles
Each query result also displays an option to retrieve the plan or profile for that query.
After retrieving a plan or profile, you can expand or collapse the results view to see different levels of detail. To view metadata for a projection or a column, click the object name in the path output. A pop-up window displays the metadata, if it is available.
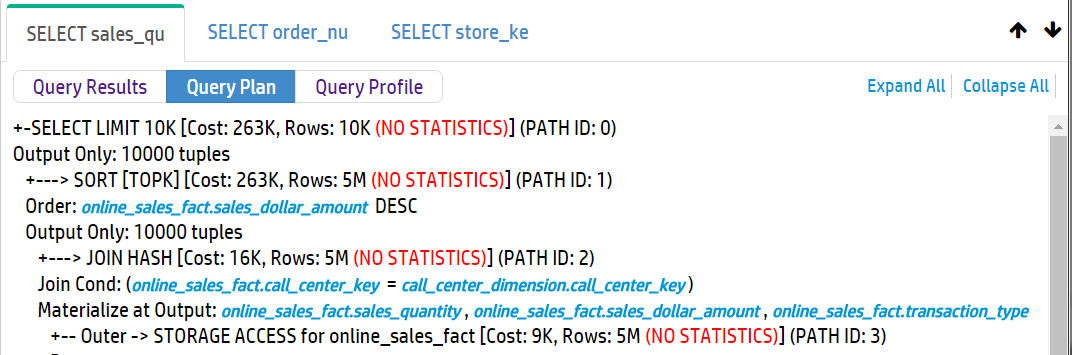
Note that the Query Runner does not automatically provide query profiles for queries that run for less than 1 second. To do so, prepend the word PROFILE to the query and run it.
You can also profile your query on the Query Plan page. The Query Plan page provides more details about both plan and profile results, including a query plan drilldown by node, a tree path view, and a profile analysis.
Keyboard shortcuts
The Query Runner provides the following keyboard shortcuts:
-
?: Press the question mark to display or dismiss a list of the available keyboard shortcuts. (You can also click the question mark icon at the top right of the text box to view this list.)
-
alt + ↑: Press alt + up arrow to decrease the height of the text box.
-
alt + ↓: Press alt + down arrow to increase the height of the text box.
-
ctrl + enter: Press ctrl + enter to run the query.
-
ctrl + shift + enter: Press ctrl + shift + enter to run selected text.
See also
6.10 - Working with workload analyzer recommendations in MC
If queries perform sub-optimally, use Workload Analyzer to get tuning recommendations and hints about optimizing database objects.
If queries perform sub-optimally, use Workload Analyzer to get tuning recommendations and hints about optimizing database objects.
Workload Analyzer is a Vertica utility that analyzes system information in Vertica system tables. It then returns a set of tuning recommendations based on statistics, system and data collector events, and database/table/projection design. You can use these recommendations to tune query performance.
Configuring the workload analyzer execution time
By default, Workload Analyzer runs each day at 2 AM. To optimize when Workload Analyzer uses resources, you can set Workload Analyzer to run at a different time for any or all databases that Management Console monitors. Alternately, you can set Management Console to never run Workload Analyzer automatically.
Note
Workload Analyzer automatically begins monitoring data one minute after the Management Console process starts. Workload Analyzer then runs once per day, or immediately after you import a database to Management Console. It continually gathers data in the background as long as the database is running. If you have not yet created a database, or if the database is down, Workload Analyzer does nothing until the database is back up.
-
On the Home page, click MC Settings.
-
Click the Monitoring tab.
-
Under the Workload Analyzer Assistant section of the Monitoring page, select your time zone.
-
Select the radio button for one of the options:
-
All Databases: Select a time from the list. Workload Analyzer will run at that time on all databases that MC monitors.
-
Specific Database at Specific Time: Select a database and a time from the list. At the time you specify, Workload Analyzer will run at that time on the database you selected.
-
Do Not Run Workload Analyzer On Any Database: MC will never run Workload Analyzer automatically on any database it monitors.
-
Click Apply at the top right of the page.
For additional information about tuning recommendations and their triggering event, see Workload analyzer recommendations.
View workload analyzer recommendations
Workload Analyzer recommendations are available from the Quick Stats sidebar on the right of the database's Overview page. The Workload Analyzer module displays the number of tuning recommendations that the Workload Analyzer has generated.
To view the Workload Analyzer Results on the Database Designer page, click the number in the Workload Analyzer module.
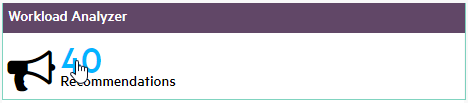
The Workload Analyzer Results window allows you to view details about and perform actions using current and processed recommendations.
Click the Current Recommendations radio button to display available Workload Analyzer recommendations. When
ANALYZE_STATISTICS is returned as a tuning recommendation, select the check mark to the left of the row and click Run Selected Recommendations to execute the recommendation automatically.
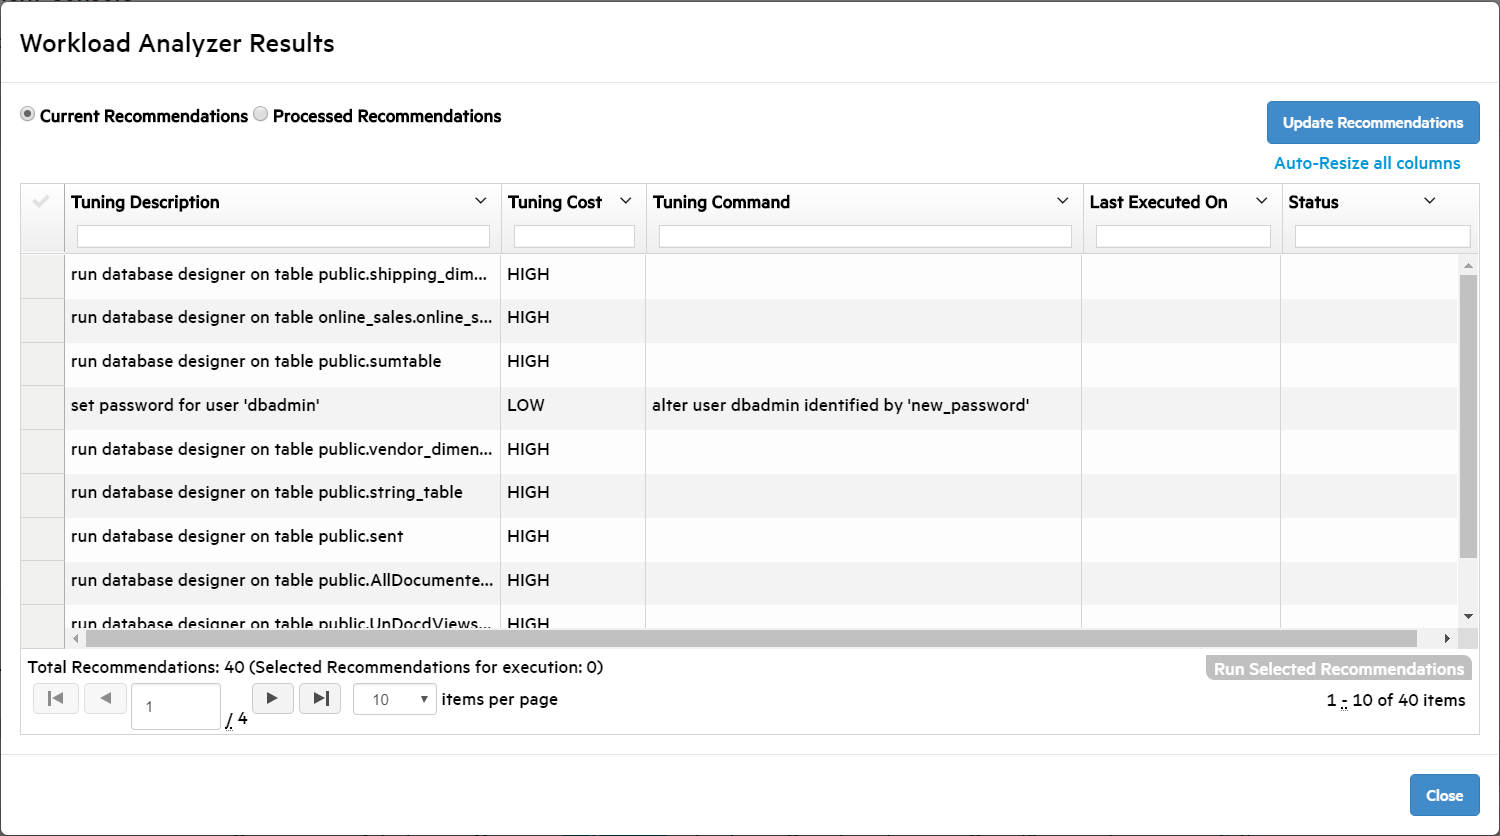
Click the Processed Recommendations radio button to display the Workload Analyzer recommendations that you previously executed. To remove a recommendation from the list, click the check mark to the left of the row and click Clear, located above the Close button in the bottom-right of the window. To expand or hide the processed recommendation's execution history, click the plus or minus sign to the left of the row.
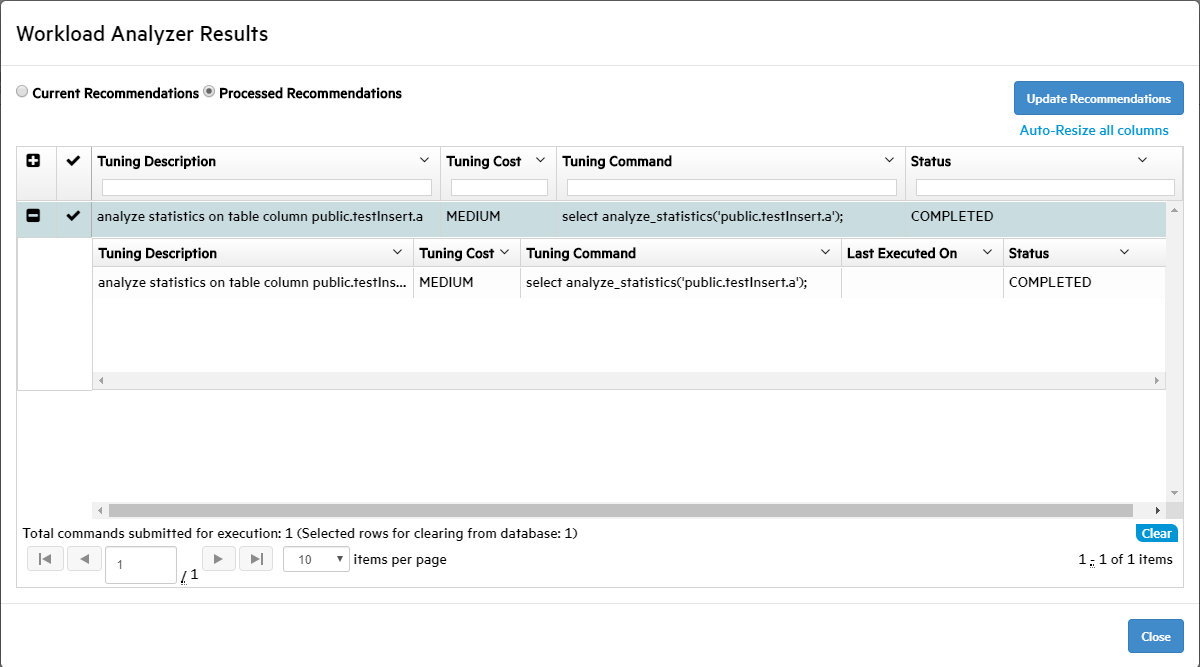
You can force the Workload Analyzer task to run immediately by clicking Update Recommendations, located above the Status column.
The total recommendations and the number of recommendations currently selected to run are displayed under the recommendations grid. Use the settings under the grid to view more recommendations per page or to cycle through the recommendations that do not fit on the page.
The following columns are used to describe recommendations:
-
Tuning Description — Describes the Workload Analyzer recommendation.
-
Tuning Cost — Resource cost of running each command (LOW, MEDIUM, or HIGH).
Tip
When the tuning cost is HIGH, consider running the recommended tuning during off-peak load times.
-
Tuning Command — SQL command used to execute the recommendation.
-
Last Executed On — Date that the recommendation was last run. In MM/DD/YYYY format.
-
Status — Describes the execution stage of a tuning recommendation ran from Workload Analyzer Results.
For more information about tuning recommendations, see Getting tuning recommendations and
ANALYZE_WORKLOAD.
Running workload analyzer recommendations to optimize a query
When the Workload Analyzer recommends that you run
ANALYZE_STATISTICS to optimize a query, you can run the recommendation automatically from Workload Analyzer Results.
-
Record the data source and execution time for a query that is running sub-optimally.
-
Click the Query Execution tab at the bottom.
-
Use the Query Runner to execute a query that you want to optimize.
-
Record the database table or tables in the query's FROM clause, and record the Execution time, located under the Query Results table.

-
Click the Overview tab at the bottom of the window.
-
On the Overview page, click the number in the Workload Analyzer box on the right.
Workload Analyzer Results opens.
-
To filter the recommendations, enter the sub-optimal query's database table or tables in the field at the top of the Tuning Description column.
-
Select one or more ANALYZE_STATISTICS recommendations by clicking the check mark to the left of the row. To select all of the filtered ANALYZE_STATISTICS recommendations, click the check mark to the left of the Tuning Description column header.
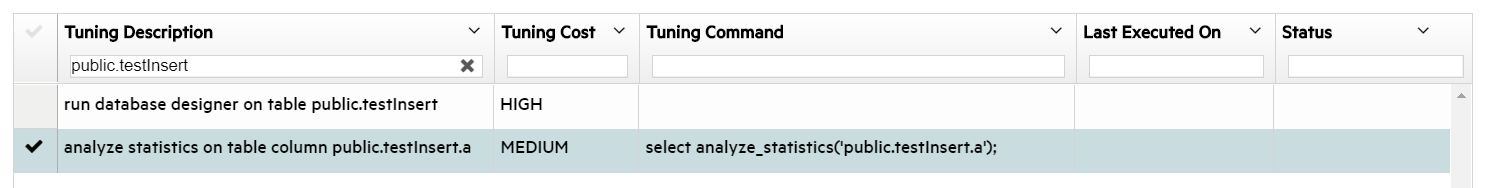
-
Click Run Selected Recommendations, located in the bottom-right of the window.
This process might take several minutes.
-
After the tuning recommendations are completed, click the Processed Recommendations radio button at the top of the window.
The previously executed recommendations are displayed.
-
Locate any recommendations that you just executed, and verify that the Status column says COMPLETED.
-
Verify that the query was optimized.
-
Click the Query Execution tab at the bottom of the Management Console.
-
Execute the query that was performing sub-optimally. Note the Execution time under the query results to verify the performance increase.

See also
Analyzing workloads
Getting tuning recommendations
6.11 - Running Database Designer using MC
You can use Database Designer to create a comprehensive design, which allows you to create new projections for all tables in your database.
You can use Database Designer to create a comprehensive design, which allows you to create new projections for all tables in your database.
Additionally, you can use Database Designer to create an incremental design. An incremental design creates projections for all tables referenced in the queries you supply.
To run Database Designer using MC, follow the steps listed at Running Database Designer with Management Console.
6.12 - Using the Management Console to replace nodes
On the MC Manage page, you can quickly replace a DOWN node in the database by selecting one of the STANDBY nodes in the cluster.
On the MC Manage page, you can quickly replace a DOWN node in the database by selecting one of the STANDBY nodes in the cluster.
A DOWN node shows up as a red node in the cluster. Click the DOWN node and the Replace node button in the Node List becomes activated, as long as there is at least one node in the cluster that is not participating in the database. The STANDBY node will be your replacement node for the node you want to retire; it will appear gray (empty) until it has been added to the database, when it turns green.
Tip
You can resize the Node List by clicking its margins and dragging to the size you want.
When you highlight a node and click Replace, MC provides a list of possible STANDBY nodes to use as a replacement. After you select the replacement node, the process begins. A node replacement could be a long-running task.
MC transitions the DOWN node to a STANDBY state, while the node you selected as the replacement will assume the identity of the original node, using the same node name, and will be started.
Assuming a successful startup, the new node will appear orange with a status of RECOVERING until the recovery procedure is complete. When the recovery process completes, the replacement node will turn green and show a state of UP.
6.13 - Import and monitor a database in a Hadoop environment
You can use Management Console to connect to and monitor a Vertica database that resides in an Apache Hadoop environment.
You can use Management Console to connect to and monitor a Vertica database that resides in an Apache Hadoop environment. To monitor the database in the Hadoop environment, you must connect to an Apache Ambari server.
Prerequisites
Before you begin, you must:
-
Install Vertica on a Hadoop cluster
-
Install Apache Ambari version 1.6.1 or 2.1.0
-
Enable Ganglia on your Hadoop cluster, to get the most information from your Hadoop environment
Importing Vertica within a Hadoop environment
To import your Vertica database that resides in a Hadoop environment, connect to that Hadoop environment in Management Console through an Apache Ambari server.
-
From the Management Console home page, select Additional import options.
-
In Provisioning, select Connect using an Ambari server to impot Vertica within a Hadoop environment.
-
The Provision Access Within Hadoop Environment window provides the following options:
-
Connect to a new Ambari server: Choose this option to create a enter your username and password for a new Ambari server connection.
-
Known Ambari URLs: If you have a pre-existing Ambari connection that you want to use, select it from the drop-down list.
-
In the next window, select the Hadoop cluster with the Vertica database that you want to monitor.
Management Console automatically discovers Hadoop clusters that are currently monitored by the Ambari server that you specify. If Management Console does not monitor Vertica clusters in the specified Hadoop environment, you can import clusters at this time.
After you select the Hadoop cluster, you receive confirmation that your Hadoop cluster is saved.
-
Enter the IP address for the Vertica database you want to import and monitor. If Vertica is running on multiple hosts, enter the IP address of one of them.
-
Enter the API key for the Vertica cluster. The API key is generated during Vertica installation, and you can find it in the /opt/vertica/config/apikeys.dat file.
-
The next window displays the discovered databases. Select one or more databases you want to import, and enter the corresponding username and password.
-
If the import is successful, you receive a success message. Click Done to go to the Existing Infrastructure page.
To import an additional Vertica cluster within a Hadoop environment, click Import Cluster or database using IP address discovery under Provisioning. Management Console will automatically associate the cluster with the existing Hadoop environment.
Monitoring Vertica within a Hadoop environment
To monitor the Vertica clusters in a Hadoop environment, navigate to the Existing Infrastructure page:
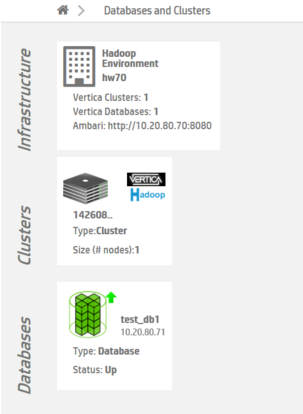
Click to select the Hadoop environment, and then click View Vertica Databases.
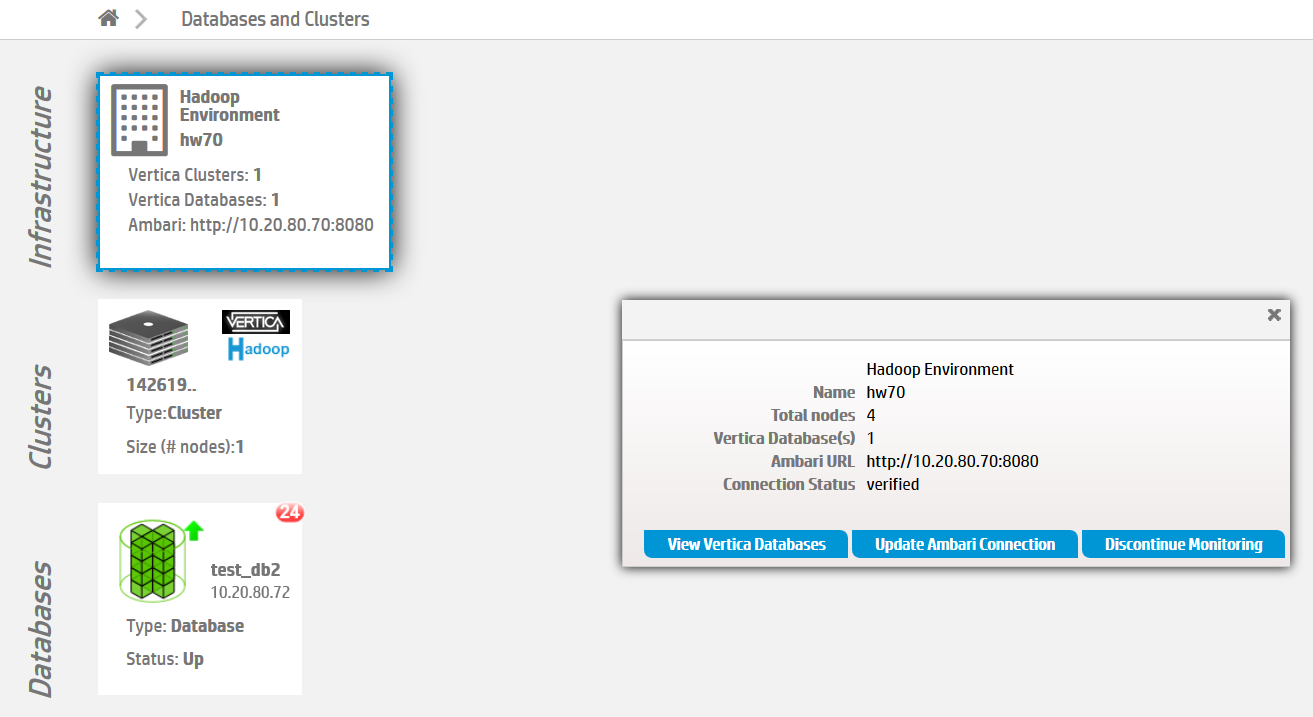
The Management Console displays information about the Vertica databases that reside in a Hadoop environment:
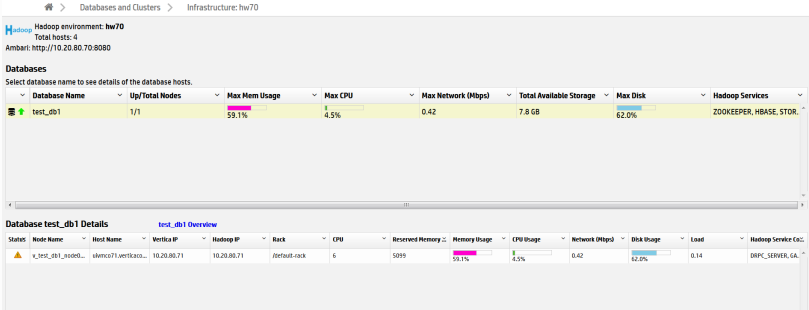
You can monitor information like resource usage, Hadoop services, and database and connection status.
Update or remove an ambari connection
To update or remove an existing Ambari connection, go to the MC Existing Infrastructure page, and click on the relevant Hadoop environment.
To update a connection, click Update Ambari Connection. Step through the wizard to update the connection.
To remove a connection, select Update Ambari Connection and choose Remove Connection, or click Discontinue Monitoring and then confirm that you want to remove the connection. Removing the connection also removes all Vertica databases associated with this connection from MC monitoring. You can re-import the databases later if needed.
See also:
Apache Hadoop integration
7 - Cloud platforms
Vertica supports Eon Mode database, subcluster, and node actions for the following cloud providers:.
Vertica supports Eon Mode database, subcluster, and node actions for the following cloud providers:
Management Console provides workflows that simplify resource provisioning and database management. Additionally, Vertica provides configuration defaults and recommendations for each cloud provider.
7.1 - Managing an Eon Mode database in the cloud
After you provision your cluster and database in the cloud, the screens and techniques you use to monitor the database are the same regardless of the database mode or cluster platform.
After you provision your cluster and database in the cloud, the screens and techniques you use to monitor the database are the same regardless of the database mode or cluster platform. (Exceptions are noted in the documentation for particular features.)
Using MC to monitor your cluster, you can monitor the nodes in your subcluster, load data, run queries, and perform all other monitoring tasks for subclusters and nodes.
For details about Vertica and the supported cloud providers, see Set up Vertica on the cloud.
Monitoring primary and secondary subclusters
The Cluster > Manage page Database tab lets you monitor your database nodes in visual format. MC supports only the monitoring features on the Database tab, as described in Viewing and managing your cluster.
You can use the Manage > Subclusters tab to monitor your subcluster and nodes:
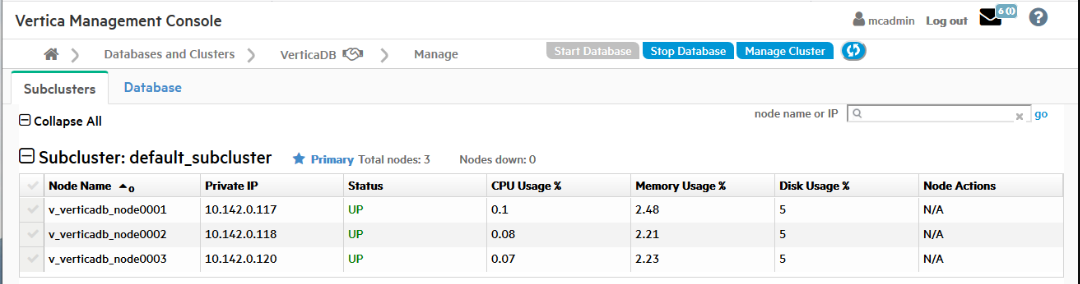
The Subclusters tab displays the following subcluster information:
In addition, the tab displays the following node information:
-
Node name
-
Private IP address
-
UP or DOWN status
-
CPU
-
Memory
-
Disk usage percentages
-
Available node actions
Searching for nodes
On the Manage > Subclusters tab in MC, you can search for a specific node or group of nodes.
In the node name or IP field above the subcluster:
-
To find a single node, enter a complete node name or IP address.
-
To find a related group of nodes, enter a partial node name or IP address that those nodes share.
7.2 - Amazon Web Services in MC
Management Console provides specific resources for managing database clusters on AWS.
Management Console provides specific resources for managing database clusters on AWS.
You can provision an Eon Mode or Enterprise Mode database cluster on AWS.
You can revive an Eon Mode database cluster on AWS. For more information, see Reviving an Eon Mode database on AWS in MC.
The MC provision and revive wizards for AWS configure separate volumes for the data, depot, catalog, and temp database directories. The specific volumes it uses for each directory depend upon the mode and the specific AWS instance type you select when you provision or revive the cluster. For details on the volumes configured for clusters on AWS, see:
7.2.1 - Creating an Eon Mode database in AWS with MC
Choose one of the following setup options:.
After you deploy Management Console on Amazon Web Services (AWS) with a CloudFormation Template, you can provision a cluster and database. Vertica clusters are provisioned in the same Virtual Private Cloud (VPC) as the Vertica Management Console. You can create an initial cluster of up to 60 hosts.
Note
See
Creating a cluster using MC if you installed Management Console with an RPM, or to provision an on-premises database and cluster.
Prerequisites
Before you begin, complete or obtain the following:
Choose one of the following setup options:
-
Quick Setup: Select your cluster size based on your estimated compressed working data size. The Management Console calculates the volume size per node, and reserves part of the disk for catalog and temp storage.
-
Advanced Setup: This option provides more granular control over configuration settings related to subnet, Node IP, and depot, temp, and catalog volume sizes.
Quick setup
-
Log in to the Vertica Management Console.
-
On the Management Console home page under Provision, click Create new database.
-
On Database Storage Mode, click Eon Mode.
-
Click Next. On Vertica License, select one of the following license mode options:
-
Community Edition: A free Vertica license to preview Vertica functionality. This license provides limited features. If you use a Community Edition license for your deployment, you can upgrade the license later to expand your cluster load. See Managing licenses form more information.
-
Premium Edition: Use your Vertica license. After you select this option, click Browse to locate and upload your Vertica license key file, or manually enter it in the field.
-
Click Next. On Setup Path, select Quick Setup.
-
Click Next. In the Vertica Settings section, select the desired Vertica database version. You can select from the latest hotfix of recent Vertica releases. For each database version, you can also select the operating system. See Choose a Vertica AMI Operating Systems for available OS and major version options.
-
In the AWS EC2 Instance Type section, select from one of the following instance types:
-
Ephemeral Depot
-
EBS Depot
-
In the Cluster Size section, select the number of instances to deploy with your cluster based on your working data size. For details about working data size, see Configuring your Vertica cluster for Eon Mode.
Note
If you are using a Community Edition license, your cluster size selections are limited to Small, Medium, and Large.
-
In the Database Parameters section, supply the following information:
-
Database Name: The name for your new database. See Creating a database name and password for database name requirements.
-
Administrator Username: The name of the database superuser.
-
Administrator Password: The password for the database administrator user account. For details, see Password guidelines.
-
Confirm Password: Reenter the Administrator Password.
-
Load Sample Data: Optional. Click the slider to the right to preload your database with example clickstream data. This option is useful if you are testing features and want some preloaded data in the database to query.
-
In the AWS Environment section, supply the following information:
-
AWS Key Pair: Your Amazon key pair for SSH access to EC2 instances.
-
IP Access: The cluster IP address range for SSH and client access to cluster hosts.
-
S3 Communal Storage URL: The path to a new subfolder in your existing AWS S3 bucket for Communal Storage of your Eon Mode database. Vertica creates the subfolder in the existing S3 bucket.
Note
Use an existing S3 bucket in the same region as your Management Console instance.
-
Tag EC2 Instances: Optional. Assign distinct, searchable metadata tags to the instances in this cluster. Many organizations use labels to organize, track responsibility, and assign costs for instances.
To add a tag, click the slider to the right to display the Tag Name and Tag Value fields. Click Add to create the tag. Added tags are displayed below the fields.
-
Click Create Database Cluster to create a Eon Mode cluster on AWS.
Advanced setup
-
Log in to the Vertica Management Console.
-
On the Management Console home page under Provision, click Create new database.
-
On Database Storage Mode, click Eon Mode.
-
Click Next. On Vertica License, select one of the following license mode options:
-
Community Edition: A free Vertica license to preview Vertica functionality. This license provides limited features. If you use a Community Edition license for your deployment, you can upgrade the license later to expand your cluster load. See Managing licenses form more information.
-
Premium Edition: Use your Vertica license. After you select this option, click Browse to locate and upload your Vertica license key file, or manually enter it in the field.
-
Click Next. On Setup Path, select Advanced Setup.
-
Click Next. On AWS Environment, supply the following information:
-
AWS Key Pair: Your Amazon key pair for SSH access to EC2 instances.
-
AWS Subnet: The subnet for your cluster. By default, Vertica creates your cluster in the same subnet as your MC instance.
Important
Use security groups and network access control lists (ACLs) to secure your subnet. For details, see the
Amazon documentation.
-
IP Access: The cluster IP address range for SSH and client access to cluster hosts.
-
Node IP Setting: Select Private, Public, or Elastic. For details about each option, see the Amazon documentation.
-
S3 Communal Storage URL: The path to a new subfolder in your existing AWS S3 bucket for Communal Storage of your Eon Mode database. Vertica creates the subfolder in the existing S3 bucket.
Note
Use an existing S3 bucket in the same region as your Management Console instance.
-
Tag EC2 Instances: Optional. Assign distinct, searchable metadata tags to the instances in this cluster. Many organizations use labels to organize, track responsibility, and assign costs for instances.
To add a tag, click the slider to the right to display the Tag Name and Tag Value fields. Click Add to create the tag. Added tags are displayed below the fields.
-
Click Next. Database Parameters accepts information about your Vertica license. Supply the following information:
-
Database Name: The name for your new database. See Creating a database name and password for database name requirements.
-
Administrator Username: The name of the database superuser.
-
Administrator Password: The password for the database administrator user account. For details, see Password guidelines.
-
Confirm Password: Reenter the Administrator Password.
-
Vertica Version: Select the desired Vertica database version. You can select from the latest hotfix of recent Vertica releases. For each database version, you can also select the operating system. See Choose a Vertica AMI Operating Systems for available OS and major version options.
-
Load Sample Data: Optional. Click the slider to the right to preload your database with example clickstream data. This option is useful if you are testing features and want some preloaded data in the database to query.
-
Click Next. On AWS Configuration, supply the following information:
-
Number of Nodes: The initial number of nodes for your database.
-
Number of Vertica Database Shards: Sets the number of shards in your database. Vertica suggests a number of shards automatically, based on your node count. After you set this value, you cannot change it later. The shard count must be greater than or equal to the maximum subcluster count. Be sure to allow for node growth. See Configuring your Vertica cluster for Eon Mode for recommendations.
-
EC2 Instance Type: The instance types used for the nodes. See Choosing AWS Eon Mode Instance Types for a list of recommended AWS instances. For details about each instance type, see the Amazon EC2 Instance Types documentation.
-
Local Storage: Customize your cluster according to your storage needs. For guidance, see Eon Mode volume configuration defaults for AWS for the Vertica default settings for each supported instance.
-
Click Next. On Review, confirm your selections. Click Edit to return to a previous section and make changes.
-
When you are satisfied with your selections, click the I accept the terms and conditions checkbox.
-
Click Create Cluster to create a Eon Mode cluster on AWS.
After creating the database
After you create the database, click Get Started to view the Fast Tasks page. To view your database, select Manage and View Your Vertica Database to go to the database Overview.
You can also view your database from the Recent Databases section of the MC home page.
For additionalinformation about managing your cluster, instances, and database using Management Console, see Managing database clusters .
7.2.2 - Creating an Enterprise Mode database in AWS with MC
After the cluster and database is successfully created, click Get Started to view the Fast Tasks page.
After you deploy Management Console on Amazon Web Services (AWS) with a CloudFormation Template, you can provision a cluster and database. Vertica clusters are provisioned in the same Virtual Private Cloud (VPC) as the Vertica Management Console. You can create an initial cluster of up to 60 hosts.
Note
See
Creating a cluster using MC if you installed Management Console with an RPM, or to provision an on-premises database and cluster.
Prerequisites
Before you begin, complete or obtain the following:
Provisioning a cluster and database
-
Log in to the Vertica Management Console.
-
On the Management Console home page under Provision, click Create New Database.
-
On Database Storage Mode, click Enterprise Mode.
-
Click Next. Create a New Vertica Cluster | mode: Enterprise provides you with two workflow options for creating your database. Select one of the following:
-
Click Next. On Enter AWS Credentials and preferences, AWS Region is filled with the region of the Management Console host. Supply the following information:
-
AWS Subnet: Under Show Advanced Options. Select the subnet used to create your cluster.
-
AWS Access Key ID: Displayed if MC was configured to use the AWS Access Keys authentication method. Enter your access key.
-
AWS Secret Access Key: Displayed if MC was configured to use the AWS Access Keys authentication method. Enter the password associated with the AWS Access Key ID.
-
AWS Key Pair: Your Amazon key pair for SSH access to EC2 instances.
-
CIDR Range: The cluster IP address range for SSH and client access to cluster hosts.
-
Click Next. Enter Vertica database name and login credentials accepts information about your Vertica license. Supply the following information:
-
Vertica Database Name: The name for your new database. See Creating a database name and password for database name requirements.
-
Vertica Version: Custom Create mode only. Select the desired Vertica database version. You can select from the latest hotfix of recent Vertica releases. For each database version, you can also select the operating system. See Choose a Vertica AMI Operating Systems for available OS and major version options.
-
Vertica Database User Name: The name of the database superuser.
-
Password: The password associated with the database username. For details, see Password guidelines.
-
Confirm Password: Reenter the Password.
-
Database Node Count: The number of nodes that you want to deploy in this cluster. Quick Create mode provides options for 1 or 3 database node counts.
-
Vertica License: Custom Create mode only. Click Browse to locate and upload your Vertica license key file. If you do not supply a license key file here, the wizard deploys your database with a Vertica Community Edition license. This license has a three node limit, so the value in the Database Size filed cannot be larger than 3 if you do not supply a license. If you use a Community Edition license for your deployment, you can upgrade the license later to expand your cluster load more than 1TB of data. See Managing licenses form more information.
-
Load example test data: Optional. Click the checkbox to preload your database with example clickstream data. This option is useful if you are testing features and want some preloaded data in the database to query.
-
Click Next. Specify cloud instance and main data storage info provides options to let you customize your instance configuration. In Quick Create mode, the options on this screen are pre-selected and read-only.
Database Data Path is filled with the path to your persistent database storage.
EBS Volume Type and EBS Volume Size (GB) per Volume per Available Node fields are filled with default values for the selected EC2 Instance Type. See Eon Mode volume configuration defaults for AWS for more information.
In Custom Create mode, supply information for the following:
-
EC2 Instance Type: The instance type your cluster deploys. See Supported AWS instance types for more information.
-
EBS Volume Type: The block-level storage type for each node in your cluster. See Enterprise Mode volume configuration defaults for AWS for recommendations about supported volume types.
-
EBS Volume Size (GB) per Volume per Available Node: The amount of disk space available on each disk attached to each node in your cluster. This field shows you the total disk space available per node in your cluster.
-
Enable EBS Volume Encryption: Optional. Select the checkbox if you want server-level encryption on your EC2 instances. With AWS, only 4th and 5th generation instance types (c4/5, r4/5, and m4/5) support encryption.
-
Node IP setting: Select Private, Public, or Elastic. For details about each option, see the Amazon documentation.
-
Click Next. Specify additional storage and tag info lets you allocate additional storage for your cluster. In Quick Create mode, the options on this screen are pre-selected and read-only.
-
Database Catalog Path is the location of the local copy of the database catalog. Database Temp Path is the temporary storage space for each node, if the node instance type includes the temporary storage option.
-
In Custom Create mode, select or enter a value for EBS Volume Type, EBS Volume Size (GB) per Volume per Available Node, and Enable EBS Volume Encryption under each path. Each field has the same definition as described in the previous step.
-
Tag EC2 instances: Optional. Assign distinct, searchable metadata tags to the instances in this cluster. Many organizations use labels to organize, track responsibility, and assign costs for instances.
After you click the checkbox, the Tag Name and Tag Value fields are displayed. Click Add to create the tag. Added tags are displayed below the fields.
-
Click Next. On the Review screen, confirm your selections. To edit your selections, click Back until you reach the screen containing information that you want to edit.
-
When you are satisfied with your selections, click the Accept terms and conditions of the "Software Only Terms" for your territory checkbox.
-
Click Create to create an Enterprise Mode cluster on AWS.
After the cluster and database is successfully created, click Get Started to view the Fast Tasks page. To view your database, select Manage and View Your Vertica Database to go to the database Overview.
You can also view your database from the Recent Databases section of the MC home page.
See Managing database clusters for further managing your cluster, instances, and database using Management Console.
7.2.3 - Reviving an Eon Mode database on AWS in MC
You can also revive a database using admintools.
Important
You can also revive a database using
admintools. You must use admintools in order to revive a database on an existing cluster. For example, use admintools if you stopped a cluster whose hosts use instance storage where data is not persistently stored, and plan to bring back the database on the same cluster.
An
Eon Mode database keeps an up-to-date version of its data and metadata in its communal storage location. After a cluster hosting an Eon Mode database is terminated, this data and metadata continue to reside in communal storage. When you revive the database later, Vertica uses the data in this location to restore the database in the same state on a newly provisioned cluster.
If Management Console has been installed using a CloudFormation template from the AWS Marketplace, you can use the Provision and Revive wizard in Management Console.
During a revive of your database, when you select a Vertica version that is higher than the version of the original database in the communal storage, Vertica upgrades your database to match the Vertica version you selected. This upgrade may cause the database revive to take longer. To bypass this upgrade, select the Vertica version of your original database.
Note
After upgrading a Vertica database, you can not revert to an earlier version.
Prerequisites
-
Communal storage location (an AWS S3 bucket) of the stopped Eon Mode database you plan to revive. For guidance, see Viewing and managing your cluster.
-
Username and password of the Eon Mode database you plan to revive.
-
AWS account with permissions to create a VPC, subnet, security group, instances, and roles.
-
Amazon key pair for SSH access to an instance.
Revive the database on the cloud
You use a wizard in Management Console to provision a new cluster on AWS and revive a database onto it. For the new cluster, Management Console automatically provisions the same number of AWS instances used by the database when it was last shut down.
Caution
You should not use the same communal storage location for running multiple databases, as it causes data corruption. To avoid corruption, you should also never use the revive functionality to simultaneously run the same Eon Mode database on different clusters.
-
From the Management Console home page, click Provision and Revive an Eon Mode Database. The Provision and Revive an Eon Mode Database wizard opens.
-
Enter your cloud credentials and cluster preferences. Your cluster must be in the same region as your communal storage location's S3 bucket. To revive the cluster in a new region, you must:
-
Create an S3 bucket in the new region.
-
Copy the previous S3 bucket's contents into it.
-
Provide the new S3 bucket URL in Step 3.
-
By default, Vertica creates your cluster in the same subnet as your Management Console instance. If you want to manage all Vertica clusters in the same VPC, you can provision your Vertica database in a different subnet than the Management Console instance. To do so, on the AWS Credentials page, select Show Advanced Options and enter a value in the Subnet field.
Important
If you specify a different subnet for your database, make sure to secure the subnet.
-
Enter the S3 URL of the database you are reviving. When you enter an S3 bucket location, Management Console discovers all known Eon Mode databases.
-
Select the correct database to revive.
-
Provide the database administrator credentials for the database you are reviving. These credentials are the same as the ones used by the database in the previous cluster.
-
In the Database Version field, choose the desired Vertica database version. Select from the latest hotfix of recent Vertica releases. For each Vertica version, you can select from a list of associated Linux operating systems.
If you select a Vertica version that is higher than the version of the original database in the communal storage, Vertica upgrades your database to match the Vertica version you selected. This upgrade may cause the database revive to take longer. To bypass this upgrade, select the Vertica version of your original database.
Note
After your Vertica database has been upgraded, you can not downgrade your database later.
-
Choose instance types for the cluster. Management Console provisions the same number of instances used by the database when it was last shut down.
The MC populates the existing paths for the depot, catalog, and temp directories.
Note
You cannot persist the catalog with ephemeral instances.
The last step displays a confirmation page showing the configured volumes. For details on the volume configurations that MC provides, see Eon Mode volume configuration defaults for AWS and Enterprise Mode volume configuration defaults for AWS.
Caution
To ensure against data loss, choose instances that use EBS storage. EBS storage is durable, while instance store is temporary. For Eon mode, Management Console displays an alert to inform the user of the potential data loss when terminating instances that support instance store.
-
Choose whether to encrypt your EBS volumes. With AWS, only 4th and 5th generation instance types (c4, r4, and m4; c5, r5, and m5) support encrypting EBS volumes.
-
Optionally, you can tag the instances. In the Tag EC2 instances field, if another cluster is already running, Management Console fills those fields with the tag values for the first instance in the cluster. You can accept the defaults, or enter new tag values.
-
Review your choices, accept the license agreement, and click Create to revive the database on a new cluster. If the version of Management Console you use to revive is higher than that of the database, Management Console first notifies you that it is about to automatically upgrade the database. After starting the revive process, the wizard displays its progress. After a successful revive, the database starts automatically.
Important
If the database fails to start automatically, check the controlmode setting in /opt/vertica/config/admintools.conf. This setting must be compatible with the network messaging requirements of your Eon implementation. AWS relies on unicast messaging, which is compatible with a controlmode setting of point-to-point (pt2pt). If the source database controlmode setting was broacast and you migrate to S3/AWS communal storage, you must change controlmode with admintools:
$ admintools -t re_ip -d dbname -T
When the revive process is complete, click Get Started to navigate to the Fast Tasks page.
7.2.4 - Eon Mode volume configuration defaults for AWS
When you provision or revive an Eon Mode database cluster, Management Console configures separate volumes for the depot, catalog, and temp directories.
When you provision or revive an Eon Mode database cluster, Management Console configures separate volumes for the depot, catalog, and temp directories. The specific volumes and sizes that Management Console configures vary depending on the AWS instance type you select when provisioning or reviving the cluster.
MC follows these rules when allocating resources for these directories for an Eon Mode database cluster:
-
Depot: Allocate instance store if available with the selected instance type. Otherwise, allocate EBS volumes. (In Eon Mode on AWS, S3 is the backup.)
-
Catalog: Always allocate an EBS volume, to ensure the catalog is durable.
-
Temp: Allocate instance store if available with the selected instance type. Otherwise, allocate EBS volumes.
Note
Table below includes all instances types that include instance store.
|
Instance Type API Name |
Instance Storage |
Depot |
Catalog |
Temp |
|
Supported EBS Volumes |
N/A |
Configurable 8 EBS volumes
Default to 75G per volume
|
Configurable 1 EBS volume
Default to 50G
|
Configurable 1 EBS volume
Default to 100G
|
|
c3.4xlarge |
320 G (2 * 160 GiB SSD) |
Configurable 8 EBS volumes
Default to 75G per volume
|
Configurable 1 EBS volume
Default to 50G
|
Instance store
2x160G
|
|
c3.8xlarge |
640 G (2 * 320 GiB SSD) |
Configurable 8 EBS volumes
Default to 75G per volume
|
Configurable 1 EBS volume
Default to 50G
|
Instance store
2x320G
|
|
c5d.4xlarge |
4000 G (1 * 400 GiB SSD) |
Configurable 8 EBS volumes
Default to 75G per volume
|
Configurable 1 EBS volume
Default to 50G
|
Instance store
1x400G
|
|
i3.4xlarge |
3800 G (2 * 1900 GiB NVMe SSD) |
Instance store
1x1900G
|
Configurable 1 EBS volume
Default to 50G
|
Instance store
1x1900G
|
|
i3.8xlarge |
7600 G (4 * 1900 GiB NVMe SSD) |
Instance store
3x1900G
|
Configurable 1 EBS volume
Default to 50G
|
Instance store
1x1900G
|
|
i3.16xlarge |
15200 G (8 * 1900 GiB NVMe SSD) |
Instance store
6x1900G
|
Configurable 1 EBS volume
Default to 50G
|
Instance store
2x1900G
|
|
i3en.3xlarge |
7500 G (1 * 7500 GiB NVMe SSD) |
Configurable 8 EBS volumes
Default to 75G per volume
|
Configurable 1 EBS volume
Default to 50G
|
Instance Store
1x7500G
|
|
i3en.6xlarge |
15000 G (2 * 7500 GiB NVMe SSD) |
Instance store
1x7500G
|
Configurable 1 EBS volume
Default to 50G
|
Instance Store
1x7500G
|
|
i3en.12xlarge |
30000 G (4 * 7500 GiB NVMe SSD) |
Instance store
3x7500G
|
Configurable 1 EBS volume
Default to 50G
|
Instance Store
1x7500G
|
|
i4i.4xlarge |
3750 G (1 * 3750 GiB NVMe SSD) |
Configurable 8 EBS volumes
Default to 75G per volume
|
Configurable 1 EBS volume
Default to 50G
|
Instance store
1x3750G
|
|
i4i.8xlarge |
7500 G (2 * 3750 GiB NVMe SSD) |
Instance Store
1x3750G
|
Configurable 1 EBS volume
Default to 50G
|
Instance store
1x3750G
|
|
i4i.16xlarge |
15000 G (4 * 3750 GiB NVMe SSD) |
Instance store
3x3750G
|
Configurable 1 EBS volume
Default to 50G
|
Instance store
1x3750G
|
|
m5d.4xlarge |
600 G (2 * 300 GiB NVMe SSD) |
Configurable 8 EBS volumes
Default to 75G per volume
|
Configurable 1 EBS volume
Default to 50G
|
Instance store
2x300G
|
|
m5d.8xlarge |
1200 G (2 * 600 GiB NVMe SSD) |
Configurable 8 EBS volumes
Default to 75G per volume
|
Configurable 1 EBS volume
Default to 50G
|
Instance store
2x600G
|
|
m5d.12xlarge |
1800 G (2 * 900 GiB NVMe SSD) |
Instance store
1x900G
|
Configurable 1 EBS volume
Default to 50G
|
Instance store
1x900G
|
|
m5d.16xlarge |
2400 G (4 * 600 GiB NVMe SSD) |
Instance store
3x600G
|
Configurable 1 EBS volume
Default to 50G
|
Instance store
1x600G
|
|
r3.4xlarge |
32G (1 * 320G SSD) |
Configurable 8 EBS volumes
Default to 75G per volume
|
Configurable 1 EBS volume
Default to 50G
|
Instance store
320G
|
|
r3.8xlarge |
640 G (2 * 320 GiB SSD) |
Configurable 8 EBS volumes
Default to 75G per volume
|
Configurable 1 EBS volume
Default to 50G
|
Instance store
2x320G
|
|
r5d.4xlarge |
600 G (2 * 300 GiB NVMe SSD) |
Configurable 8 EBS volumes
Default to 75G per volume
|
Configurable 1 EBS volume
Default to 50G
|
Instance store
2x300G
|
|
r5d.8xlarge |
1200 G (2 * 600 GiB NVMe SSD) |
Configurable 8 EBS volumes
Default to 75G per volume
|
Configurable 1 EBS volume
Default to 50G
|
Instance store
2x600G
|
|
r5d.12xlarge |
1800 G (2 * 900 GiB NVMe SSD) |
Instance store
1x900G
|
Configurable 1 EBS volume
Default to 50G
|
Instance store
1x900G
|
|
r5d.16xlarge |
2400 G (4 * 600 GiB NVMe SSD) |
Instance store
3x600G
|
Configurable 1 EBS volume
Default to 50G
|
Instance store
1x600G
|
Supported EBS volumes
-
c4.4xlarge
-
c4.8xlarge
-
c5.4xlarge
-
c5.9xlarge
-
c6i.4xlarge
-
c6i.8xlarge
-
c6i.12xlarge
-
c6i.16xlarge
-
c6i.24xlarge
-
c6i.32xlarge
-
m4.4xlarge
-
m4.10xlarge
-
m5.4xlarge
-
m5.8xlarge
-
m5.12xlarge
-
r4.4xlarge
-
r4.8xlarge
-
r4.16xlarge
-
r5.4xlarge
-
r5.8xlarge
-
r5.12xlarge
-
r6i.4xlarge
-
r6i.8xlarge
-
r6i.12xlarge
-
r6i.16xlarge
-
r6i.24xlarge
-
r6i.32xlarge
7.2.5 - Enterprise Mode volume configuration defaults for AWS
When you provision an Enterprise Mode database cluster, Management Console configures separate volumes for the data, catalog, and temp directories.
When you provision an Enterprise Mode database cluster, Management Console configures separate volumes for the data, catalog, and temp directories.
The specific volumes and sizes that MC uses vary depending on the AWS instance type you select when provisioning the cluster.
MC follows these rules when selecting resources for these directories for an Enterprise Mode database cluster:
-
Data: Always use EBS volumes, to ensure the data is durable.
-
Catalog: Always use an EBS volume, to ensure the catalog is durable.
-
Temp: If the chosen instance type offers instance store, then use volumes from instance store.
Note
Table below includes all instance types that include instance store.
|
Instance Type API Name |
Instance Storage |
Data |
Catalog |
Temp |
|
Supported EBS Volumes |
N/A |
Configurable 8 EBS volumes
Default to 75G per volume
|
Configurable 1 EBS volume
Default to 50G
|
Configurable 1 EBS volume
Default to 100G
|
|
c3.4xlarge |
320 G (2 * 160 GiB SSD) |
Configurable 8 EBS volumes
Default to 75G per volume
|
Configurable 1 EBS volume
Default to 50G
|
Instance Store
2x160G
|
|
c3.8xlarge |
640 G (2 * 320 GiB SSD) |
Configurable 8 EBS volumes
Default to 75G per volume
|
Configurable 1 EBS volume
Default to 50G
|
Instance Store
2x320G
|
|
c5d.4xlarge |
400 G (1 * 400 GiB SSD) |
Configurable 8 EBS volumes
Default to 75G per volume
|
Configurable 1 EBS volume
Default to 50G
|
Instance Store
1x400G
|
|
i3.4xlarge |
3800 G (2 * 1900 GiB NVMe SSD) |
Configurable 8 EBS volumes
Default to 75G per volume
|
Configurable 1 EBS volume
Default to 50G
|
Instance Store
2x1900G
|
|
i3.8xlarge |
7600 G (4 * 1900 GiB NVMe SSD) |
Configurable 8 EBS volumes
Default to 75G per volume
|
Configurable 1 EBS volume
Default to 50G
|
Instance Store
4x1900G
|
|
i3.16xlarge |
15200 G (8 * 1900 GiB NVMe SSD) |
Configurable 8 EBS volumes
Default to 75G per volume
|
Configurable 1 EBS volume
Default to 50G
|
Instance Store
8x1900G
|
|
i3en.3xlarge |
7500 G (1 * 7500 GiB NVMe SSD) |
Configurable 8 EBS volumes
Default to 75G per volume
|
Configurable 1 EBS volume
Default to 50G
|
Instance Store
1x7500G
|
|
i3en.6xlarge |
15000 G (2 * 7500 GiB NVMe SSD) |
Configurable 8 EBS volumes
Default to 75G per volume
|
Configurable 1 EBS volume
Default to 50G
|
Instance Store
2x7500G
|
|
i3en.12xlarge |
30000 G (4 * 7500 GiB NVMe SSD) |
Configurable 8 EBS volumes
Default to 75G per volume
|
Configurable 1 EBS volume
Default to 50G
|
Instance Store
4x7500G
|
|
i4i.4xlarge |
3750 G (1 * 3750 GiB NVMe SSD) |
Configurable 8 EBS volumes
Default to 75G per volume
|
Configurable 1 EBS volume
Default to 50G
|
Instance Store
1x3750G
|
|
i4i.8xlarge |
7500 G (2 * 3750 GiB NVMe SSD) |
Configurable 8 EBS volumes
Default to 75G per volume
|
Configurable 1 EBS volume
Default to 50G
|
Instance Store
2x3750G
|
|
i4i.16xlarge |
15000 G (4 * 3750 GiB NVMe SSD) |
Configurable 8 EBS volumes
Default to 75G per volume
|
Configurable 1 EBS volume
Default to 50G
|
Instance Store
4x3750G
|
|
r3.4xlarge |
320 G (1 * 320 GiB SSD) |
Configurable 8 EBS volumes
Default to 75G per volume
|
Configurable 1 EBS volume
Default to 50G
|
Instance Store
320G
|
|
m5d.4xlarge |
600 G (2 * 300 GiB NVMe SSD) |
Configurable 8 EBS volumes
Default to 75G per volume
|
Configurable 1 EBS volume
Default to 50G
|
Instance Store
2x300G
|
|
m5d.8xlarge |
1200 G (2 * 600 GiB NVMe SSD) |
Configurable 8 EBS volumes
Default to 75G per volume
|
Configurable 1 EBS volume
Default to 50G
|
Instance Store
2x600G
|
|
m5d.12xlarge |
1800 G (2 * 900 GiB NVMe SSD) |
Configurable 8 EBS volumes
Default to 75G per volume
|
Configurable 1 EBS volume
Default to 50G
|
Instance Store
2x900G
|
|
m5d.16xlarge |
2400 G (4 * 600 GiB NVMe SSD) |
Configurable 8 EBS volumes
Default to 75G per volume
|
Configurable 1 EBS volume
Default to 50G
|
Instance Store
4x600G
|
|
r3.8xlarge |
640 G (2 * 320 GiB SSD) |
Configurable 8 EBS volumes
Default to 75G per volume
|
Configurable 1 EBS volume
Default to 50G
|
Instance Store
2x320G
|
|
r5d.4xlarge |
600 G (2 * 300 GiB NVMe SSD) |
Configurable 8 EBS volumes
Default to 75G per volume
|
Configurable 1 EBS volume
Default to 50G
|
Instance Store
2x300G
|
|
r5d.8xlarge |
1200 G (2 * 600 GiB NVMe SSD) |
Configurable 8 EBS volumes
Default to 75G per volume
|
Configurable 1 EBS volume
Default to 50G
|
Instance Store
2x600G
|
|
r5d.12xlarge |
1800 G (2 * 900 GiB NVMe SSD) |
Configurable 8 EBS volumes
Default to 75G per volume
|
Configurable 1 EBS volume
Default to 50G
|
Instance Store
2x900G
|
|
r5d.16xlarge |
2400 G (4 * 600 GiB NVMe SSD) |
Configurable 8 EBS volumes
Default to 75G per volume
|
Configurable 1 EBS volume
Default to 50G
|
Instance Store
4x600G
|
Supported EBS volumes
-
c4.4xlarge
-
c4.8xlarge
-
c5.4xlarge
-
c5.9xlarge
-
c6i.4xlarge
-
c6i.8xlarge
-
c6i.12xlarge
-
c6i.16xlarge
-
c6i.24xlarge
-
c6i.32xlarge
-
m4.4xlarge
-
m4.10xlarge
-
m5.4xlarge
-
m5.8xlarge
-
m5.12xlarge
-
r4.4xlarge
-
r4.8xlarge
-
r4.16xlarge
-
r5.4xlarge
-
r5.8xlarge
-
r5.12xlarge
-
r6i.4xlarge
-
r6i.8xlarge
-
r6i.12xlarge
-
r6i.16xlarge
-
r6i.24xlarge
-
r6i.32xlarge
7.2.6 - Add nodes to a cluster in AWS using Management Console
When you use MC to add nodes to a cluster in the cloud, MC provisions the instances, adds the new instances to the existing Vertica cluster, and then adds those hosts to the database.
When you use MC to add nodes to a cluster in the cloud, MC provisions the instances, adds the new instances to the existing Vertica cluster, and then adds those hosts to the database.
In the Vertica Management Console, you can add nodes in several ways, depending on your database mode.
For Eon Mode databases, MC supports actions for subcluster and node management for the following public and private cloud providers:
Note
Enterprise Mode does not support subclusters.
For Enterprise Mode databases, MC supports these actions:
Note
In the cloud on GCP, Enterprise Mode databases are not supported.
Adding nodes in an Eon Mode database
In an Eon Mode database, every node must belong to a subcluster. To add nodes, you always add them to one of the subclusters in the database:
Adding nodes in an Enterprise Mode database on AWS
In an Enterprise Mode database on AWS, to add an instance to your cluster:
-
On the MC Home page, click View Infrastructure to go to the Infrastructure page. This page lists all the clusters the MC is monitoring.
-
Click any cluster shown on the Infrastructure page.
-
Select View or Manage from the dialog that displays, to view its Cluster page. (In a cloud environment, if MC was deployed from a cloud template the button says "Manage". Otherwise, the button says "View".)
Note
You can click the pencil icon beside the cluster name to rename the cluster. Enter a name that is unique within MC.
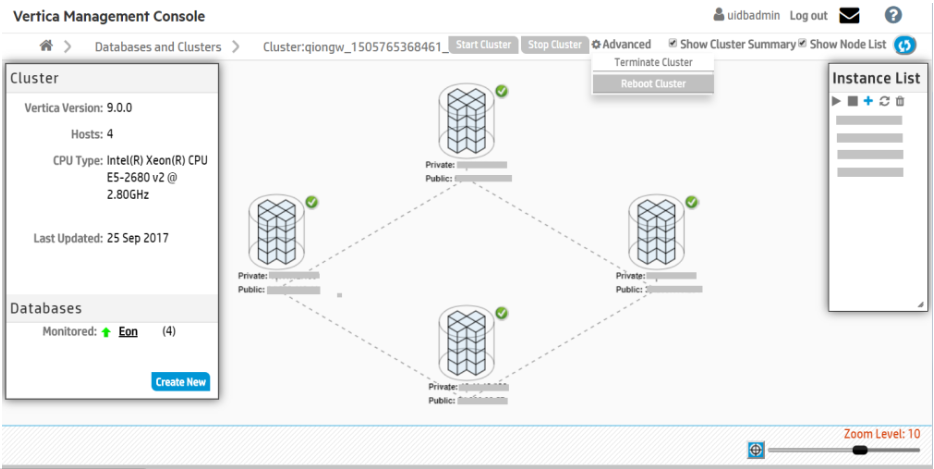
-
Click the Add (+) icon on the Instance List on the Cluster Management page.
MC adds a node to the selected cluster.
7.2.7 - Loading data from Amazon S3 using MC
You can use the Data Load Activity page in Management Console to import data from Amazon S3 storage to an existing Vertica table.
You can use the Data Load Activity page in Management Console to import data from Amazon S3 storage to an existing Vertica table. When you run a load job, Vertica appends rows to the target table you provide. If the job fails, or you cancel the job, Vertica commits no rows to the target table.
When you view your load history on the Instance tab, loading jobs initiated in MC using Amazon S3 have the name MC_S3_Load in the Stream Name column.
Prerequisites
To use the MC Load feature, you must have:
-
Access to an Amazon S3 storage account.
-
An existing table in your Vertica database to which you can copy your data. You must be the owner of the table.
-
(For non-CloudFormation Template installs) An S3 gateway endpoint.
If you aren't using a CloudFormation Template (CFT) to install Vertica, you must create an S3 gateway endpoint in your VPC. For more information, see the AWS documentation.
For example, the Vertica CFT has the following VPC endpoint:
"S3Enpoint" : {
    "Type" : "AWS::EC2::VPCEndpoint",
    "Properties" : {
    "PolicyDocument" : {
        "Version":"2012-10-17",
        "Statement":[{
        "Effect":"Allow",
        "Principal": "*",
        "Action":["*"],
        "Resource":["*"]
        }]
    },
    "RouteTableIds" : [ {"Ref" : "RouteTable"} ],
    "ServiceName" : { "Fn::Join": [ "", [ "com.amazonaws.", { "Ref": "AWS::Region" }, ".s3" ] ] },
    "VpcId" : {"Ref" : "VPC"}
}
Create a loading job
To load data from an Amazon S3 bucket to an existing table in your target database:
-
On the target database MC dashboard, click on the Load tab at the bottom of the page to view the Data Load Activity page.
-
Click on the Instance tab.
-
Click New S3 Data Load at the top-right of the tab. The Create New Amazon S3 Loading Job dialog box opens.
-
Enter your AWS account credentials and your target location information in the required fields, which are indicated by asterisks (*). Use the format S3:// for the bucket name.
-
(Optional) Specify additional options by completing the following fields:
For more about using these fields, see About configuring a data load from S3.
Cancel an initiated loading job
If a loading job is in progress, you can cancel it using the Cancel option in the Load History tab's Cancel column. Click Cancel to cancel the loading job. When you cancel a job, Vertica rolls back all rows and does not commit any data to the target table.
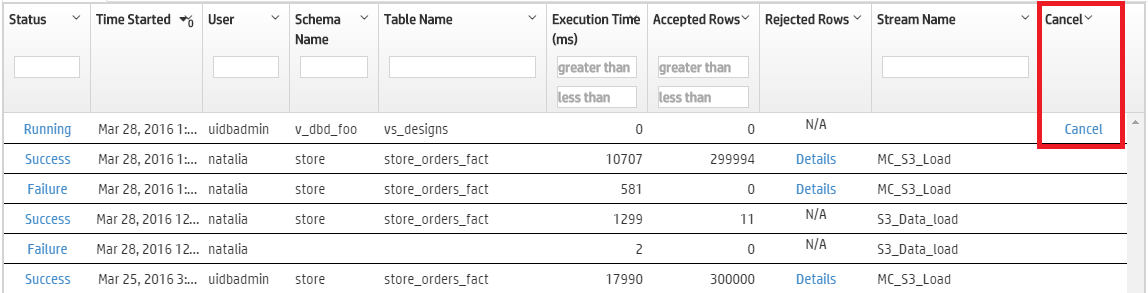
See also
7.2.7.1 - About configuring a data load from S3
When you create an S3 Data Load using MC, you have the option of further configuring the load operation.
When you create an S3 Data Load using MC, you have the option of further configuring the load operation. You can optionally specify the following:
Add COPY parameters
MC performs the load operation with COPY. You can use the COPY Parameters field to further configure the COPY operation. This field accepts parameters that are specified after the COPY statement's FROM clause. For details on these parameters and special requirements, see Parameters.
Note
The FILTER and PARSER parameters must appear in that order and precede all other parameters.
For example, you can specify the DELIMITER and SKIP parameters to separate columns with a comma, and skip one record of input data, respectively:
DELIMITER ',' SKIP 1
You can also add comments in this field with standard C comment notation.
Note
This field does not support SQL comment notation (double hyphen --).
Capture rejected data in a table
Set Capture rejected data in a table to Yes to create a table that contains rejected row data. You can view this data in the Load History tab.
This table uses the following naming convention:
schema.s3_load_rejections_target-table-name
You must have CREATE privilege on the schema if the table doesn't already exist. When you invoke multiple load processes for the same target table, MC appends all rejections data to the same table. For details, see Saving rejected data to a table.
Set a rejected records maximum
Set Reject Max to the maximum number of rows that can be rejected before the load operation fails. If COPY rejects the specified maximum rows, Vertica rolls back the entire load operation.
See also
7.2.7.2 - Viewing load history
You can view a history of all your continuous and instance loading jobs in Vertica on the Data Load Activity page.
You can view a history of all your continuous and instance loading jobs in Vertica on the Data Load Activity page.
-
Continuous jobs: Loading jobs that continuously monitor a source and stream data from the source.
-
Instance jobs: Loading jobs that batch load from a source. Instance jobs are of a fixed length and shorter-term than continuous loads.
View continuous loads
The Continuous tab on the Data Load Activity page displays history of your database’s continuous loading jobs. For example, you can see loading jobs you create using the Vertica integration with Kafka (see Apache Kafka integration). Additionally, if you enable the MC extended monitoring feature, the Continuous tab displays the continuous jobs that stream data from your monitored database to a storage database. (See Extended monitoring for more on how MC can use Kafka to monitor databases externally.)
Use the Continuous tab to view details about continuous jobs, such as their source, target tables, and other microbatch configuration details.
If extended monitoring is enabled, jobs streaming to the MC storage database show mc_dc_kafka_config as the scheduler name. Deselect Show MC data collector monitoring streams at the top of the tab to remove these jobs from the display.
In the Continuous tab, click the labels in the Scheduler, Microbatch, and Errors Last Hour to view additional details about those loading jobs.
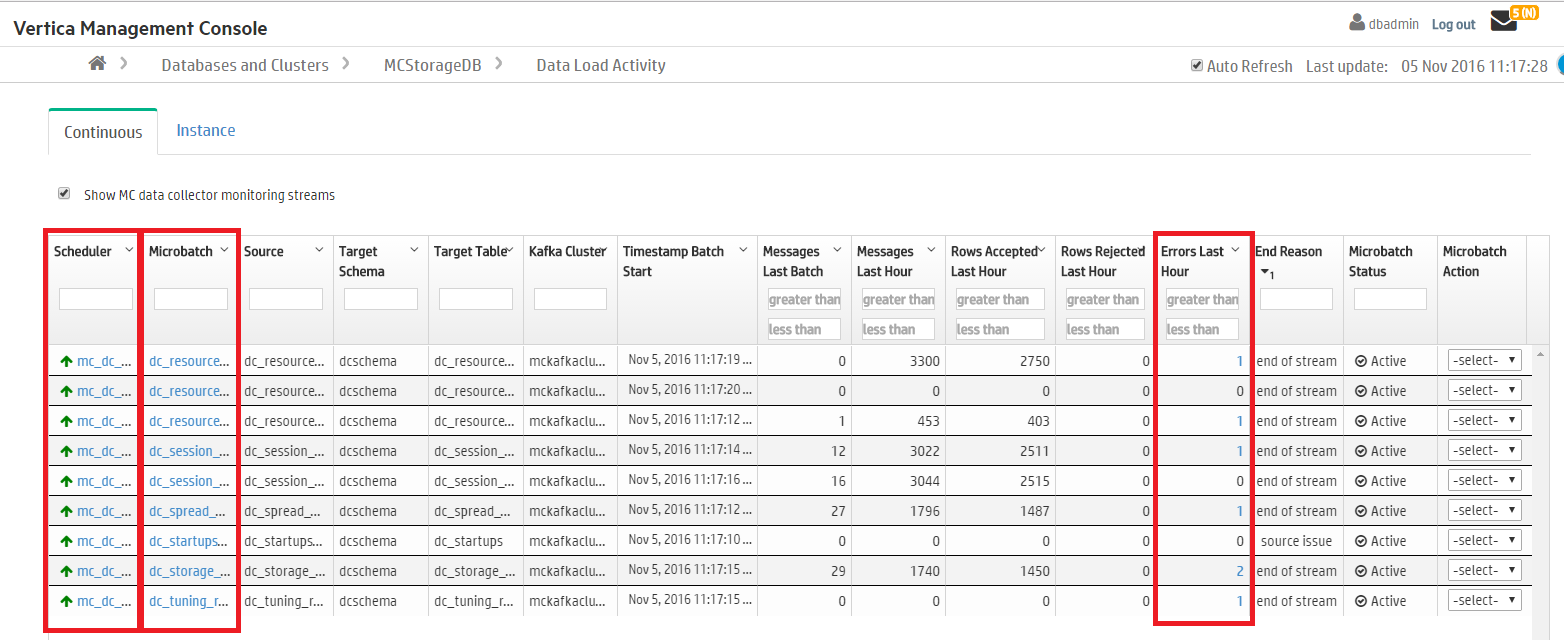
For more on continuous data streaming terminology, see Data streaming integration terms.
View load instances
In the Instance tab, you can see a history of your database's one-time loading jobs. For example, you can view instance jobs you created using the COPY command in vsql (see COPY), or instance jobs you created in MC to copy data from an Amazon S3 bucket. (For more about initiating loading jobs in MC, see Loading data from Amazon S3 using MC.)
In the Instance tab, click the labels in the Status column and Rejected Rows column to view more details about completed jobs. For more about rejected rows, see Handling messy data.
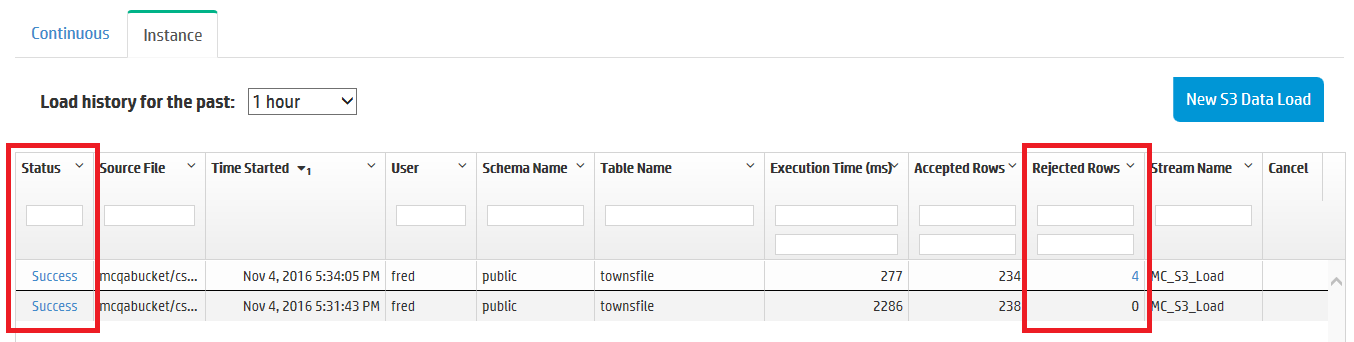
The number of load history results on the Instance tab depends on the Data collector retention policy for Requests Issued and Requests Completed. To change the retention policy, see Configuring data retention policies.
See also
7.3 - Microsoft Azure in MC
Management Console (MC) supports both Eon Mode and Enterprise Mode clusters on Microsoft Azure as described in the following table:.
Management Console (MC) supports both Eon Mode and Enterprise Mode clusters on Microsoft Azure as described in the following table:
|
Architecture |
Description |
|
Eon Mode |
Deploy an MC instance, and then provision and create an Eon Mode database from the MC. For more details, see the following:
|
|
Enterprise Mode |
Deploy a four-node database comprised of one MC instance and three database nodes. In Enterprise Mode, the database uses the MC primarily as a monitoring tool. For example, you cannot provision and create a database with an Enterprise Mode MC.
For information about creating and managing an Enterprise Mode database, see Create a database using administration tools.
|
For additional details, see Vertica on Microsoft Azure.
Provision and monitor clusters
You can use MC to provision an Eon Mode database cluster on Azure. For details, see Creating an Eon Mode cluster and database in Azure in MC.
MC provides specific resources for monitoring database clusters on Azure. For details, see Managing an Eon Mode database in the cloud.
You can revive a stopped Eon Mode database on Azure using MC. For details, see Reviving an Eon Mode database on Azure in MC.
Managing your cluster in MC
-
On the MC home page, click View Infrastructure. MC displays the Database and Cluster View. This view shows your infrastructure platform, cluster, and database.
-
On the left side of the screen next to Clusters, click the square for the cluster you want to manage. MC displays a window with your cluster name, an information summary, and several buttons.
-
Click Manage. The Cluster page displays.
-
On the Cluster page, you can view the following information:
-
The instances in your cluster in visual format.
-
The status of each instance, whether it is running.
-
The private and public IP address for each cluster instance.
-
The Vertica version that is running, your region, and your instance type in the Cluster pane.
Cluster actions on Azure in MC
On the Cluster page, you can perform the following cluster actions:
-
Start Cluster: Starts the instances, then starts the database. For Eon Mode databases, MC repopulates the nodes with data from the storage account container.
-
Stop Cluster: Stops the nodes in the database, then stops their cloud instances.
-
Advanced > Terminate: Stops the database, then terminates the cloud instances.
Subcluster management
You can add, Scale Up, Scale Down, remove, and terminate subclusters with MC. For details, see the following:
Node management
You add or delete nodes by scaling subclusters up or down. You can also start, stop, and restart nodes. For details, see the following:
Restrictions
You cannot revive an Eon Mode database with the MC.
7.3.1 - Creating an Eon Mode cluster and database in Azure in MC
After you deploy a Management Console instance on Azure, you can provision a cluster and create an Eon Mode database.
After you deploy a Management Console instance on Azure, you can provision a cluster and create an Eon Mode database.
Prerequisites
Before you begin, complete or obtain the following:
Creating the database
Complete the following steps from the Management Console:
-
Log in to the Vertica Management Console.
-
On the Management Console home page, click Eon Mode.
-
On Vertica License, select one of the following license mode options:
-
Community Edition: A free Vertica license to preview Vertica functionality. This license provides limited features. If you use a Community Edition license for your deployment, you can upgrade the license later to expand your cluster load. See Managing licenses form more information.
-
Premium Edition: Use your Vertica license. After you select this option, click Browse to locate and upload your Vertica license key file, or manually enter it in the field.
-
Click Next. On Azure Environment, supply the following information:
-
SSH Public Key: Paste the same public key used when you deployed the MC instance in the Azure Marketplace.
-
Azure Subnet: The subnet for your cluster. Select the same subnet used when you deployed the MC instance in the Azure Marketplace. If your organization requires multiple subnets for security purposes, see the Azure documentation for additional information.
-
CIDR Range: The range of IP addresses for client and SSH access. Azure requires that the last octet is 0 and the prefix is 24. For example, 10.20.30.0/24.
-
Node IP Setting: Choose Public IP - Dynamic, Public IP - Static, or Private IP. For details, see the Azure documentation.
-
Communal Storage URL: The path to a new subfolder in your existing Azure Blob storage account and container. The subfolder must not already exist.
-
Tag Azure Resources: Optional. Assign distinct, searchable metadata tags to the instances in this cluster. Many organizations use labels to organize, track responsibility, and assign costs for instances.
To add a tag, click the slider to the right to display the Tag Name and Tag Value fields. Click Add to create the tag. Added tags are displayed below the fields. Vertica recommends that you use lowercase characters in tag fields.
-
Click Next. Database Parameters accepts identifying information about your database and OS version:
-
Database Name: The name for your new database. See Creating a database name and password for database name requirements.
-
Administrator Username: The name of the database superuser.
-
Administrator Password: The password for the database administrator user account. For details, see Password guidelines.
-
Confirm Password: Reenter the Administrator Password.
-
Vertica Version: Select the desired Vertica database version. You can select from the latest hotfix of recent Vertica releases. For each database version, you can also select the operating system. For available OS and major version options, see Recommended Azure Operating Systems.
-
Load Sample Data: Optional. Click the slider to the right to preload your database with example clickstream data. This option is useful if you are testing features and want some preloaded data in the database to query.
-
Click Next. On Azure configuration, supply the following information:
-
Number of Nodes: The initial number of nodes for your database.
-
Number of Vertica Database Shards: Sets the number of shards in your database. Vertica suggests a number of shards automatically, based on your node count. After you set this value, you cannot change it later. The shard count must be greater than or equal to the maximum subcluster count. Be sure to allow for node growth. See Configuring your Vertica cluster for Eon Mode for recommendations.
-
Virtual machine (VM) size: The instance types used for the nodes. For a list of recommended instances, see Recommended Azure VM types and operating systems.
-
Local Storage per Node: Customize your cluster according to your storage needs. For the Vertica default settings for each supported instance, see Eon Mode volume configuration defaults for Azure.
-
Click Next. On Review, confirm your selections. Click Edit to return to a previous section and make changes.
-
When you are satisfied with your selections, click the I accept the terms and conditions checkbox.
-
Click Create Cluster to create a Eon Mode cluster on Azure.
After creating the database
After you create the database, click Get Started to view the Fast Tasks page. To view your database, select Manage and View Your Vertica Database to go to the database Overview.
You can also view your database from the Recent Databases section of the MC home page.
For additionalinformation about managing your cluster, instances, and database using Management Console, see Managing database clusters .
7.3.2 - Eon Mode volume configuration defaults for Azure
When you provision an Eon Mode database cluster, Management Console (MC) configures separate volumes for the depot, catalog, and temp directories.
When you provision an Eon Mode database cluster, Management Console (MC) configures separate volumes for the depot, catalog, and temp directories. The specific volumes and sizes that Management Console configures vary depending on the Azure instance type that you select when provisioning the cluster.
MC follows these rules when allocating resources for these directories for an Eon Mode database cluster:
-
Depot: Use Standard or Premium LRS to ensure the data is durable.
-
Catalog: Use Standard or Premium LRS to ensure the data is durable.
-
Temp: Allocate instance store if available with the selected instance type. Otherwise, allocate Standard or Premium LRS volumes.
If NVMe or Local SSD are displayed as volume types for an instance, there are no other choices. You must choose a different VM to change the volume type.
For details about each disk type, see the Azure documentation.
|
Instance Type |
Instance Storage |
Depot |
Catalog |
Temp |
|
E16ds v4 |
1 x 600GB |
Configurable 8 Data Disks/Managed Disk/Remote Storage
8 x 75 GB
Premium/Standard LRS
Default: Premium LRS
|
Data Disk
50 GB
Premium/Standard LRS - Durable
Default: Premium LRS
|
1 x 600GB
Temporary local SSD (ephemeral)
Display: "Local SSD"
|
|
E20ds v4 |
1 x 750 GB |
Data Disk
8 x 75 GB
|
Data Disk
50 GB
|
1 x 600GB
Temporary local SSD (ephemeral)
Display: "Local SSD"
|
|
E32ds v4 |
1 x 1200 GB |
Data Disk
8 x 75 GB
|
Data Disk
50 GB
|
1 x 600GB
Temporary local SSD (ephemeral)
Display: "Local SSD"
|
|
E48ds v4 |
1 x 1800 GB |
Data Disk
8 x 75 GB
|
Data Disk
50 GB
|
1 x 600GB
Temporary local SSD (ephemeral)
Display: "Local SSD"
|
|
E64ds v4 |
1 x 2400 GB |
Data Disk
8 x 75 GB
|
Data Disk
50 GB
|
1 x 600GB
Temporary local SSD (ephemeral)
Display: "Local SSD"
|
|
E80ids v4 |
1 x 2400 GB |
Data Disk
8 x 75 GB
|
Data Disk
50 GB
|
1 x 600GB
Temporary local SSD (ephemeral)
Display: "Local SSD"
|
|
E16s v4 |
Instance Store not supported |
Configurable 8 Data Disks
8 x 75 GB (user defined)
|
Data Disk
50 GB
|
Data Disks
1 x 300 GB (user-defined)
No less than 300 GB
Premium/Standard LRS - Durable
Default: Premium LRS 300GB
Min: 50 GB
Max: 10000 GB
Note
This instance type supports Remote storage only. Temp uses Data Disks.
|
|
E20s v4 |
Instance Store not supported |
Data Disk
8 x 75 GB
|
Data Disk
50 GB
|
Data Disks
1 x 300 GB (user-defined)
No less than 300 GB
Premium/Standard LRS - Durable
Default: Premium LRS 300GB
Min: 50 GB
Max: 10000 GB
|
|
E32s v4 |
Instance Store not supported |
Data Disk
8 x 75 GB
|
Data Disk
50 GB
|
Data Disks
1 x 300 GB (user-defined)
No less than 300 GB
Premium/Standard LRS - Durable
Default: Premium LRS 300GB
Min: 50 GB
Max: 10000 GB
|
|
E48s v4 |
Instance Store not supported |
Data Disk
8 x 75 GB
|
Data Disk
50 GB
|
Data Disks
1 x 300 GB (user-defined)
No less than 300 GB
Premium/Standard LRS - Durable
Default: Premium LRS 300GB
Min: 50 GB
Max: 10000 GB
|
|
E64s v4 |
Instance Store not supported |
Data Disk
8 x 75 GB
|
Data Disk
50 GB
|
Data Disks
1 x 300 GB (user-defined)
No less than 300 GB
Premium/Standard LRS - Durable
Default: Premium LRS 300GB
Min: 50 GB
Max: 10000 GB
|
|
E80s v4
Note
You cannot use this type to revive an Eon Mode database.
|
Instance Store not supported |
Data Disk
8 x 75 GB
|
Data Disk
50 GB
|
Data Disks
1 x 300 GB (user-defined)
No less than 300 GB
Premium/Standard LRS - Durable
Default: Premium LRS 300GB
Min: 50 GB
Max: 10000 GB
|
|
E16s v3 |
1 x 256 GB |
Data Disk
8 x 75 GB
|
Data Disk
50 GB
|
1 x 256 GB
Use Temporary local SSD
(instance store is ephemeral)
|
|
E20s v3 |
1 x 320 GB |
Data Disk
8 x 75 GB
|
Data Disk
50 GB
|
1 x 320 GB
Use Temporary local SSD
(instance store is ephemeral)
|
|
E32s v3 |
1 x 512 GB |
Data Disk
8 x 75 GB
|
Data Disk
50 GB
|
1 x 512 GB
Use Temporary local SSD
(instance store is ephemeral)
|
|
E48s v3 |
1 x 768 GB |
Data Disk
8 x 75 GB
|
Data Disk
50 GB
|
1 x 768 GB
Use Temporary local SSD
(instance store is ephemeral)
|
|
E64s v3 |
1 x 864 GB |
Data Disk
8 x 75 GB
|
Data Disk
50 GB
|
1 x 864 GB
Use Temporary local SSD
(instance store is ephemeral)
|
|
E64is v3
Note
You cannot use this type to revive an Eon Mode database.
|
1 x 864 GB |
Data Disk
8 x 75 GB
|
Data Disk
50 GB
|
1 x 864 GB
Use Temporary local SSD
(instance store is ephemeral)
|
7.3.3 - Reviving an Eon Mode database on Azure in MC
An
Eon Mode database keeps an up-to-date version of its data and metadata in its communal storage location. After a cluster hosting an Eon Mode database is terminated, this data and metadata continue to reside in communal storage. When you revive the database later, Vertica uses the data in this location to restore the database in the same state on a newly provisioned cluster.
Many of the fields in the revive workflow are populated with information provided during provisioning. For details about fields with existing values, see Creating an Eon Mode cluster and database in Azure in MC.
The following steps revive an Eon Mode database on Azure:
-
On the MC home page, select Revive Eon Mode database. The Provision & Revive an Eon Mode Database window opens.
-
On Specify cluster access preferences, supply the following information:
-
Azure Subnet: The subnet for your cluster. Select the same subnet used when you deployed the MC instance in the Azure Marketplace. If your organization requires multiple subnets for security purposes, see the Azure documentation for additional information.
-
SSH Public Key: Paste the same public key used when you deployed the MC instance in the Azure Marketplace.
-
CIDR Range: The range of IP addresses for client and SSH access.
-
Select Next. On Specify Azure AZB path for Communal Storage of database, you can enter a parent directory to list all available Eon Mode databases within that directory:
-
Enter the directory name. At minimum, you must provide the account and container name, and optionally subfolder names in the following format:
azb://storage-account/container[/subfolder-name/...]
-
Select Discover. The MC lists all available Eon Mode databases within the container or subfolder.
-
Select the database that you want to revive from the list.
-
Select Next. On Enter revive database configurations, supply the following information:
-
Revive to Vertica Version: Lists the currently available Vertica versions. If you select a version that is later than the version that you used to provision the database, the MC upgrades the database version automatically.
-
Password: The password for the database superuser.
-
Confirm Password: Reenter Password.
-
Select Next. On Specify cloud instance and depot data storage, supply the following information about the depot:
-
Virtual Machine (VM) Size: The machine types used for the nodes. For recommended machine types, see the memory optimized machine types in Recommended Azure VM types and operating systems.
-
Managed Disk Volume Type: Available for Azure managed disks only. For details about each disk type, see the Azure documentation.
-
Managed Disk Volume Size (GB) per Volume per Available Node: Volume size for each node. This value is populated with the volume configuration defaults for the associated instance type.
-
Node IP Setting: Choose Public IP - Dynamic, Public IP - Static, or Private IP. For details, see the Azure documentation.
-
Select Next. On Specify additional storage and tag info, supply the following information:
-
Managed Volume Type: Available only for Azure managed disks. For details about each disk type, see the Azure documentation.
-
For the catalog and temp paths, provide the following information:
-
Managed Disk Volume Type: Available only for Azure managed disks. For details about each disk type, see the Azure documentation.
-
Managed Disk Volume Size (GB) per Available Node: Volume size for each node. This value is populated with the volume configuration defaults for the associated VM type.
-
Tag Azure Resources: Optional. Assign distinct, searchable metadata tags to the instances in this cluster. Many organizations use labels to organize, track responsibility, and assign costs for instances.
To add a tag, select the checkbox to make the Tag Name and Tag Value available. Click Add to create the tag. Tags are displayed below the fields. Vertica recommends that you use lowercase characters in tag fields.
-
Select Next. On Review revive information, confirm your selections. Select Back to return to a previous section and make changes.
-
When you are satisfied with your selections, select the Accept terms and conditions checkbox.
-
Select Revive Database to revive the Eon Mode database on Azure.
For details about database clusters in Management Console, see Managing database clusters.
7.4 - Google Cloud Platform in MC
Management Console (MC) supports cluster, subcluster, and node actions on Google Cloud Platform (GCP).
Management Console (MC) supports cluster, subcluster, and node actions on Google Cloud Platform (GCP).
Provision, monitor, and revive clusters
You can use MC to provision an Eon Mode database cluster on GCP. For details, see Provision an Eon Mode cluster and database on GCP in MC.
MC provides specific resources for monitoring database clusters on GCP. For details, see Managing an Eon Mode database in the cloud.
You can revive a stopped Eon Mode database on GCP using MC. For details, see Reviving an Eon Mode database on GCP in MC.
Managing your cluster in MC
-
On the MC home page, click View Infrastructure. MC displays the Database and Cluster View. This view shows your infrastructure platform, cluster, and database.
-
On the left side of the screen next to Clusters, click the square for the cluster you want to manage. MC displays a window with your cluster name, an information summary, and several buttons.
-
Click Manage. The Cluster page displays.
-
On the Cluster page, you can view the following information:
-
The instances in your cluster in visual format.
-
The status of each instance, whether it is running.
-
The private and public IP address for each cluster instance.
-
The Vertica version that is running, your region, and your instance type in the Cluster pane.
Cluster actions on GCP in MC
On the Cluster page, you can perform the following cluster actions:
-
Start Cluster: Starts the instances, then starts the database. For Eon Mode databases, MC repopulates the nodes with data from the storage account container.
-
Stop Cluster: Stops the nodes in the database, then stops their cloud instances.
-
Advanced > Terminate: Stops the database, then terminates the cloud instances.
Note
If a GCP instance has a local SSD attached, Google does not allow you to stop the instance. If you do shut down an instance with a local SSD through the guest operating system, you will not be able to restart the instance, and the data on the local SSD will be lost.
Subcluster management
You can add, Scale Up, Scale Down, remove, and terminate subclusters with MC. For details, see the following:
Node management
You add or delete nodes by scaling subclusters up or down. You can also start, stop, and restart nodes. For details, see the following:
Restrictions
-
Subclusters are supported in Eon Mode only, not in Enterprise Mode.
-
Node actions are not supported in MC on GCP.
See also
Vertica on Google Cloud Platform
7.4.1 - GCP Eon Mode instance recommendations
When you use the MC to deploy an Eon Mode database to the Google Cloud Platform (GCP), you choose the instance type to deploy as the database's nodes.
When you use the MC to deploy an Eon Mode database to the Google Cloud Platform (GCP), you choose the instance type to deploy as the database's nodes. The default instance settings in the MC are the more conservative option (currently, n1-standard-16). They are sufficient for most workloads. However, you may choose instances with more memory (such as n1-highmem-16) if your queries perform complex joins that may otherwise spill to disk. You can also choose instances with more cores (such as n1-standard-32), if you perform highly-complex compute-intensive analysis. The following links provide additional information about GCP machine type instances and Vertica:
The more powerful instance you choose, the higher the cost per hour. You need to balance whether you want to use fewer, higher-powered but more expensive instances vs. relying on more lower-powered instances that cost less. Thanks to Eon Mode's elasticity, if you choose to use the less-powerful instances, you can always add more nodes to meet peak demands. When you reduce the number of instances to a minimum during off-peak times, you'll spend less than if you had a similar number of more-powerful instances.
Storage options
The MC's deployment wizard also asks you to select the type of local storage for your instances. You can select different options for each type of local storage that Vertica uses: the catalog, the depot, and temporary space. For all of these storage locations, you choose the type of disks to use (standard vs. SSD). You will see the best performance with SSD disks. However, SSD disks cost more.
For the depot, you also choose whether to use local or persistent disks. The local option is faster, as it resides directly on the virtual machine host. However, whenever you shut down the node, this storage is wiped clean. The persistent storage is slower than the local option, as it is not stored directly on the machine hosting the instance. However, it is not wiped out whenever you shut down the instance. See the Google Cloud documentation's Storage options page for more information.
Which of these options you choose depends on how much depot warming the nodes must perform when starting. If the content of your node's depots change little over time (or you tend to frequently start and stop instances), using persistent storage makes sense. In this case, the depot's warming period will be shorter because most of the data the node needs to participate in queries may still be in its depot when it starts. It will perform fewer fetches of data from communal storage while participating in queries.
If your working data set is rapidly changing or you tend to leave nodes stopped for extended periods of time, your best choice is usually to use local storage. In this scenario, the data in the node's depot when it restarts is usually stale. To participate in queries, the node must fetch much of the data it needs from communal storage, resulting in slower performance until it has warmed its depot. Using local ephemeral storage makes sense here, because you will get the benefit of having faster depot storage. Because your nodes have to warm their depots anyhow, there is less of a downside of having the depot on ephemeral storage.
For general guidelines on scaling your cluster for Eon Mode database, see Configuring your Vertica cluster for Eon Mode.
7.4.2 - Provision an Eon Mode cluster and database on GCP in MC
You can use Google Marketplace and MC to provision an Eon Mode database on GCP.
You can use Google Marketplace and MC to provision an Eon Mode database on GCP. The sections below give an overview of how to set up an Eon Mode database on GCP, with links to the detailed procedures
Prerequisites
Step 1: provision an MC instance using Google marketplace
These steps are an overview of the procedure. For more detailed instructions, see Deploy an MC instance in GCP for Eon Mode.
In Google Marketplace:
-
Select the Vertica Eon Mode solution.
-
Fill in the fields to configure a GCP MC instance.
-
Click the Deploy button to provision the MC instance.
-
Connect to and log into the MC instance.
You are now in the new MC instance running on GCP, and the MC home page appears.
Step 2: use the MC instance to provision an Eon Mode database on GCP
To use the MC to provision and deploy a new Eon Mode database on GCP:
-
From the MC home screen, click Create new database to launch the Create a Vertica Cluster on Google Cloud wizard.
-
On the first page of the wizard enter the following information:
-
Google Cloud Storage HMAC Access Key and HMAC Secret Key: Copy and paste the HMAC access key and secret you created earlier. You find these values on the Interoperability tab of the of the Storage Settings page. See Eon Mode on GCP prerequisites for details.
-
Zone: This value defaults to the zone containing your MC instance. Make this value is the same as the zone containing the Google Cloud Storage bucket that your database will use for communal storage.
-
Caution
You will see significant performance issues if you choose different zones for cluster instances, storage, or the MC.
-
CIDR Range: The IP address range for clients to whom you want to grant access to your database. Make this range as restrictive as possible to limit access to your database.
-
Click Next, and supply the following information:
-
Vertica Database Name: the name for your new database. See Creating a database name and password for database name requirements.
-
Vertica Version: select the desired Vertica database version. You can select from the latest hotfix of recent Vertica releases. For each database version, you can also select the operating system.
-
Vertica Database User Name: the name of the database superuser. This name defaults to dbadmin, but you can enter another user name here.
-
Password and Confirm Password: Enter a password for the database superuser account.
-
Database Size: The number of nodes in your initial database. If you specify more than three nodes here, you must supply a valid Vertica license file in the Vertica License field (below).
-
Vertica License: Click Browse to locate and upload your Vertica license key file. If you do not supply a license key file here, the wizard deploys your database with a Vertica Community Edition license. This license has a three node limit, so the value in the Database Size filed cannot be larger than 3 if you do not supply a license. If you use a Community Edition license for your deployment, you can upgrade the license later to expand your cluster load more than 1TB of data. See Managing licenses form more information.
Note
This field does not appear if you created your MC instance using a by-the-hour (BTH) launcher. The BTH license is automatically applied to all clusters you create using a BTH MC instance. For a by-the-hour license, cloud vendors charge the customer for licensed Vertica usage along with their cloud infrastructure charges.
-
Load example data: Check this box if you want your deployed database to load some example clickstream data. This option is useful if you are testing features and just want some preloaded data in the database to query.
-
Click Next and supply the following information:
-
Instance Type: the specifications of the virtual machine instances the MC will use to deploy your database nodes. See the Google Cloud documentation's Machine types page for details of each instance type. Also see GCP Eon Mode instance recommendations.
-
Database Depot Path and Disk Type: the local mount point for the depot, and the type and number of local disks dedicated to the depot for each node. You cannot change the mount path for the depot. The disks you select in the Disk Type field are only used to store the depot. On the next page of the wizard, you will configure disks for the catalog and temporary disk space. You will see the best performance when using SSD disks, although at a higher cost. You can choose to use faster local storage for your depot. However, local storage is ephemeral—GCP wipes the disk clean whenever you stop the instance. This means each time you start a node, it will have to warm its depot from scratch, rather than taking advantage of any still-current data in its depot. See the Google Cloud documentation's Storage options page for more information about the local disk options.
-
Volume Size: the amount of disk space available on each disk attached to each node in your cluster. This field shows you the total disk space available per node in your cluster. For the best practices on choosing the amount of disk space for your nodes, see Configuring your Vertica cluster for Eon Mode.
-
Data Segmentation Shards: sets the number of shards in your database. After you set this value, you cannot change it later. See Configuring your Vertica cluster for Eon Mode for recommendations. The default value is based on the number of nodes you entered in the Database size you specified earlier. It is usually sufficient, unless you anticipate greatly expanding your cluster beyond your initial node count.
-
Communal Location: a Google Cloud Storage URL that specifies where to store your database's communal data. See Eon Mode on GCP prerequisites for requirements.
-
Instance IP settings: specify whether the nodes in your database will have static or ephemeral network addresses that are accessible from the internet, or addresses that are only accessible from within the internal virtual network.
-
Click Next. The wizard validates your communal storage location URL. If there is an problem with the URL you entered, it displays an error message and prompts you to fix the URL.
After your communal storage URL passes validation, fill in the following information:
-
Database Catalog Path, Disk Type, and Size (GB) per Available Node: the mount point disk type, and disk size for the local copy of the database catalog on each node. You cannot edit the mount point. You choose the type of local disk to use for the catalog, and its size. You can only choose persistent disk storage for the catalog. SSD drives are faster, but more expensive than standard disks. The default setting for the disk size is adequate for most medium size databases. Increase the size if you anticipate maintaining a large database.
-
Database Temp Path, Disk Type, and Size (GB) per Available Node: the mount point disk type, and disk size for the temporary storage space on each node. You cannot edit the mount point. You choose the type of local disk to use, and its size. You can only choose persistent disk storage for the temporary disk space. SSD drives are faster, but more expensive than standard disks. The default setting is adequate for most databases. Consider increasing the temporary space if you perform many complex merges that spill to disk.
-
Label Instances: check this box to enable adding labels to your node's instances. Many organizations use labels to organize, track responsibility, and assign costs for instances. See the Google Cloud documentation's Labeling resources page for more information. If you choose to add labels, enter the label name and value, and click Add.
-
Click Next. Review the summary of all your database settings. If you need to make a correction, use the Back button to step back to previous pages of the wizard.
-
When you are satisfied with the database settings, check Accept terms and conditions and click Create.
The process of provisioning and creating the database takes several minutes. After it completes successfully, the MC displays a Get Started button. This button leads to a page of useful links for getting started with your new database.
See also
7.4.3 - Reviving an Eon Mode database on GCP in MC
An
Eon Mode database keeps an up-to-date version of its data and metadata in its communal storage location. After a cluster hosting an Eon Mode database is terminated, this data and metadata continue to reside in communal storage. When you revive the database later, Vertica uses the data in this location to restore the database in the same state on a newly provisioned cluster.
Follow these steps to revive an Eon Mode database on GCP:
-
On the MC home page, click Revive Eon Mode Database. MC launches the Provision and Revive an Eon Mode Database wizard.
-
On the first page of the wizard, enter the following information:
-
Google Cloud Storage HMAC Access Key and HMAC Secret Key: Copy and paste the HMAC access key and secret you created when you created the database. See Eon Mode on GCP prerequisites for details.
-
Zone: This value defaults to the zone containing your MC instance. Make this value the same as zone containing the Google Cloud Storage bucket your database will use for communal storage. You will see significant performance issues if you choose different zones for cluster instances, storage, or the MC.
-
CIDR Range: The IP address range for clients you want to grant access to your database. Make this range as restrictive as possible to limit the exposure of your database.
-
Click Next. On the second page of the wizard, set Google Storage Path for Communal Storage of Database to the URL of the communal storage bucket for the Eon Mode database to revive. For requirements, see Eon Mode on GCP prerequisites.
-
Click Discover. MC displays a list of all Eon Mode databases available on the specified communal storage location.
-
Select the database to revive. MC prepopulates the choices for the Data, Depot, and Temp catalogs, using the same machine types and configuration choices used when the database was created.
-
Click Next. Review the summary of all your database settings. If you need to make a correction, use the Back button to step back to previous pages of the wizard.
-
When you are satisfied with the database settings, check the Accept terms and conditions box and click Revive Database.
MC displays a progress screen while creating the cluster and reviving the database onto it, a process which takes several minutes. After it completes successfully, the MC displays a Get Started button. This button leads to a page of useful links for getting started with your new database.
7.4.4 - Eon Mode volume configuration defaults for GCP
Vertica supports a variety of disk volume resources for provisioning instances on Google Cloud Platform (GCP).
Vertica supports a variety of disk volume resources for provisioning instances on Google Cloud Platform (GCP).
All data is secured with Google-managed data encryption. Management Console does not support user-managed data encryption.
For performance information, see Google's Block storage performance documentation.
Persistent disk defaults
You can allocate up to 128 persistent disks (PDs). The following table describes the default persistent disk volume resources that Vertica provides:
|
Instance Types |
Catalog |
Depot |
Temp |
|
n1-standard/highmem-16
n1-standard/highmem-32
n1-standard/highmem-64
n2-standard/highmem-16
n2-standard/highmem-32
n2-standard/highmem-48
n2-standard/highmem-64
|
Configurable 1 PD (Standard/SSD) volume
Default: 50 GB
|
Configurable 8 PD (Standard/SSD) volume
Default: 600 GB
|
Configurable 1 PD (Standard/SSD) volume
Default: 100 GB
|
Local SSD defaults (ephemeral storage)
Allocate up to 24 local SSDs for ephemeral storage with the following considerations:
-
There is an extra cost for each local SSD.
-
All local SSD are 375G fixed size, with the option of SCSI or NVMe interface. An NVMe disk has twice the input/output operations per second (IOPs) compared to a SCSI disk.
Important
When the local SSD is in use, you cannot stop or start the instance or a cluster containing local SSD instances. If you do shut down an instance with a local SSD through the guest operating system, you will not be able to restart the instance and the data on the local SSD will be lost.
For details, see Google's Adding Local SSDs page.
The following table describes the default local SSD disk volume resources that Vertica provides:
|
Total Local SSDs |
Instance Types |
Catalog (Persistent) |
Depot (Ephemeral) |
Temp (Ephemeral) |
|
4 |
n1-standard/highmem-16
n1-standard/highmem-32
n1-standard/highmem-64
n2-standard/highmem-16
n2-standard/highmem-32
|
Configurable 1 PD (Standard/SSD) volume
Default: 50 GB
|
3 x 375 GB |
1 x 375 GB |
|
5 |
n1-standard/highmem-16
n1-standard/highmem-32
n1-standard/highmem-64
|
Configurable 1 PD (Standard/SSD) volume
Default: 50 GB
|
4 x 375 GB |
1 x 375 GB |
|
6 |
n1-standard/highmem-16
n1-standard/highmem-32
n1-standard/highmem-64
|
Configurable 1 PD (Standard/SSD) volume
Default: 50 GB
|
5 x 375 GB |
1 x 375 GB |
|
8 |
n1-standard/highmem-16
n1-standard/highmem-32
n1-standard/highmem-64
n2-standard/highmem-16
n2-standard/highmem-32
n2-standard/highmem-48
n2-standard/highmem-64
|
Configurable 1 PD (Standard/SSD) volume
Default: 50 GB
|
6 x 375 GB |
2 x 375 GB |
|
16 |
n1-standard/highmem-16
n1-standard/highmem-32
n1-standard/highmem-64
n2-standard/highmem-16
n2-standard/highmem-32
n2-standard/highmem-48
n2-standard/highmem-64
|
Configurable 1 PD (Standard/SSD) volume
Default: 50 GB
|
12 x 375 GB |
4 x 375 GB |
|
24 |
n1-standard/highmem-16
n1-standard/highmem-32
n1-standard/highmem-64
n2-standard/highmem-16
n2-standard/highmem-32
n2-standard/highmem-48
n2-standard/highmem-64
|
Configurable 1 PD (Standard/SSD) volume
Default: 50 GB
|
20 x 375 GB |
4 x 375 GB |
8 - Monitoring with MC
Double check all topics and their variants and fix link names.
Management Console gathers and retains history of important system activities about your MC-managed database cluster, such as performance and resource utilization. You can use MC charts to locate performance bottlenecks on a particular node, to identify potential improvements to Vertica configuration, and as a reference for what actions users have taken on the MC interface.
The following list describes some of the areas you can monitor and troubleshoot through the MC interface:
-
Multiple database cluster states and key performance indicators that report on the cluster's overall health
-
Information on individual cluster nodes specific to resources
-
Database activity in relation to CPU/memory, networking, and disk I/O usage
-
Layout of subclusters, and resource utilization and query workload on subclusters. (Available in Eon mode databases only, where the database includes one default subcluster, and may include additional user-defined subclusters.)
-
Query concurrency and internal/user sessions that report on important events in time
-
Cluster-wide messages
-
Database and agent log entries
-
MC user activity (what users are doing while logged in to MC)
-
Issues related to the MC process
-
Error handling and feedback
About chart updates
MC retrieves statistical data from the production database to keep the charts updated. The charts also update dynamically with text, color, and messages that Management Console receives from the agents on the database cluster. This information can help you quickly resolve problems.
Each client session to MC uses a connection from MaxClientSessions, a database configuration parameter. This parameter determines the maximum number of sessions that can run on a single database cluster node. Sometimes multiple MC users, mapped to the same database account, are concurrently monitoring the Overview and Activity pages.
Tip
You can increase the value for
MaxClientSessions on an MC-monitored database to account for extra sessions. See
Managing sessions for details.
8.1 - Viewing the overview page
The Overview page displays a dynamic dashboard view of your database.
The Overview page displays a dynamic dashboard view of your database.
The page provides three tabs: Status Summary, System Health, and Query Synopsis. Access these tabs by clicking one of the three icons at the top left of the Overview page. Each tab contains charts and filters displaying information about your cluster. The QuickStats widgets on the right of the page display alerts and statistics about the state of your cluster.
Information on this page updates every two minutes, however you can adjust that value in the MC Settings page on the Monitoring tab. You can postpone updates by deselecting Auto Refresh in the toolbar.
Chart viewing options
You can specify time frames for some charts, which display a calendar icon in their title bars. Click the calendar icon to specify the time frame for that module.
On the Status Summary tab, you can select Synchronize charts to simultaneously apply the specified time frame to all charts on that tab.
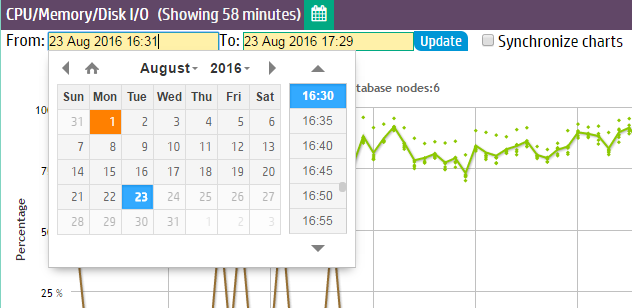
If you have enabled extended monitoring on your database, MC can display longer ranges of data in certain charts. See Extended monitoring. If a chart is using extended monitoring data, the rocket ship icon appears in the title bar:

You can expand some charts to view them in larger windows. Click the expand icon in the title bar to do so:

Changing what the chart displays
The charts on the Overview page can display information about the nodes in your database, or the activity in all your database subclusters, in a single subcluster, or on the nodes that are not assigned to a subcluster. Use the dropdown in the title bar to select the type of information you want to display in the chart.
Note
The dropdown list in the CPU/Memory/Disk I/O chart below, and all other MC charts, appears only for Eon Mode databases, and only if subclusters are defined.
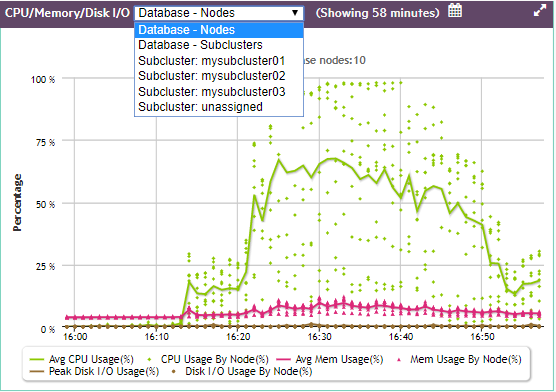
Zooming to show chart details
There are several steps you can take to show increasing levels of detail in a chart.
You can click the expand icon in the title bar to view the chart in a larger window:
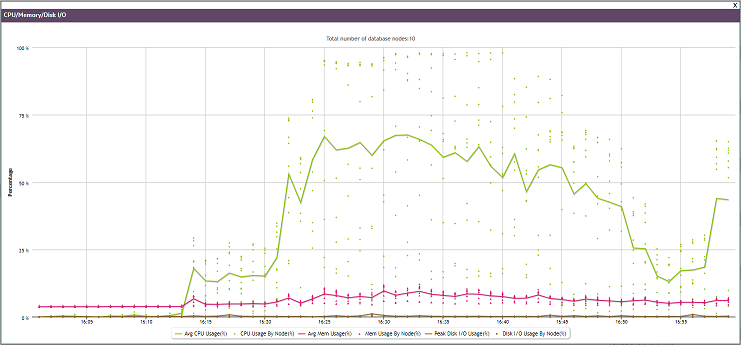
You can use the cursor to outline a small area you want to expand, shown as a gray rectangle below:
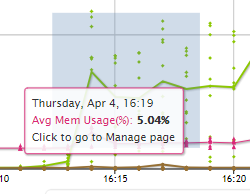
When you release the cursor, the detail area expands to full size:
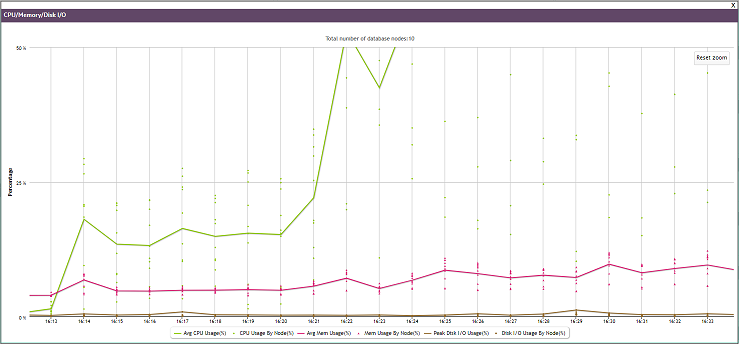
Hover over any line or point on the chart to see details about those specific data points. This works before or after you expand the chart:
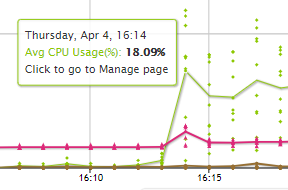
What the lines and dots on the chart represent
The legend below the CPU/Memory/Disk I/O chart explains what the lines and dots on the chart represent.
Each line represents the average of the nodes you selected in the dropdown. If you selected Database - Nodes, the line represents the average for all the nodes in the database. If you selected one subcluster, the line represents the average for the nodes in that subcluster.
Each dot represents an individual entity within your dropdown choice. If you chose Database - Nodes, each dot represents one node in the database. If you chose Database - Subclusters, each dot represents one subcluster in the database. If you chose a single subcluster or the unassigned subclusters, each dot represents an individual node within that set.
You can hover over any line or dot to see a summary about it. You can click on a dot to display the Node Details page for that dot.
Quick stats
The Quick Stats sidebar on the right of the page provides instant alerts and information about your cluster's status.
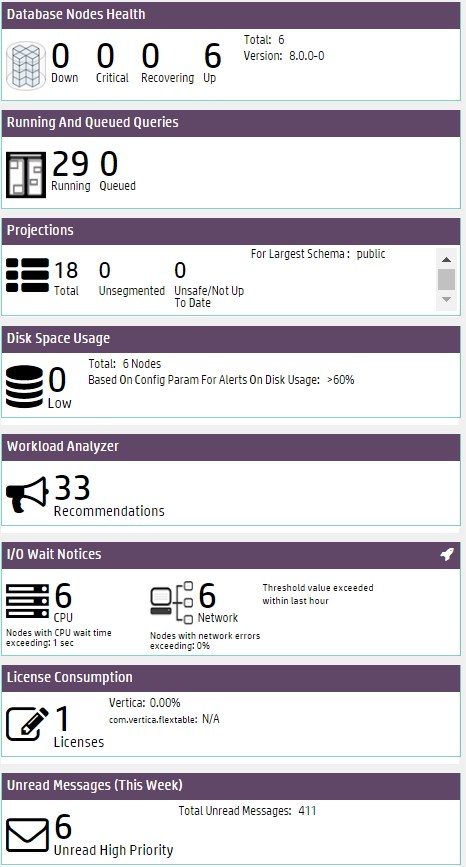
-
Database Nodes Health displays which nodes are down, critical, recovering, or up. Critical and recovering nodes are included in the total nodes considered "up" by the database. Click a node value to open the Manage page.
-
Running and Queued Queries displays current queries in the database. Click the query values to open the Query Monitoring charts.
-
Projections displays the number of total projections, unsegmented projections, and unsafe projections for the database schema with the most projections. Click a value to open the Table Treemap chart.
-
Disk Space Usage alerts you to the number of nodes that are low on disk space. Click the value to go to the Manage page. On the Manage page, the Storage Used KPI View is displayed.
-
Workload Analyzeranalyzes system information retained in SQL system tables and provides tuning recommendations, along with the cost (low, medium, or high) of running the command. See Analyzing workloads for more information.
-
I/O Wait Notices displays the number of nodes that, in the last hour, have recorded Disk I/O waits and Network I/O waits exceeding the wait threshold (1 second for Disk and 0 seconds for Network).
-
License Consumption displays the number of licenses your database uses, and the percentage of your Vertica Community Edition or Premium Edition license being used.
-
Unread Messages display the number of unread messages and alerts for the database. This count differs from the number of total messages across all your databases. Click the value to open the Message Center.
Status summary
The Status Summary tab displays four modules that provide a general overview of the status of your cluster:
-
The CPU/Memory/Disk I/O Usage module shows cluster resource usage. The chart displays the number of nodes in the database cluster and plots average and per-node percentages for CPU, memory, and disk I/O usage.
-
The General Pool Activity module displays GENERAL pool activity. The chart displays average query queue times, average GENERAL pool free memory, and resource rejections. Use this chart to see how much free memory there is in GENERAL pool, or if there have been high queue times.
-
Click the dropdown in the title bar to view the GENERAL pool usage for the entire database (the default), for a specific subcluster, or for the nodes not assigned to a subcluster.
-
Click the expand icon in the title bar to open the chart in a bigger window.
-
Click a data point to open the Resource Pools Monitoring chart. See Managing workloads.
-
The Thresholds Notifications module displays alerts generated when a threshold has been exceeded in the database. Notifications are categorized by System Health and Performance.
-
In the module, you can acknowledge an alert (which marks it as read) or click the X to stop monitoring that threshold (which stops you receiving similar alerts in the future).
-
Customize thresholds and alert priorities for these notifications in the Thresholds tab of the database Settings page. See
Customizing Message Thresholds.
-
The Queries module displays query statistics. The first pie chart displays running and queued queries in the last 24 hours. The second chart displays completed and failed queries for the time frame you specify. Click a query count number above the chart to open the Query Monitoring chart. See Monitoring running queries with MC.
System health
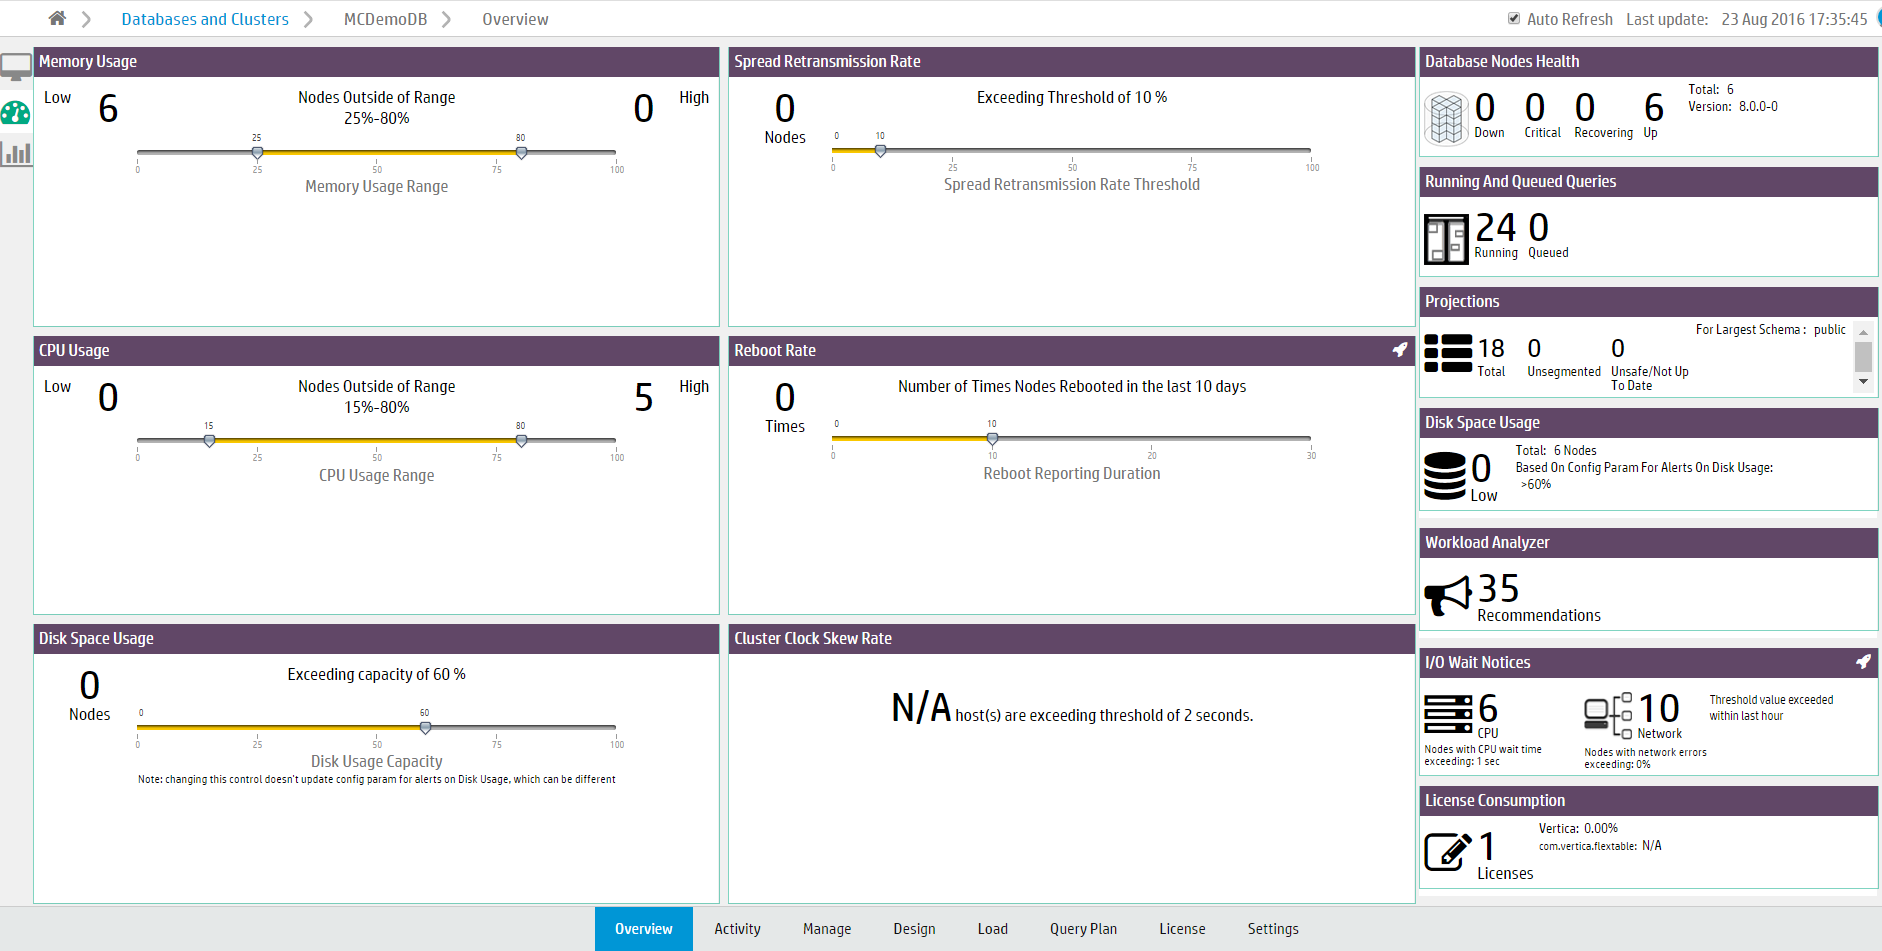
The System Health tab provides a summary of your system resource usage and node information, with filters that allow you to view resource usage within the ranges you specify.
Note
Note: Adjusting the filters on the System Health tab does not affect any database or MC settings.
-
The Memory Usage filter displays the number of nodes with high and low memory usage. Move the sliders to adjust the memory usage range filter.
For example, if you specify a range of 25% to 75% memory usage, the filter displays how many nodes are using less than 25% of memory (Low) and how many are using more than 75% (High). Hover your cursor over the Low and High values to see lists of what nodes fall, respectively, below or above the memory usage range you specified.
Click a node value to go to the Manage page, which displays the Memory Utilization KPI View.
-
The Spread Retransmission Rate filter displays the number of nodes with high spread retransmission rates. When a node's retransmission rate is too high, it is not communicating properly with other nodes. Move the slider to adjust the retransmission rate filter.
Hover your cursor over the Nodes value to see a list of what nodes exceeded the spread retransmission rate you specified. Click the node value to view spread retransmit rate alerts in the Message Center.
-
The CPU Usage chart displays the number of nodes with high and low CPU usage. Move the sliders to adjust the CPU usage range filter. Hover your cursor over the Low and High values to see lists of what nodes are below or above range you specified.
Click a node value to go to the Manage page, which displays the CPU Utilization KPI View.
-
The Reboot Rate filter displays the number of times nodes in the cluster have rebooted within the specified time frame. Use this filter to discover if nodes have gone down recently, or if there have been an unusual number of reboots. Move the slider to adjust the number of days. Hover over the Times value to see a list of the nodes that have rebooted and the times at which they did so.
-
The Disk Space Usage filter displays the number of nodes with high disk space usage. Move the slider to adjust the disk usage filter. Hover your cursor over the Nodes value to see a list of what nodes exceed the acceptable range.
Click the nodes value to go to the Manage page, which displays the Storage Used KPI View.
-
The Cluster Clock Skew Rate module displays the number of nodes that exceed a clock skew threshold. Nodes in a cluster whose clocks are not in sync can interfere with time-related database functions, the accuracy of database queries, and Management Console's monitoring of cluster activity.
Query synopsis
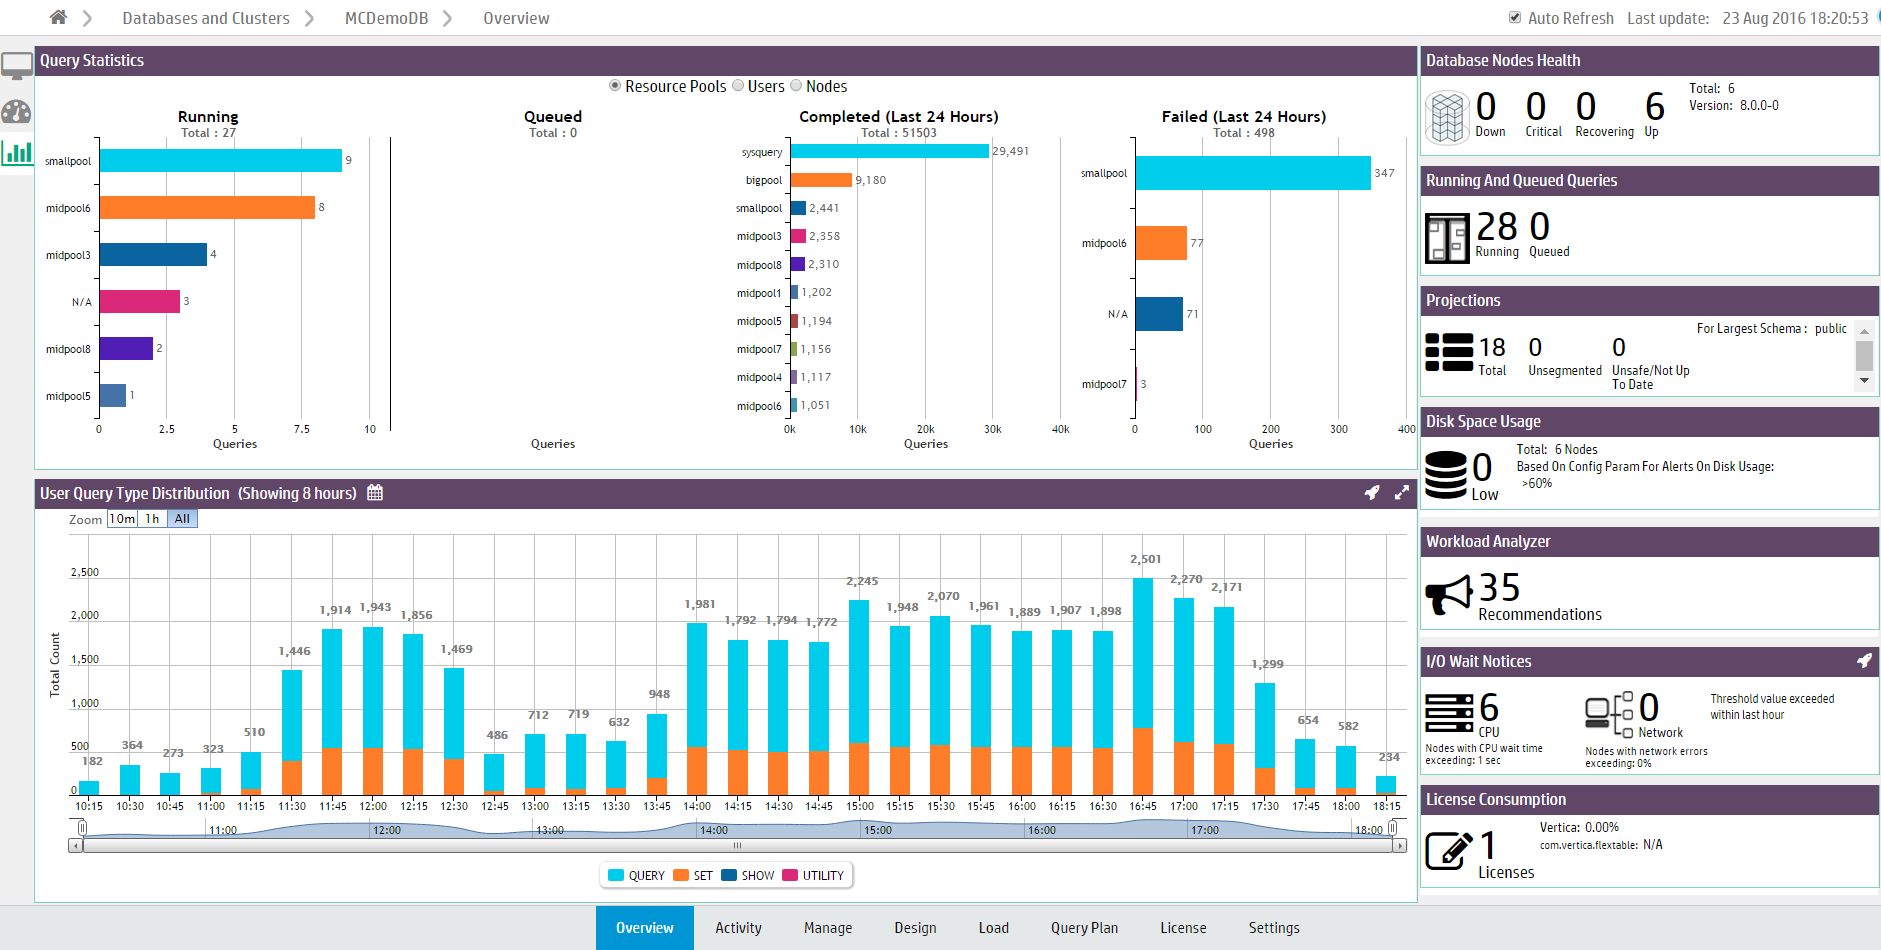
The Query Synopsis page provides two modules that report system query activity and resource pool usage:
-
The Query Statistics module displays four bar charts that provide an overview of running, queued queries, failed, and completed queries in the past 24 hours.
-
Select one of the options at the top of the module to group the queries by Resource Pools, Users, Nodes, or Subclusters.
-
Click a bar on the chart to view details about those queries the Query Monitoring activity chart.
-
The User Query Type Distribution chart provides an overview of user and system query activity. The chart reports the types of operations that ran. The default is to display the types of operations that ran on all nodes in the database. Use the dropdown in the title bar to display the types of operations that ran on the nodes in a specific subcluster, or on the nodes not assigned to a subcluster.
-
Hover your cursor over chart points for more details.
-
Select a type of operation from the legend to remove or add it from the chart display.
-
To zoom to a certain time frame, you can adjust the sliders at the bottom of the chart.
-
Click a bar in the graph to open the Queries chart.
8.2 - Monitoring same-name databases with MC
If you are monitoring two databases with identical names on different clusters, you can determine which database is associated with which cluster by clicking the database icon on MC's Databases and Clusters page to view its dialog box.
If you are monitoring two databases with identical names on different clusters, you can determine which database is associated with which cluster by clicking the database icon on MC's Databases and Clusters page to view its dialog box. Information in the dialog displays the cluster on which the selected database is associated.
8.3 - Monitoring cluster nodes with MC
For a visual overview of all cluster nodes, click the running database on the Databases and Clusters page and click the Manage tab at the bottom of the page to open the cluster status page.
For a visual overview of all cluster nodes, click the running database on the Databases and Clusters page and click the Manage tab at the bottom of the page to open the cluster status page.
The cluster status page displays the nodes in your cluster.
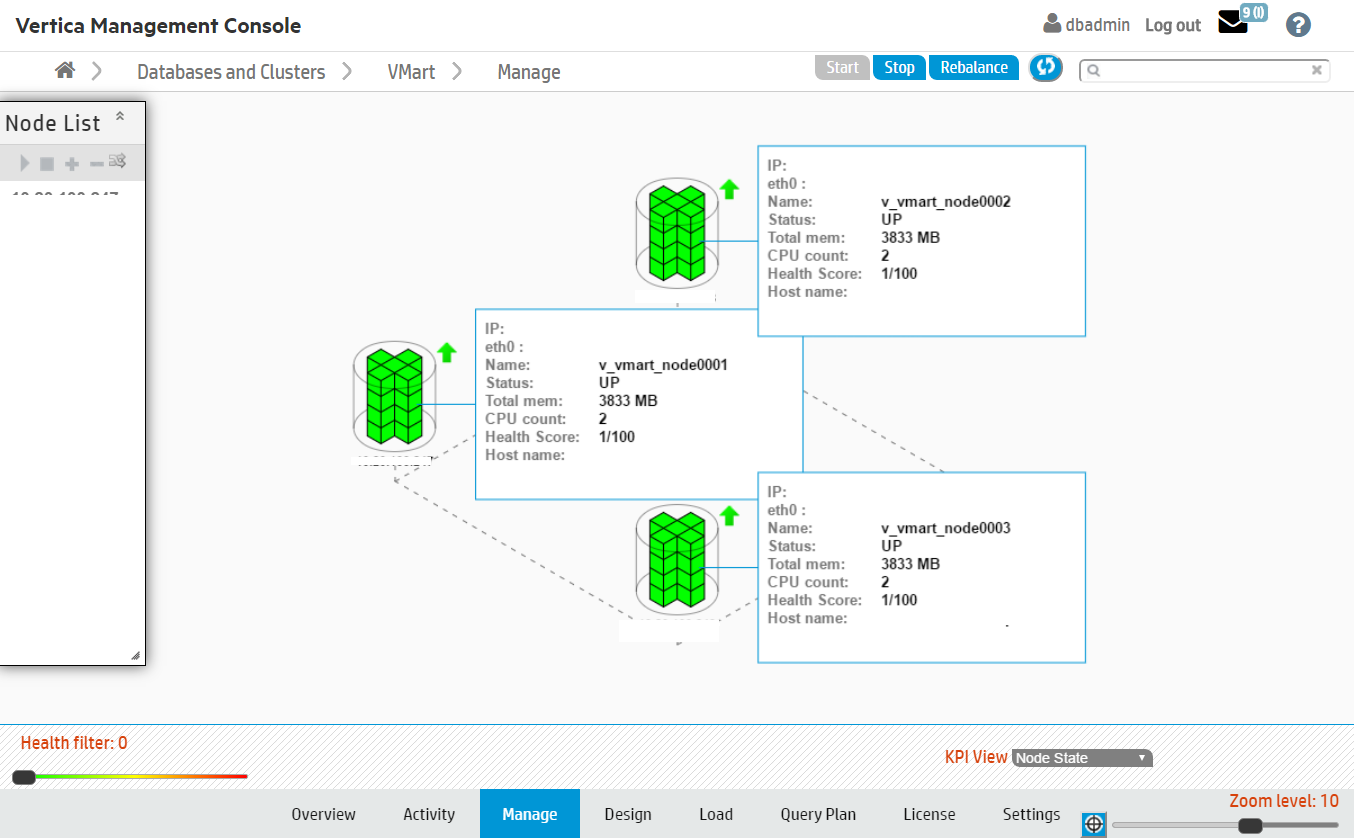
The appearance of the nodes indicate the following states:
-
Healthy: The nodes appear green.
-
Up: A small arrow to the right of the node points upward.
-
Critical: The node appears yellow and displays a warning icon to the right.
-
Down: The node appears red. To the right of the node, a red arrow points downwards.
-
Unplugged: An orange outlet and plug icon appears to the right. This is displayed when the MC cannot communicate with the agent running on the node.
You can get information about a particular node by clicking it, an action that opens the node details page.
Filtering what you see
If you have a large cluster, where it might be difficult to view dozens to hundreds of nodes on the MC interface, you can filter what you see. The Zoom filter shows more or less detail on the cluster overall, and the Health Filter lets you view specific node activity; for example, you can slide the bar all the way to the right to show only nodes that are down. A message next to the health filter indicates how many nodes in the cluster are hidden from view.
On this page, you can perform the following actions on your database cluster:
-
Add, remove and replace nodes
-
Rebalance data across all nodes
-
Stop or start (or restart) the database
-
Refresh the view from information MC gathers from the production database
-
View key performance indicators (KPI) on node state, CPU, memory, and storage utilization (see Monitoring cluster performance with MC for details)
Note
Starting, stopping, adding, and dropping nodes and rebalancing data across nodes works with the same functionality and restrictions as those same tasks performed through the
Administration tools.
If you don't see what you expect
If the cluster grid does not accurately reflect the current state of the database (for example if the MC interface shows a node in INITIALIZING state, but when you use the Administration Tools to View Database Cluster State, you see that all nodes are UP), click the Refresh button in the toolbar. Doing so forces MC to immediately synchronize with the agents and update MC with new data.
Don't press the F5 key, which redisplays the page using data from MC and ignores data from the agent. It can take several seconds for MC to enable all database action buttons.
8.4 - Monitoring node activity with MC
If a node fails on an MC-managed cluster or you notice one node is using higher resources than other cluster nodes—which you might observe when monitoring the Overview page—open the Manage page and click the node you want to investigate.
If a node fails on an MC-managed cluster or you notice one node is using higher resources than other cluster nodes—which you might observe when monitoring the Overview page—open the Manage page and click the node you want to investigate.
The Node Details page opens and provides summary information for the node (state, name, total memory, and so on), as well as resources the selected node has been consuming for the last three hours, such as average CPU, memory, disk I/O percent usage, network consumption in kilobytes, and the percentage of disk storage the running queries have been using. You can also browse and export log-level data from AgentTools and Vertica log files. MC retains a maximum of 2000 log records.
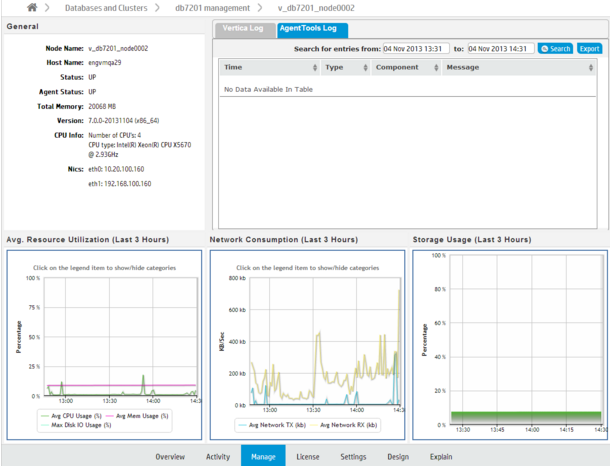
For a more detailed view of node activity, use the mouse to drag-select around a problem area in one of the graphs, such as the large spike in network traffic in the above image. Then hover over the high data point for a summary.
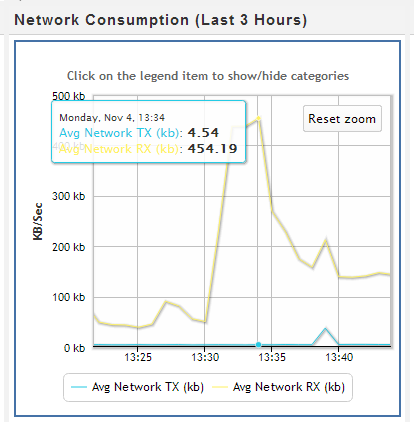
See also
8.5 - Monitoring cluster performance with MC
Key Performance Indicators (KPIs) are a type of performance measurement that let you quickly view the health of your database cluster through MC's Manage page.
Key Performance Indicators (KPIs) are a type of performance measurement that let you quickly view the health of your database cluster through MC's Manage page. These metrics, which determine a node's color, make it easy for you to quickly identify problem nodes.
Metrics on the database are computed and averaged over the latest 30 seconds of activity and dynamically updated on the cluster grid.
How to get metrics on your cluster
To view metrics for a particular state, click the menu next to the KPI View label at the bottom of the Manage page, and select a state.
MC reports KPI scores for:
-
Node state—(default view) shows node status (up, down, k-safety critical) by color; you can filter which nodes appear on the page by sliding the health filter from left to right
-
CPU Utilization—average CPU utilization
-
Memory Utilization—average percent RAM used
-
Storage Utilization—average percent storage used
After you make a selection, there is a brief delay while MC transmits information back to the requesting client. You can also click Sync in the toolbar to force synchronization between MC and the client.
Node colors and what they mean
Nodes in the database cluster appear in color. Green is the most healthy and red is the least healthy, with varying color values in between.
Each node has an attached information dialog box that summarizes its score. It is the score's position within a range of 0 (healthiest) to 100 (least healthy) that determines the node's color bias. Color bias means that, depending on the value of the health score, the final color could be slightly biased; for example, a node with score 0 will be more green than than a node with a score of 32, which is still within the green range but influenced by the next base color, which is yellow. Similarly, a node with a score of 80 appears as a dull shade of red, because it is influenced by orange.
MC computes scores for each node's color bias as follows:
-
0-33: green and shades of green
-
34-66: yellow and shades of yellow
-
67-100: red and shades of red shades
If the unhealthy node were to consume additional resources, its color would change from a dull orange-red to a brighter red.
Filtering nodes from the view
The health filter is the slider in the lower left area of page. You can slide it left to right to show or hide nodes; for example, you might want to hide nodes with a score smaller that a certain value so the UI displays only the unhealthy nodes that require immediate attention. Wherever you land on the health filter, an informational message appears to the right of the filter, indicating how many nodes are hidden from view.

Filtering is useful if you have many nodes and want to see only the ones that need attention, so you can quickly resolve issues on them.
8.6 - Monitoring cluster CPU and Memory with MC
On the MC Overview page, the CPU/Memory subsection provides a graph-based overview of cluster resources during the last hour, which lets you quickly monitor resource distribution across nodes.
On the MC Overview page, the CPU/Memory subsection provides a graph-based overview of cluster resources during the last hour, which lets you quickly monitor resource distribution across nodes.
This chart plots average and per-node percentages for both CPU and memory with updates every minute—unless you clear Auto Refresh Charts in the toolbar. You can also filter what the chart displays by clicking components in the legend at the bottom of the subsection to show/hide those components. Yellow data points represent individual nodes in the cluster at that point in time.
Investigating areas of concern
While viewing cluster resources, you might wonder why resources among nodes become skewed. To zoom in, use your mouse to drag around the problem area surrounding the time block of interest.
After you release the mouse, the chart refreshes to display a more detailed view of the selected area. If you hover your cursor over the node that looks like it's consuming the most resources, a dialog box summarizes that node's percent usage.
For more information, click a data point (node) on the graph to open MC's node details page. To return to the previous view, click Reset zoom.
See also
8.7 - Monitoring database storage with MC
The Infrastructure page's Storage View provides a summary of the amount of data stored in your database, and the persistent location of that data.
The Infrastructure page's Storage View provides a summary of the amount of data stored in your database, and the persistent location of that data. Use this view to monitor how much of your storage capacity your databases are using.
For a database running in Eon Mode, MC also displays bar charts in the Storage View that illustrate shard subscription status. Use these charts to determine if your current subscription layout is optimal for querying your Eon Mode database. For information about using subscription status charts, see Monitoring subscription status in Eon Mode.

Monitor storage usage
The storage summary table lists all databases currently monitored by MC and information about their storage:
-
Database Size. Click Load Size to calculate the total size of the database.
-
Database Mode. Vertica databases run in Enterprise Mode, or Eon Mode.
-
Storage Type. Enterprise Mode databases list the OS of the local nodes where data is stored. Eon Mode databases list the type of communal storage location where it stores its data. Eon Mode currently supports only S3-compatible storage locations.
-
View. The options displayed in this column depend on the database mode and type of data on the database.
-
Vertica Tables Storage: For Enterprise Mode databases only. Click for a dialog listing the node and local directories where Vertica table data is stored.
-
Communal/Depot Storage: For Eon Mode databases only. Click for a dialog displaying location paths for your depot and communal storage.
-
Communal Storage Subscription: For Eon Mode databases only. Click to view bar charts at the bottom of the Storage View page, illustrating shard subscription status. For more about these charts, Monitoring subscription status in Eon Mode.
-
External Tables: Available when there are external tables in your database. Click for a dialog displaying details about all external tables. (Also see Monitoring table utilization and projections with MC.)
-
HCatalog Details: Available when your Vertica database has access to Hive tables. (See Using the HCatalog Connector.) Click for a dialog displaying details about HCatalog schemas. For any HCatalog schema, click View Tables for details about all tables accessible through that schema. (Also see Monitoring table utilization and projections with MC.)
In front of Eon Mode database names in the list, a plus icon displays. Click the icon to expand more details about the database's depot capacity and usage. The depot is cache-like storage where Eon Mode databases keep local copies of communal storage data for faster query access.
See also
8.8 - Monitoring subscription status in Eon Mode
To view subscription charts for any Eon Mode database you monitor, click View Your Infrastructure on the MC Home page.
To view subscription charts for any Eon Mode database you monitor, click View Your Infrastructure on the MC Home page. Then click the Storage View tab.
Click the Details action for that database in the storage summary list (highlighted in red in the image below).
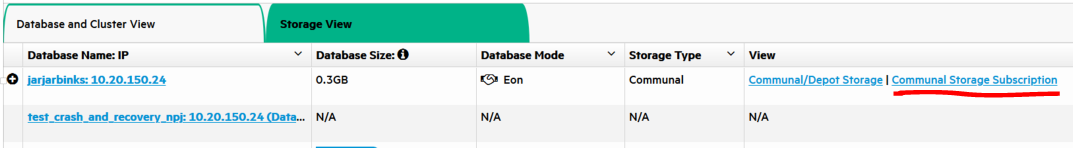
When you click Details, two charts become available on the bottom half of the page: The Sharding Subscription chart, and the Node Subscription chart. You can switch between these two charts using the drop down menu to the right of the chart title.
Why monitor shard and node subscriptions?
Shards are segments of the data that is stored persistently in your Eon Mode database's communal storage location, for example Amazon S3 in the cloud or PureStorage if your cluster is on premises. Each node in the database subscribes to a subset of those shards. In this way, the node gets updated on when to populate its depot with new data from communal storage. (See Shards and subscriptions.)
For K-safety in an Eon Mode database, shards should have multiple node subscribers to ensure that even if a node goes down or is being used by another query, the data on that shard is still available on other nodes. If a shard has no node subscribers, that could indicate that data loss is occurring.
Subscriptions go through several transitions, which are illustrated by colors in the subscription charts:
-
Pending (Yellow). The node is ready to subscribe to a certain shard. It cannot yet serve queries because it is not actively subscribed to the shard yet.
-
Passive (Blue/Teal). The node could potentially serve queries for a shard it is passively subscribed to, but its depot contents for that shard may not yet be up to date, which could negatively impact query performance. The passively subscribed node is waiting for an active node subscriber of the shard to send it the most recent data.
-
Active (Green). The node is actively subscribed to the shard, can load new data from communal storage, and can serve queries for data in that shard. The actively subscribed node sends data from that shard to other subscribed nodes.
-
Removing (Dark Red/Maroon). The node is unsubscribing from the shard. It may have the most recent data from that shard, but that state is temporary until data from that shard is cleaned up.
-
Inactive (Red). The subscribed node is down. It can no longer serve queries for that shard.
Operations such as adding or removing nodes or rebalancing shards can change which nodes subscribe to which shards. Shard subscription changes can prevent object-level restore from backups, though full restore is always possible. If shard subscriptions change, consider making a backup with the new configuration.
Monitor sharding subscription
The Sharding Subscription chart displays how many nodes are subscribed to each shard in your database, and what type of subscription it is.
You can hover over any bar in the chart to see which nodes are subscribed to the shard. Click on a subscription type in the legend to show or hide it in the chart display.
The example below shows the shard subscription status for a running Eon Mode database. The database has three nodes that are up, and one node (Node 4) that has been added to the cluster, but is down.
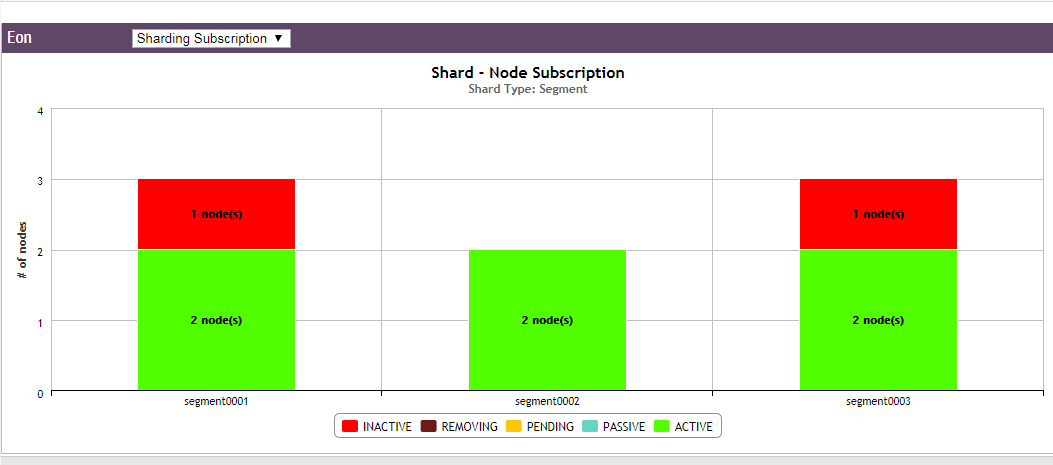
You can hover over any bar in the chart to see which nodes are subscribed to the shard. In this example, nodes 1 and 3 have active subscriptions to the first shard (green); nodes 1 and 2 to the second shard; and nodes 2 and 3 to the third shard.
The active subscriptions are evenly spread across the shards. This is a k-safe Eon Mode database.
Node 4 was subscribed to two shards; however, because it is down, its subscriptions to the shards are now inactive (red).
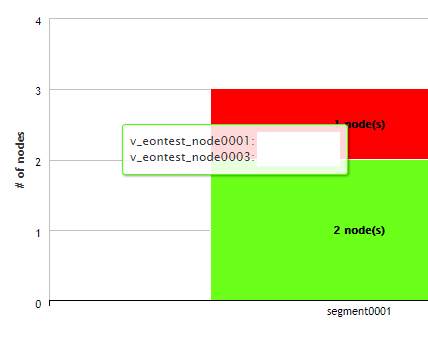
Monitor node subscriptions
Use this chart to view how many shards each node in your database is subscribed to, and the state of those subscriptions. The number of shards each node is subscribed to should be about the same to prevent overworking any given node.
Hover over any bar to see the shards it is subscribed to. The color of the bar indicates the state of each subscription. Click on a subscription type in the legend to show or hide it in the chart display.
The example below shows the same database from the Sharding Subscription example above. Nodes 1 through 3 are each actively subscribed to two shards (green). At least two nodes are subscribed to every shard in the database (which you can double check using the Sharding Subscription chart), ensuring that even if one of the nodes is down or being used in a query, another node is still actively subscribed and can access the data of that shard.
Since Node 4 is down, the chart shows that both its shard subscriptions are now inactive.
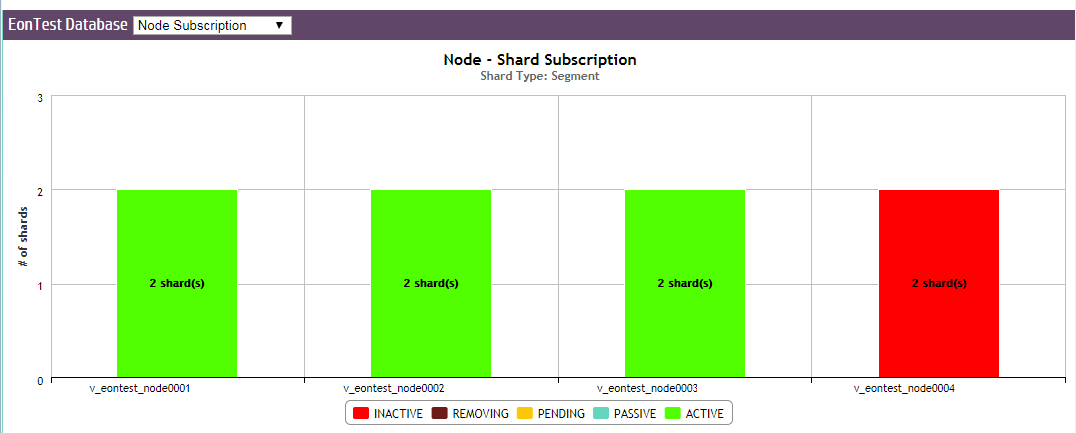
See also
8.9 - Monitoring system resources with MC
can be turned off by setting advanced.charts=false in the console.properties file, but don't document this.
MC's Activity page provides immediate visual insight into potential problem areas in your database's health by giving you graph-based views of query and user activity, hardware and memory impact, table and projection usage, system bottlenecks, and resource pool usage.
Select one of the following charts in the toolbar menu:
System-level activity charts automatically update every five minutes, unless you clear Auto Refresh in the toolbar. Depending on your system, it could take several moments for the charts to display when you first access the page or change the kind of resource you want to view.
Chart viewing options
You can specify time frames for some charts, which display a calendar icon in their title bars. Click the calendar icon to specify the time frame for that module.
If you have enabled extended monitoring on your database, MC can display longer ranges of data in certain charts. See Extended monitoring. If a chart is using extended monitoring data, the rocket ship icon appears in the title bar:
You can expand some charts to view them in larger windows. Click the expand icon in the title bar to do so:
8.9.1 - Monitoring query activity with MC
The Queries chart displays information about query concurrency and average resource usage for CPU/memory, network activity, and disk I/O percent based on maximum rated bandwidth.
The Queries chart displays information about query concurrency and average resource usage for CPU/memory, network activity, and disk I/O percent based on maximum rated bandwidth.
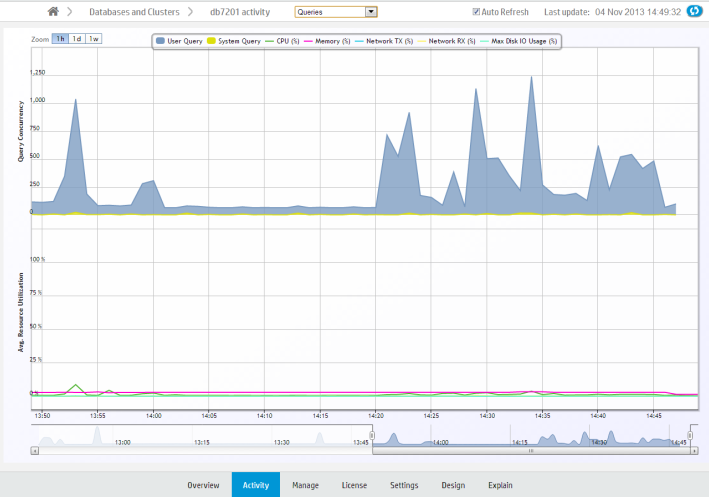
Hover over a data point for more information about percent usage for each of the resource types.
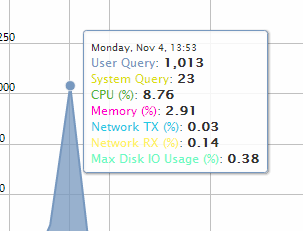
If you click a data point, MC opens a details page for that point in time, summarizing the number of user queries and system queries. This page can help you identify long-running queries, along with the query type. You can sort table columns and export the report to a file.
Monitoring key events
On the main Queries page, MC reports when a key event occurred, such as a Workload Analyzer or rebalance operation, by posting a Workload Analyzer (Workload Analyzer) and/or RBL (rebalance) label on the resource section of the chart.
Filtering chart results
The default query concurrency is over the last hour. The chart automatically refreshes every five minutes, unless you clear the Auto Refresh option in the toolbar. You can filter results for 1 hour, 1 day, or up to 1 week, along with corresponding average resource usage. You can also click different resources in the legend to show or hide those resources.
To return to the main Queries page, use the slider bar or click the 1h button.
Viewing more detail
To zoom in for detail, click-drag the mouse around a section or use the sliding selector bar at the bottom of the chart. After the detailed area displays, hover your cursor over a data point to view the resources anchored to that point in time.
For more detail about user or system queries, click a data point on one of the peaks. A Detail page opens to provide information about the queries in tabular format, including the query type, session ID, node name, query type, date, time, and the actual query that ran.
The bottom of the page indicates the number of queries it is showing on the current page, with Previous and Next buttons to navigate through the pages. You can sort the columns and export contents of the table to a file.
To return to the main Queries page, click <database name> Activity in the navigation bar.
8.9.2 - Monitoring internal sessions with MC
The Internal Sessions chart provides information about Vertica system activities, such as Tuple Mover and rebalance cluster operations, along with their corresponding resources, such as CPU/memory, networking, and disk I/O percent used.
The Internal Sessions chart provides information about Vertica system activities, such as Tuple Mover and rebalance cluster operations, along with their corresponding resources, such as CPU/memory, networking, and disk I/O percent used.
Hover your cursor over a bar for more information. A dialog box appears and provides details.
Filtering chart results
You can filter what the chart displays by selecting options for the following components. As you filter, the Records Requested number changes:
-
Category: Filter which internal session types (mergeout, rebalance cluster) appear in the graph. The number in parentheses indicates how many sessions are running on that operation.
-
Session duration: Lists time, in milliseconds, for all sessions that appear on the graph. The minimum/maximum values on which you can filter (0 ms to n ms) represent the minimum/maximum elapsed times within all sessions currently displayed on the graph. After you choose a value, the chart refreshes to show only the internal sessions that were greater than or equal to the value you select.
-
Records requested: Represents the total combined sessions for the Category and Session Duration filters.
8.9.3 - Monitoring user sessions with MC
The User Sessions charts provide information about Vertica user activities for all user connections open to MC.
The User Sessions charts provide information about Vertica user activities for all user connections open to MC.
Choose User Sessions from the menu at the top of your database's Activity page to view these charts.
View open sessions
The Open Sessions tab displays a table of currently open sessions for each user. You can close a session or cancel a query on this tab by selecting that option from the Actions column.
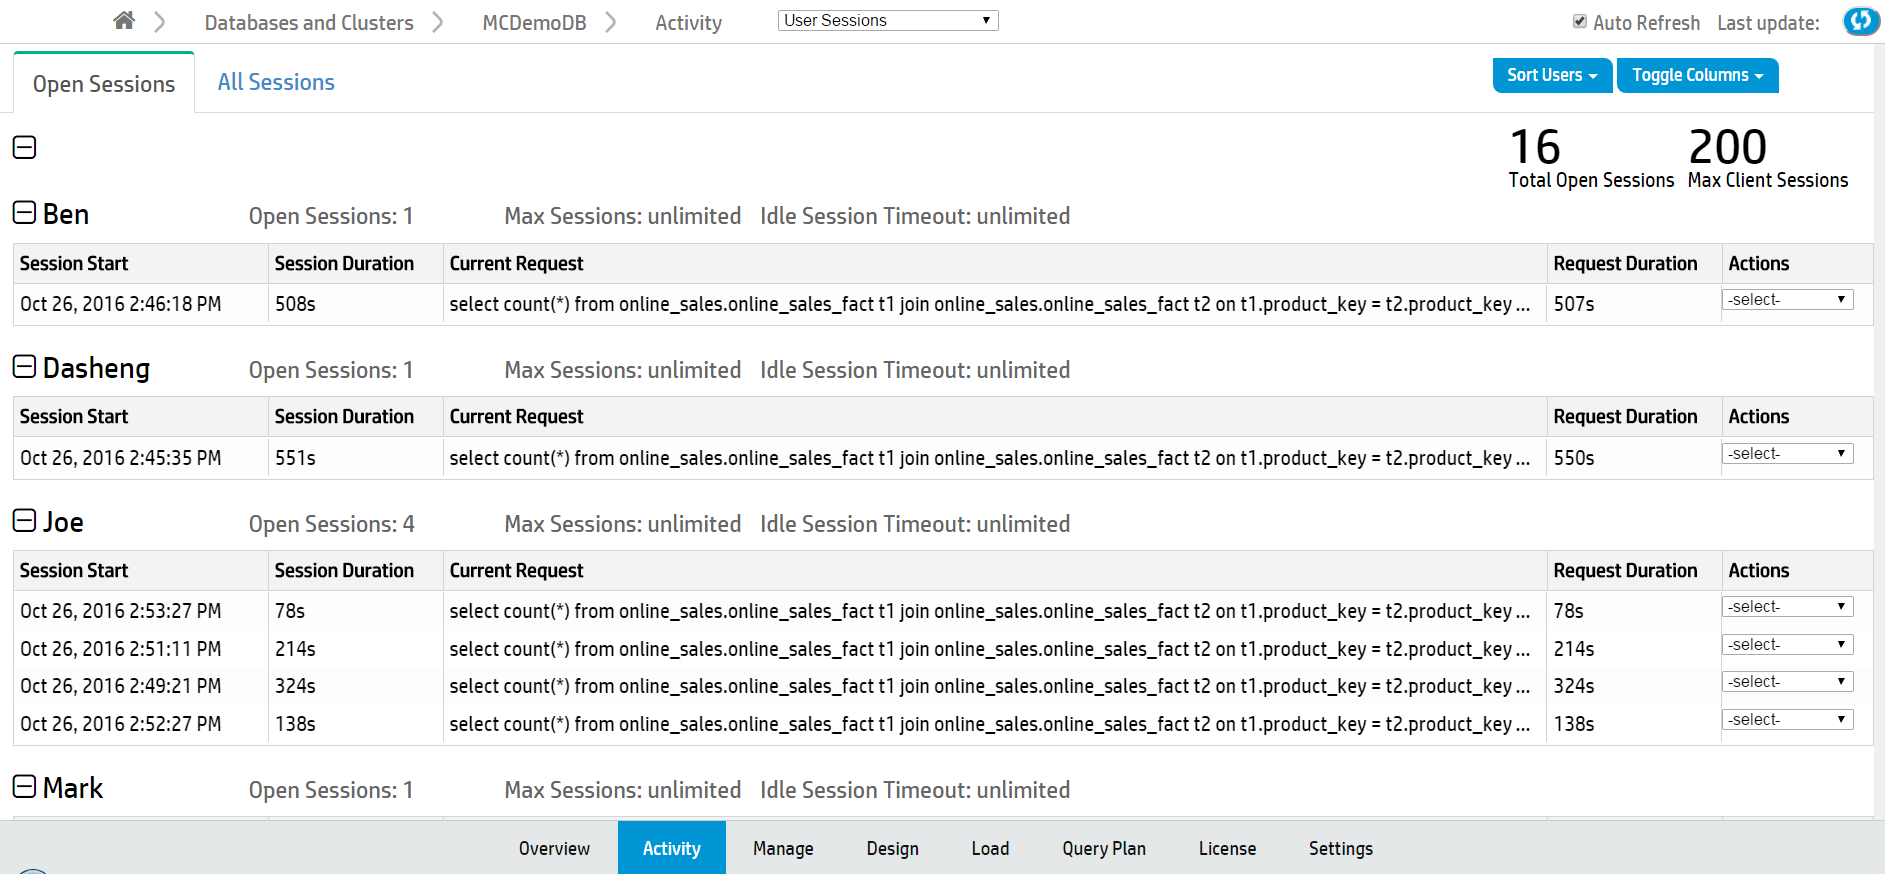
Click any row to open a Session Details dialog that shows more extensive information about that session.
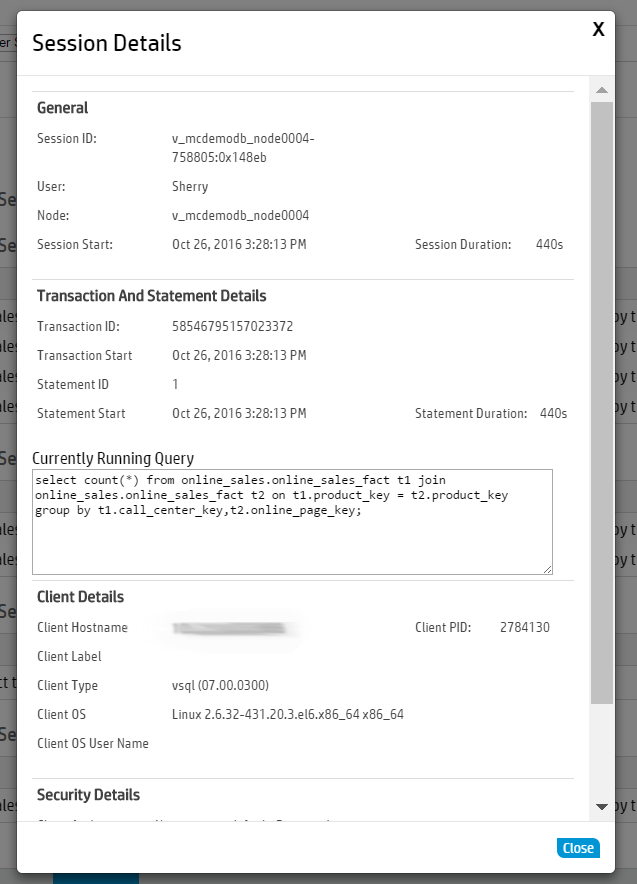
To configure the Open Sessions page display:
-
Use the Sort Users button at the top right of the page to sort by user name or number of open sessions.
-
Use the Toggle Columns button at the top right of the page to select which columns to display. Each table displays session information by column, such as the session start time or the
View all user sessions
The All Sessions tab displays a history of all user sessions in a swim lane chart.
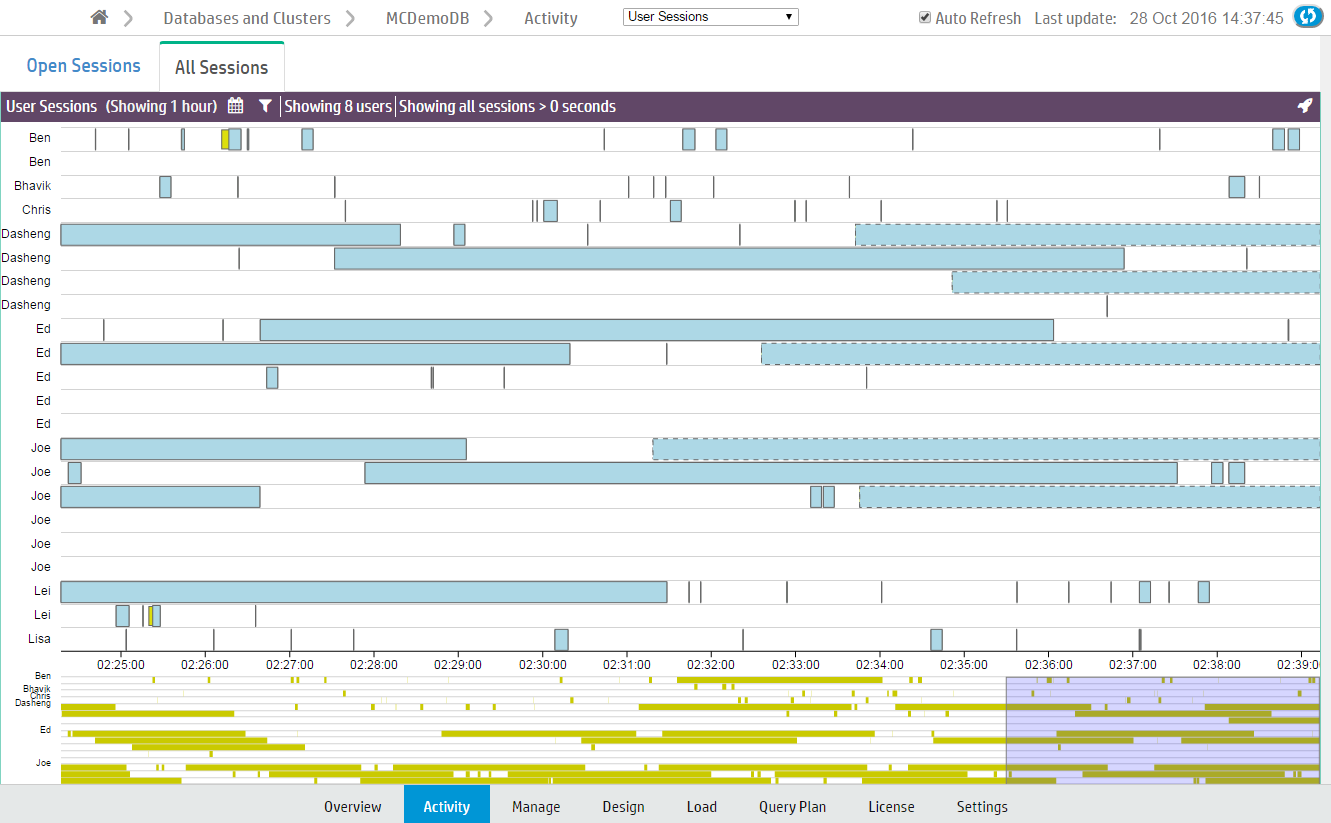
What chart colors mean
Bars outlined with a dotted line are currently running sessions.
Sessions are divided into two colors, yellow and blue.
-
Yellow bars represent user (system) sessions. If you click a yellow bar, MC opens a Detail page that shows all queries that ran or are still running within that session.
-
Blue bars represent user requests (transactions within the session). If you click a blue bar in the graph, MC opens a Detail page that includes information for that query request only.
When you hover your mouse over a transaction bar, a dialog box provides summary information about that request, such as which user ran the query, how long the transaction took to complete, or whether the transaction is still running.
Filter chart results
Extremely busy systems will show a lot of activity on the interface, perhaps more than you can interpret at a glance. You can filter chart results in several ways:
-
Zoom. The context chart at the bottom of the page highlights in blue which section of the All Sessions chart you are viewing. Click and drag the blue box left or right to view earlier or later user sessions. Click and drag the edges of the blue box to zoom in or out.
-
Select fewer users. Click the filter icon ( ) at the top of the page. A menu of a menu of all available users appears below. Deselect users to exclude from the chart.
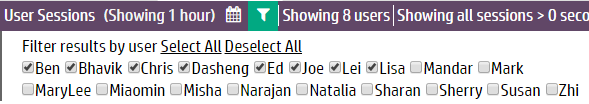
-
Change the session duration (how long a session took to run). Click the Filter icon () at the top of the page. The Filter sessions and queries by duration field appears below. Enter the minimum session length (in seconds) to display on the chart and click Update.
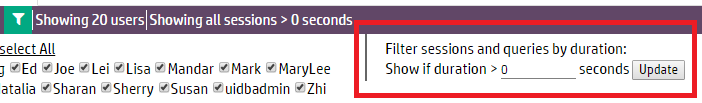
-
Specify a time frame. Click the Calendar icon ( ) at the top of the page to display the From and To fields. Using the fields, select the time frame to display in the chart and click Update.
8.9.4 - Monitoring system memory usage with MC
The Memory Usage chart shows how system memory is used on individual nodes over time.
The Memory Usage chart shows how system memory is used on individual nodes over time. Information the chart displays is stored based on Data collector retention policies, which a superuser can configure. See Configuring data retention policies.
The first time you access the Memory Usage chart, MC displays the first node in the cluster. MC remembers the node you last viewed and displays that node when you access the Activity page again. To choose a different node, select one from the Nodes drop-down list at the bottom of the chart. The chart automatically refreshes every five minutes unless you disable the Auto Refresh option.
Tip
On busy systems, the Node list might cover part of the graph you want to see. You can move the list out of the way by dragging it to another area on the page.
Types of system memory
The Memory Usage chart displays a stacking area for the following memory types:
-
swap
-
free
-
fcache (file cache)
-
buffer
-
other (memory in use by all other processes running on the system besides the main Vertica process, such as the MC process or agents)
-
Vertica
-
rcache (Vertica ROS cache)
-
catalog
When you hover over a data point, a dialog box displays percentage of memory used during that time period for the selected node.
8.9.5 - Monitoring system bottlenecks with MC
The System Bottlenecks chart helps you quickly locate performance bottlenecks on a particular node.
The System Bottlenecks chart helps you quickly locate performance bottlenecks on a particular node. The first time you access the Activity page, MC displays the first node in the cluster. To choose a different node, select one from the Nodes drop-down list at the bottom of the chart.
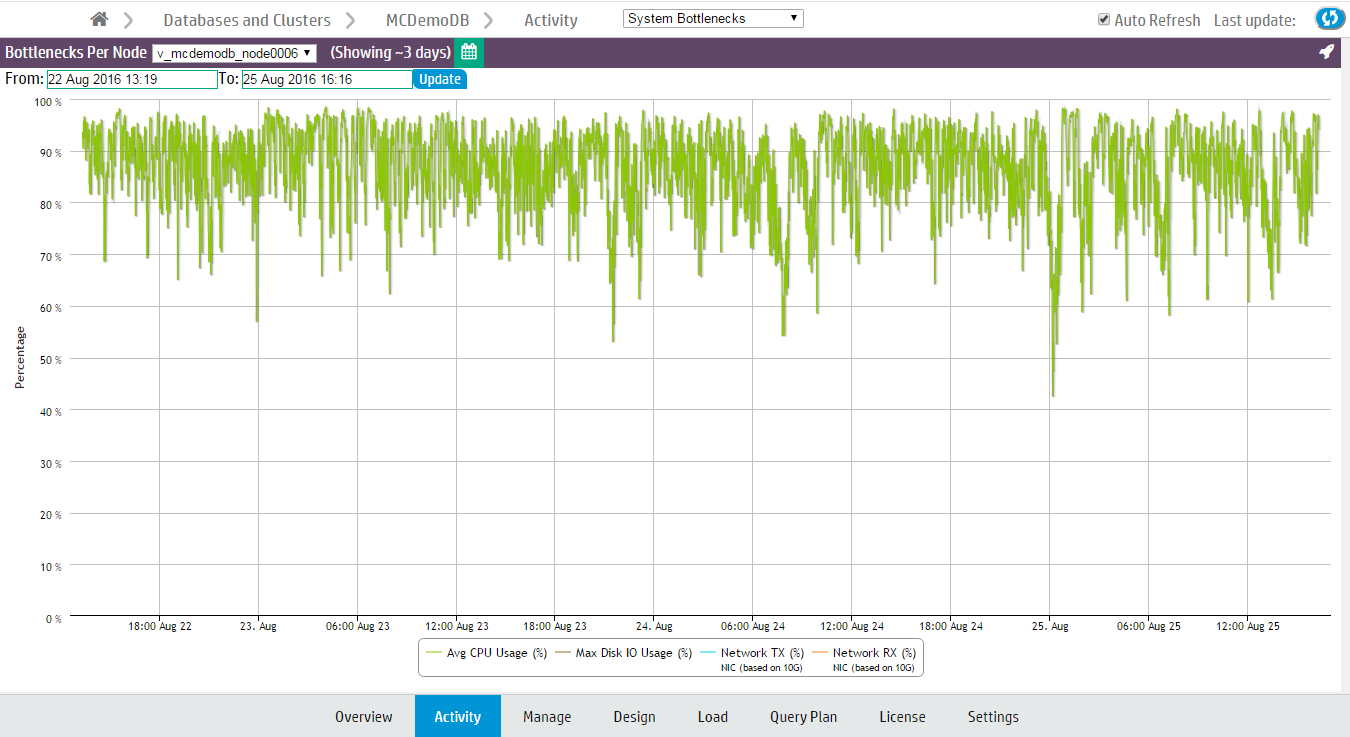
The System Bottlenecks chart reports what MC identifies as the most problematic resource during a given time interval. You can use this chart as a starting point for investigation.
How MC gathers system bottleneck data
Every 15 minutes, MC takes the maximum percent values from various system resources and plots a single line with a data point for the component that used the highest resources at that point in time. When a different component uses the highest resources, MC displays a new data point and changes the line color to make the change in resources obvious. Very busy databases can cause frequent changes in the top resources consumed, so you might notice heavy chart activity.
In the following example, at 08:24 the maximum resources used changed from Disk I/O to CPU. The System Bottlenecks charts denotes this with a change in line color from brown to green.
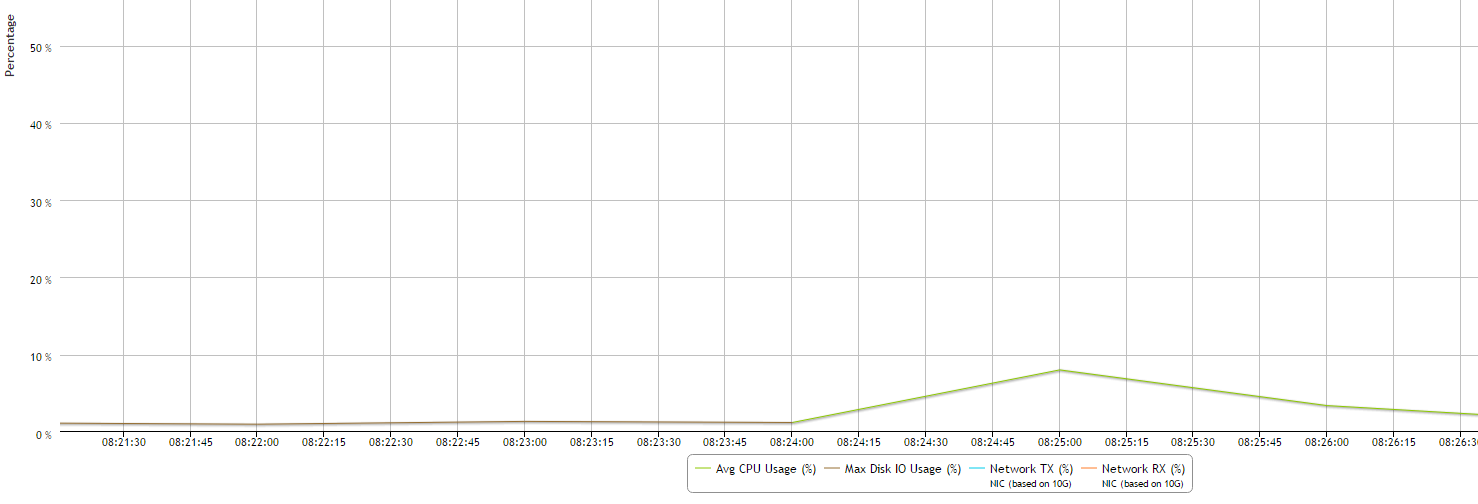
The components MC reports on
MC reports maximum percent values for the following system components:
-
Average percent CPU usage
-
Average percent memory usage
-
Maximum percent disk I/O usage
-
Percent data sent over the network (TX)
-
Percent data received over the network (RX)
How MC handles conflicts in resources
If MC encounters two metrics with the same maximum percent value, it displays one at random. If two metrics are very close in value, MC displays the higher of the two.
8.9.6 - Monitoring user query phases with MC
The User Query Phases chart provides information about the query execution phases that a query goes through before completion.
The User Query Phases chart provides information about the query execution phases that a query goes through before completion. Viewing this chart helps you identify at a glance queries possibly delayed because of resource contention.
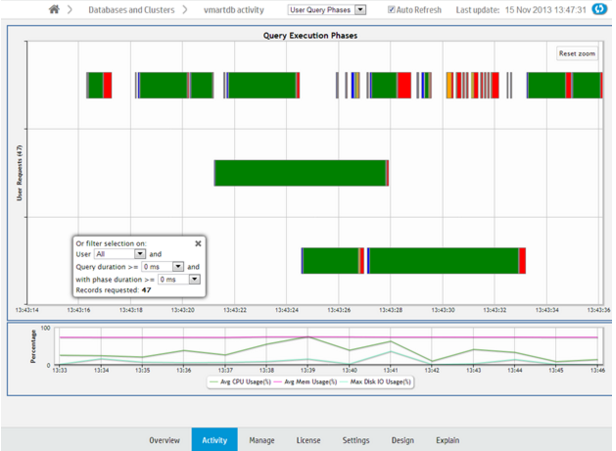
Each bar, bound by a gray box, represents an individual query. Within a query, a different color represents each query phase. The chart does not show phases for queries with durations of less than 4 seconds. Blank spaces within a query represent waiting times, as in the image below.
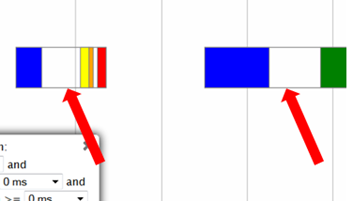
Hover over a phase in the query for information on the phase type and duration.
The chart shows queries run over the last 15 minutes. The chart automatically refreshes every five minutes, unless you clear the Auto Refresh option in the toolbar.
Filtering chart results
You can filter what the chart displays by selecting options for the user running the query, minimum query duration, and minimum phase duration.
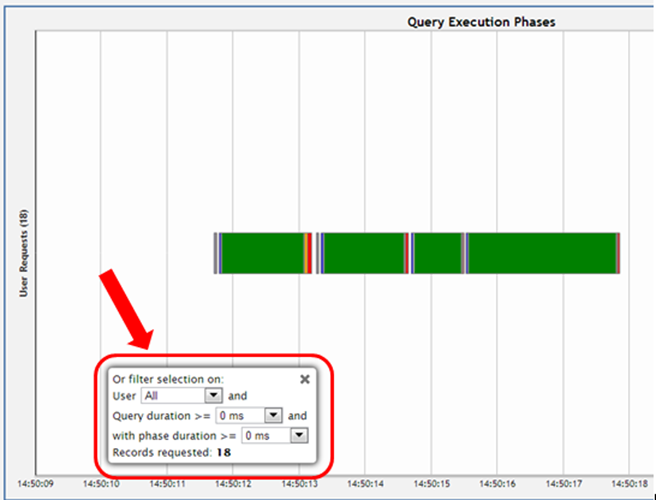
Viewing more detail
To zoom in for detail, click-drag the mouse around a section of the chart. Click Reset Zoom, located at the top right corner of the chart, to restore the chart to its original view.
For more detail, click a query bar. The Detail page opens to provide information about the queries in tabular format, including the query type, session ID, node name, query type, date, time, the actual query that ran, and an option to run Explain Plan or profile the query. Click a table column header to sort the queries by that category.
To export the contents of the table to a file, click Export, located at the upper right of the page.
To return to the main Queries page, click Activity in the navigation bar.
8.9.7 - Monitoring table utilization and projections with MC
The Table Utilization activity page helps you monitor tables and projections in your database by schema.
The Table Utilization activity page helps you monitor tables and projections in your database by schema.
Use the Table Utilization charts for a listing of all the tables in a schema, which you can filter and sort; or view them by size and usage in a treemap visualization. These charts allow you to identify outliers among your tables, such as those that are large or overused.
The Projections Summary, located on the right side of the page, provides an overview of the projections in the schema. You can use this summary to help identify if projections are evenly distributed across nodes.
Visualize tables
MC shows you the public schema by default. To specify which schema to view, choose one from the Schemas menu at the top of the activity page. The summary of tables and projections in that schema appear on the page.
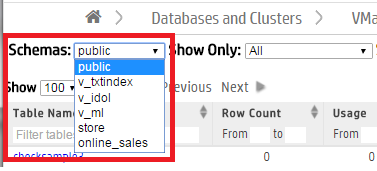
MC visualizes your available tables by schema in a table chart or as a treemap chart. From the Show As menu, choose Table for a tabular chart or Map for a treemap chart. By default, MC displays the Table chart.

Depending on the number of tables in the schema, the chart may be crowded. To narrow it down, use the Show Only filter at the top of the page to display only the largest 100 tables, smallest 100 tables, or external tables.
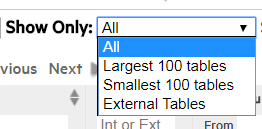
View the table chart
The Table chart is a tabular view of the schema's table data. Use the tabular view to filter or sort on any columns, and view the explicit values for row counts and utilization.
The columns display each table's:
-
Table Name. Click this name to see the Table Details page.
-
Table Type: Internal, Working with external data or HCatalog. (Details such as row count and usage are not available for external and HCatalog types.)
-
Row Count.
-
Usage in Queries, by percentage of time the table is queried.
-
Row count and Usage, visualized as a bar. The length of the bar indicates row count; a darker color indicates higher usage.
-
Table Definition. The COPY statement table definition, only applicable to external tables.
Hover over any row in the chart to view the table's properties (shown for inventory_fact in the screen capture below). Click the table name to view its more in-depth Table Details page.
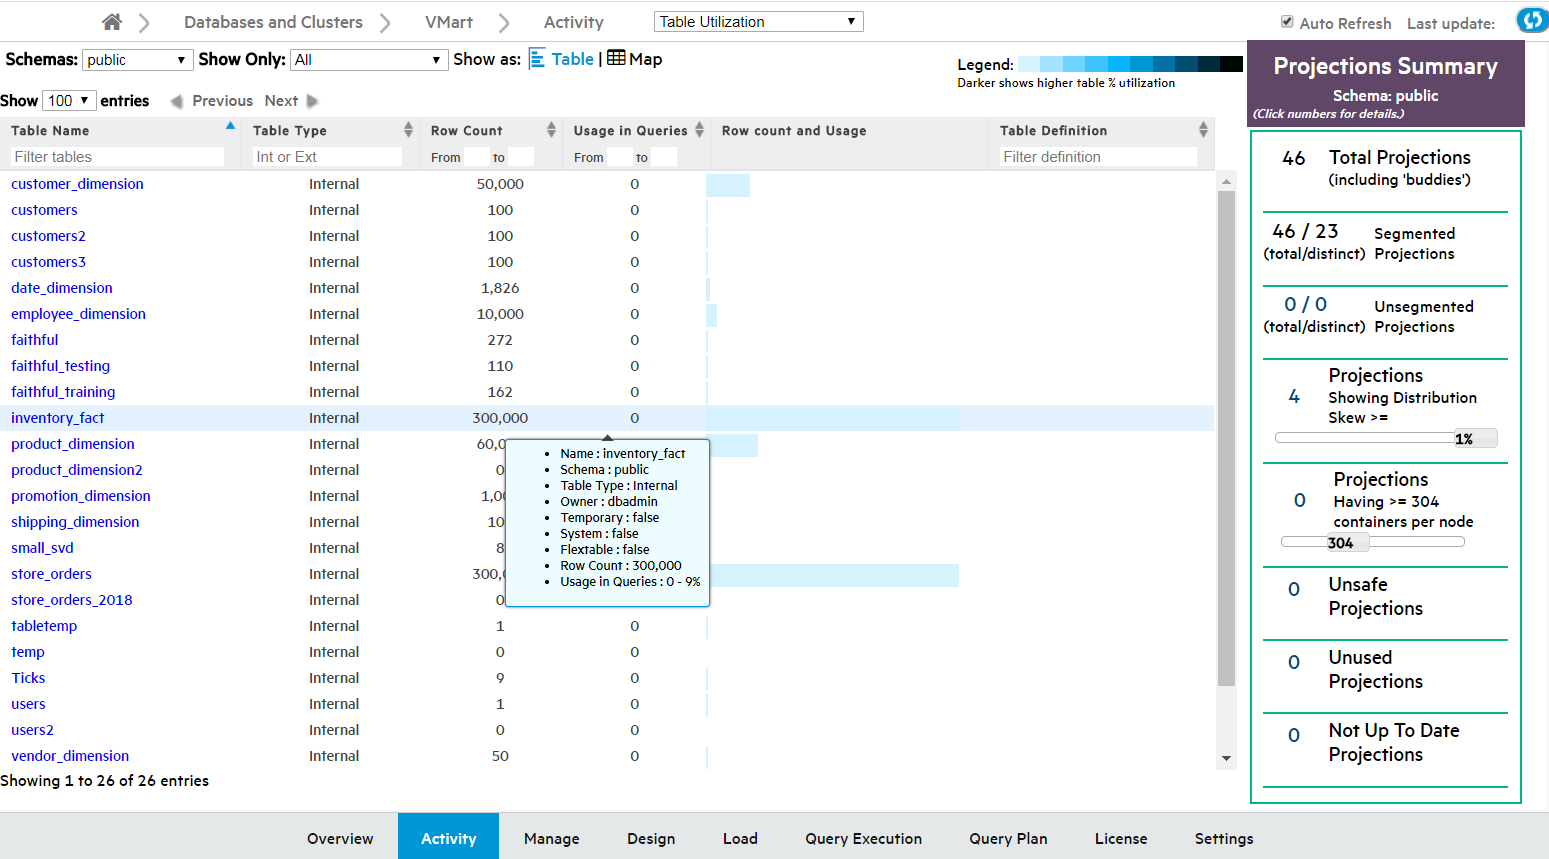
View the treemap chart
In the Treemap visualization, tables are represented by boxes, nested by size and colored by usage. Darker colors indicate higher table usage.
Hover over a table to view more details, or click to view its Table Details page.
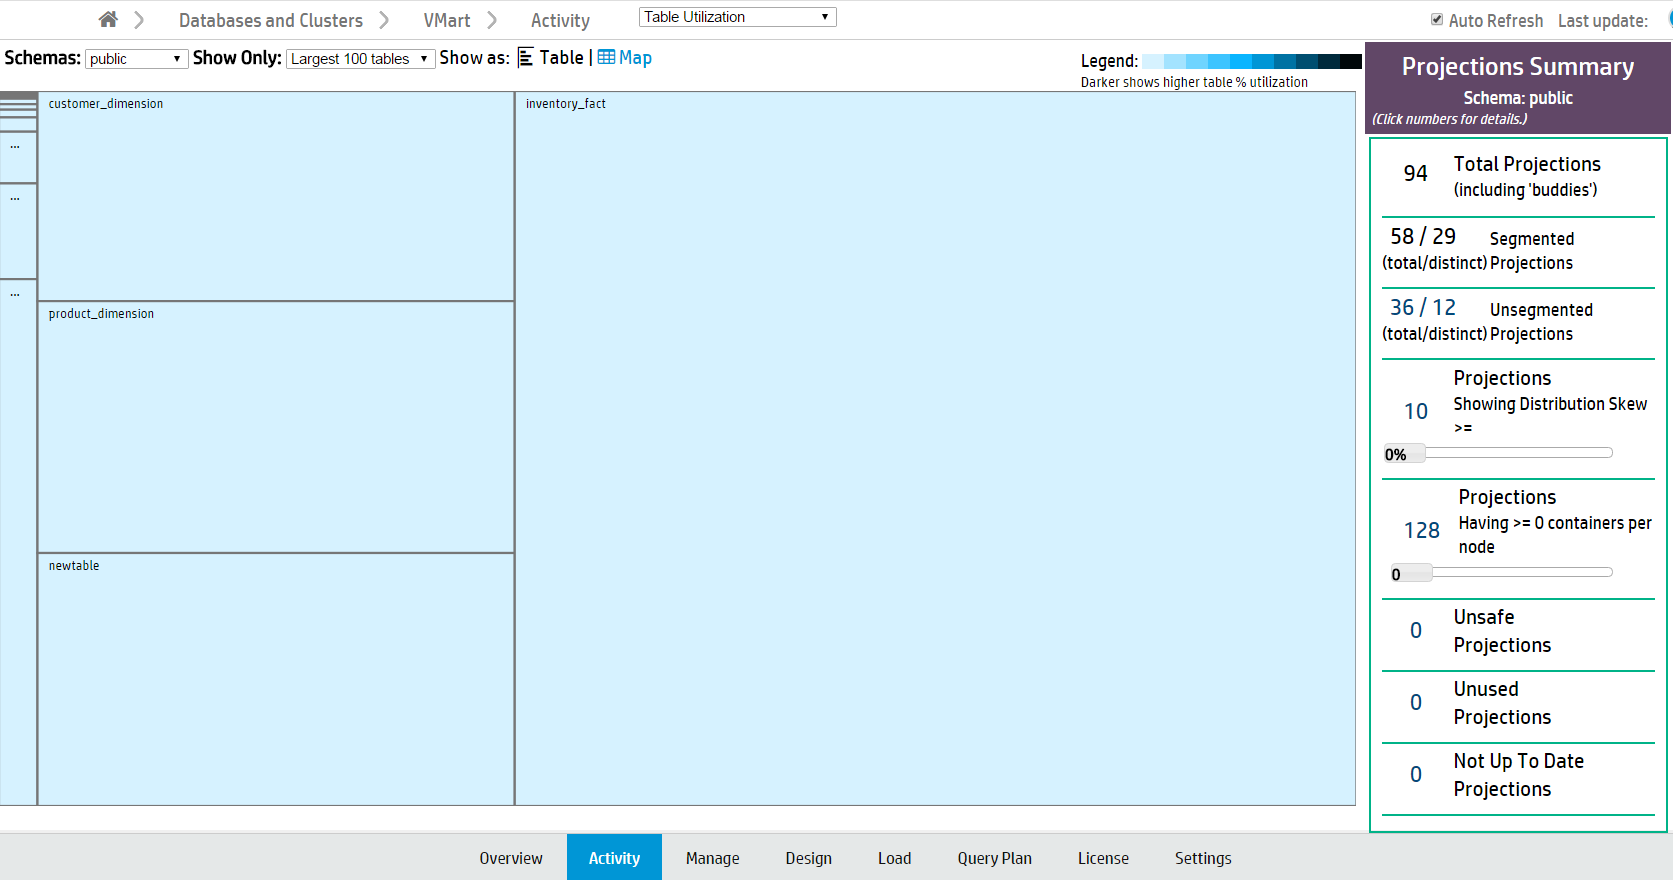
View table details
The Table Details page displays a detailed overview of internal Vertica tables. (This is not available for external and HCatalog tables.) Click a table name on the Table Utilization Activity page to open its Table Details page in a new window.
You can view the following details:
-
Table Properties. Table properties (such as row count and owner).
-
Projections. The properties of the table's columns and projections.
-
Storage by Node. The table's storage utilization per node, in MB.
-
# Deleted Rows by Node. Vertica allocates physical storage to deleted rows until they are purged by the Tuple Mover.
-
# Delete Vectors by Node. Vertica creates small containers called delete vectors when DELETE or UPDATE statements run on a table. A large number of delete vectors can adversely impact performance. (See Deletion marker mergeout.)
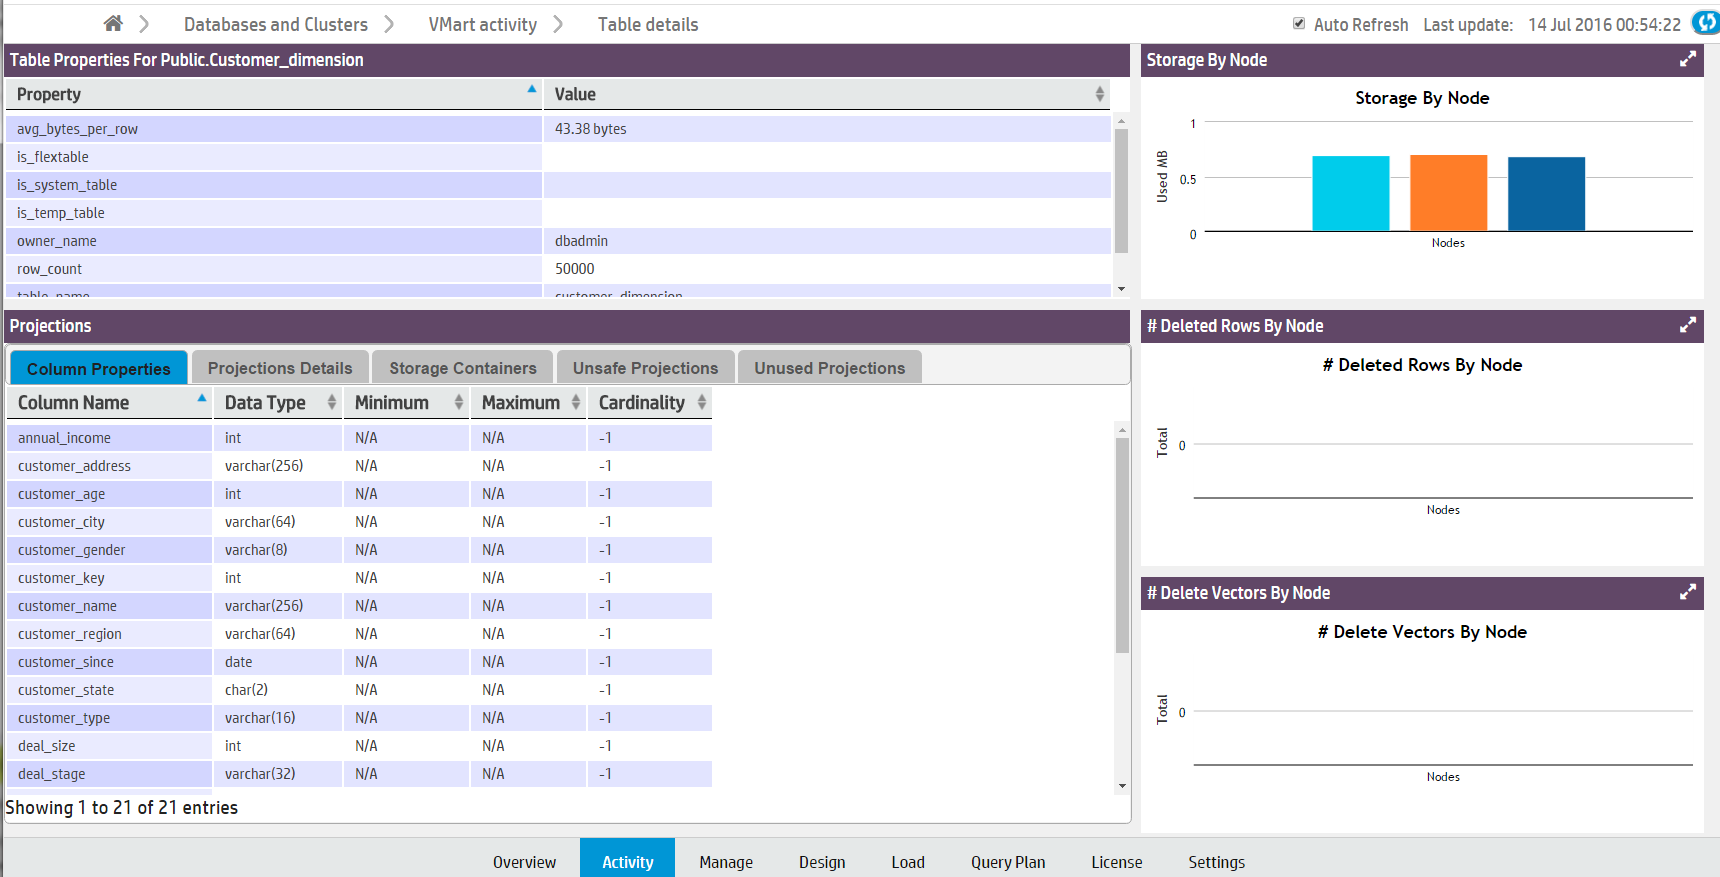
Note
Note: If you have deleted table rows recently, Management Console may not display the most recent row count. MC updates the row count when mergeout occurs. See
Mergeout.
Projections summary
The Projections Summary is located in a side bar on the right side of the Table Utilization page. It displays the following statistics of all projections in a schema:
-
Total projections.
-
Segmented projections, the number of projections segmented across multiple nodes.
-
Unsegmented projections, the number of projections that are not segmented across multiple nodes.
-
Projections Showing Distribution Skew, the number of projections unevenly distributed across nodes. Tables with fewer than 1000 rows are not counted. Move the slider to configure filter by distribution skew percentage.
-
Projections Having >= Containers Per Node. Move the slider to specify the minimum number of containers.
-
Unsafe Projections, the number of projections with a K-safety less than the database's K-safety.
-
Unused Projections.
-
Not Up to Date Projections.
Click a projections number to view a list of the specified projections and their properties. For more about projections, see Projections.
See also
8.9.8 - Monitoring running queries with MC
The Query Monitoring activity page displays the status of recent and currently running queries, and resource information by user and node.
The Query Monitoring activity page displays the status of recent and currently running queries, and resource information by user and node. For Eon Mode databases, you can also display the status of queries by subcluster. From this page, you can profile a query or cancel a running query.
Use this page to check the status of your queries, and to quickly cancel running or queued queries to free up system resources. This page can help you identify where resources are being used, and which queries, users, nodes, or subclusters are using the most resources.
The Query Monitoring page includes four tables, displayed as tabs:
-
Running queries
-
Queued queries
-
Completed queries
-
Failed queries
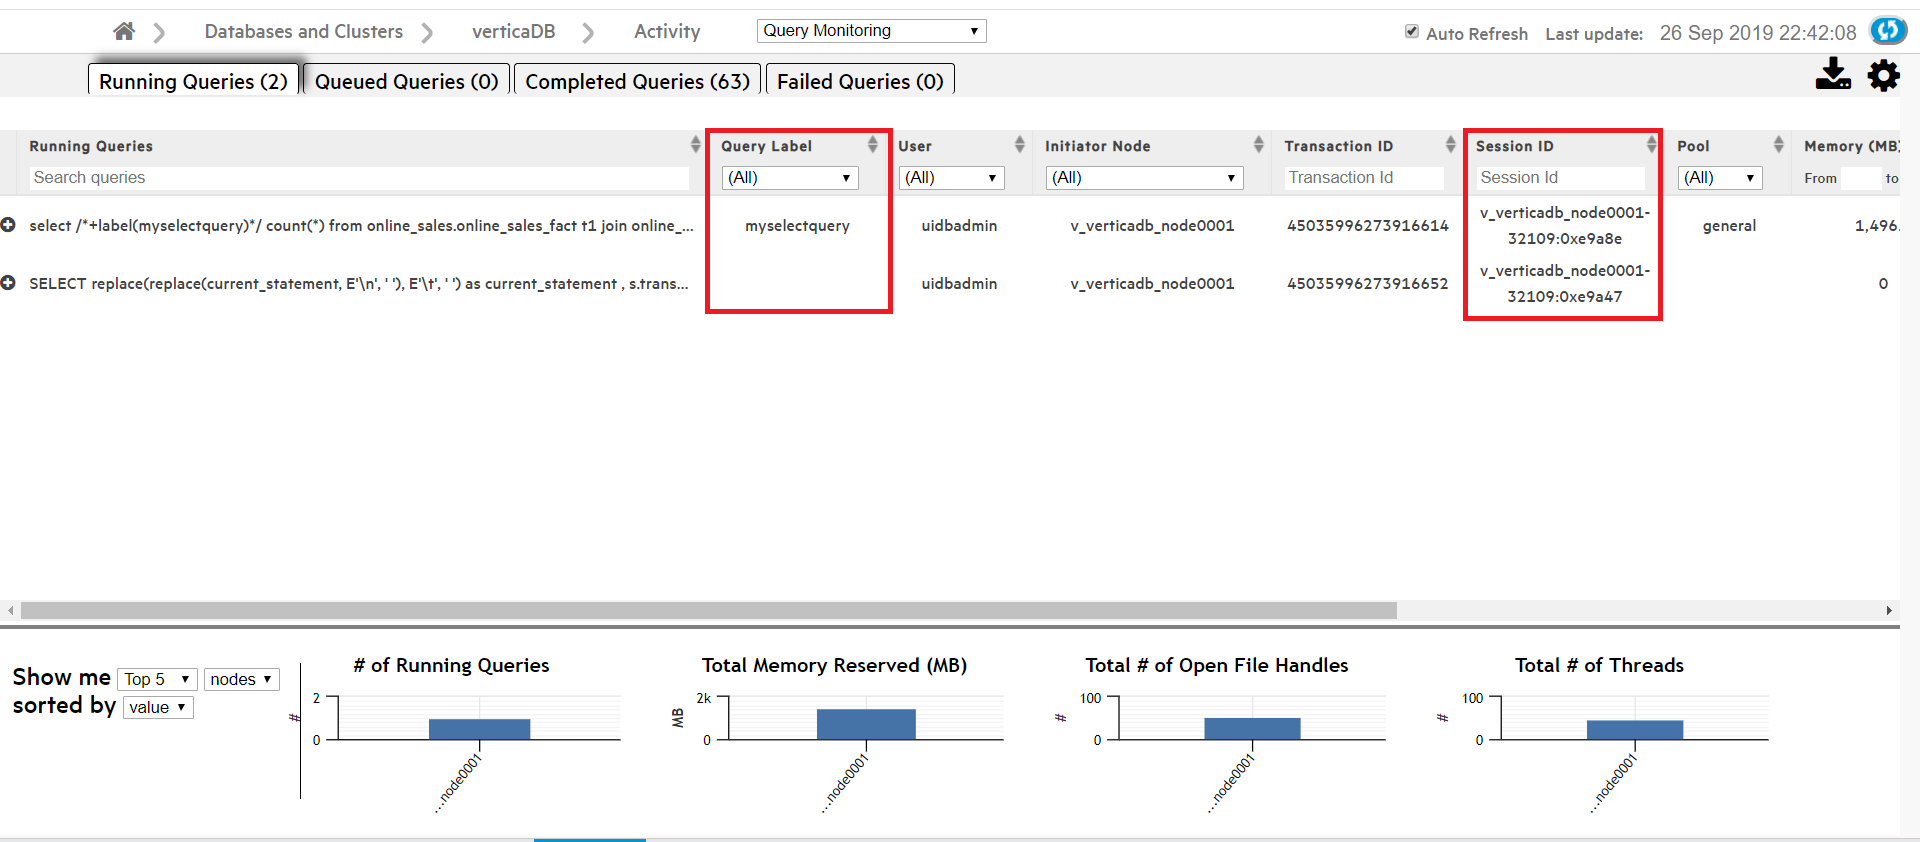
From the Actions column you can:
-
Cancel. Cancel a running or queued query.
-
Close session. Close a session for a running or queued query.
-
Explain. Open the Query Plan page for any query.
-
Profile. Profile any query on the Query Plan page.
The four bar charts at the bottom of the page display aggregate query usage by node or user. Hover over a bar with your cursor to see its value. When sorted by value, the left-most bar in each chart represents the node or user with the highest value.
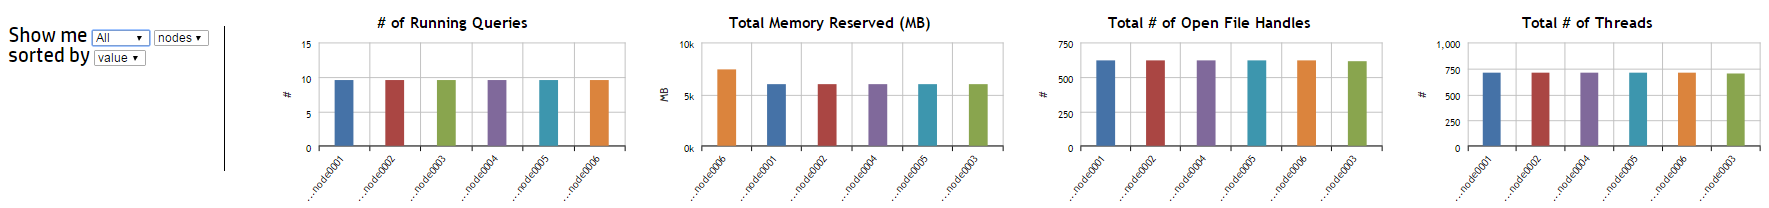
The Query Monitoring page refreshes every 20 seconds by default. To change the refresh interval, click the Page Settings button in the upper-right corner of the page. A dialog appears. Type the new refresh interval, in milliseconds, in the text box.
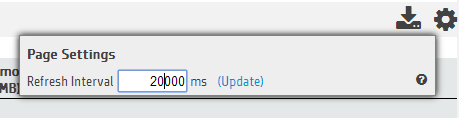
Sorting or searching queries by session ID or client label
The Query Monitoring Activity > Running Queries page includes columns that display the Session ID and Client Label for each query. You can sort the queries by Session ID or Client Label, or use the search field below either column to search for queries with a specific Session ID or Client Label.
Filtering chart results
Use the search field below each column title to narrow down your chart results. (For example, if you enter the text SELECT product_description in the Search Queries field and select a specific node in the Initiator Node column, the chart returns only queries which both contain that text and were initiated on the node you specified.)
Click a column title to sort the order of the queries by that category.
There may be a large number of results for Completed and Failed Queries. Use the Customize section at the top of these two tabs to further filter your chart results. For either tab, you can select a custom date and time range for your results.
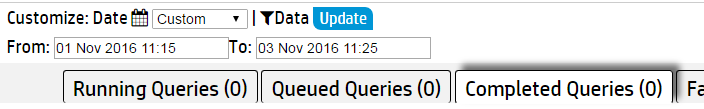
In the Completed Queries tab, click Data to enter additional query information to filter based on any of the following fields:
-
User
-
Request
-
Request Duration
-
Node
-
Request label
Viewing more details
Click a query to view the entire query.
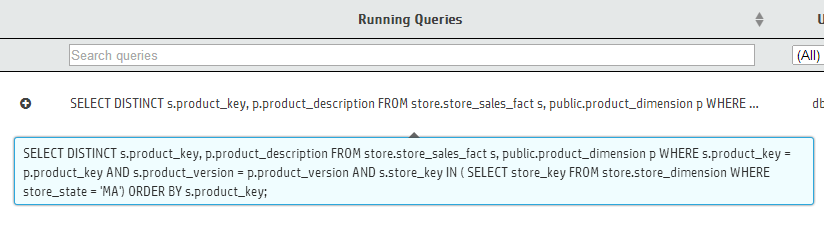
In the Failed Queries chart, click the plus (+) icon next to a failed query to see the failure details for each node involved in the query's execution.
To export the data in one of the Query Monitoring tables, click the table's tab, then click the Export ( ) button in the upper-right corner of the page. The browser downloads the data for that chart in a .dat file. The data exported includes columns that may not be visible in the MC, including the minimum and maximum values for Memory, Thread Count, and Open File Handles.
8.9.9 - Monitoring catalog memory with MC
The Catalog Memory activity page displays the catalog memory for each node.
The Catalog Memory activity page displays the catalog memory for each node. Use this page to check for sudden changes in catalog memory, or discrepancies in memory distribution across your nodes.
The Catalog Memory page displays:
-
A node details table. The table lists the details of each node in the database, including their current catalog memory and total memory usage.
-
A catalog memory chart. A line graph visualization of each node's catalog memory usage over time. Each line represents a node. The color legend at the bottom of the chart indicates the color of each node's line.
In the image below, catalog memory begins at 0GB for all three nodes. Over the next twenty minutes, catalog memory increases to 0.04GB in the second node (orange), then the first node (cyan), and finally in the third node (dark blue). Starting at 16:55, note that the three overlapping node lines appear as one line when all three nodes have the same catalog memory.
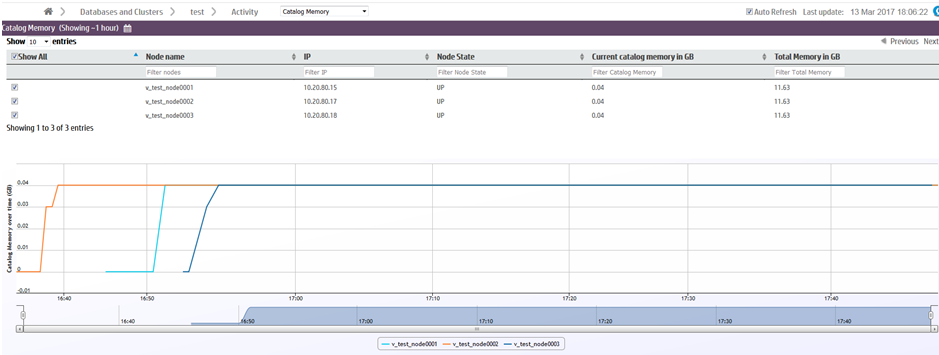
Filtering chart results
If you have many nodes in your database, you may want to display only certain nodes in the catalog memory chart. You can remove nodes from the chart in two ways:
Viewing more details
Hover over any line in the chart to view the time, node name, and catalog size.
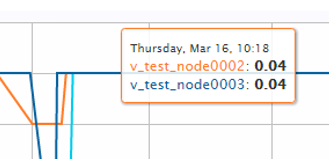
At the bottom of the chart is a summary bar that shows a quick overview of the catalog memory over time. Move the sliders on either side of the chart to zoom in on a specific time frame in the chart. When zoomed in, you can use the scrollbar to move forward or backward in time.
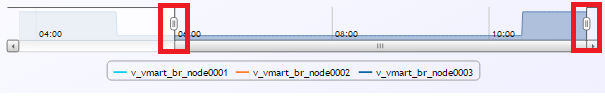
8.10 - Monitoring resource pools with MC
Management Console allows database administrators to monitor and configure resource pools through the Activity and Configuration pages.
Management Console allows database administrators to monitor and configure resource pools through the Activity and Configuration pages. These pages help you manage workloads by providing visual representations of resource usage as well as resource pool configuration options.
Monitoring resource pools charts
You can monitor your resource pools using the Resource Pools Monitoring charts, accessible through the Management Console Activity page.
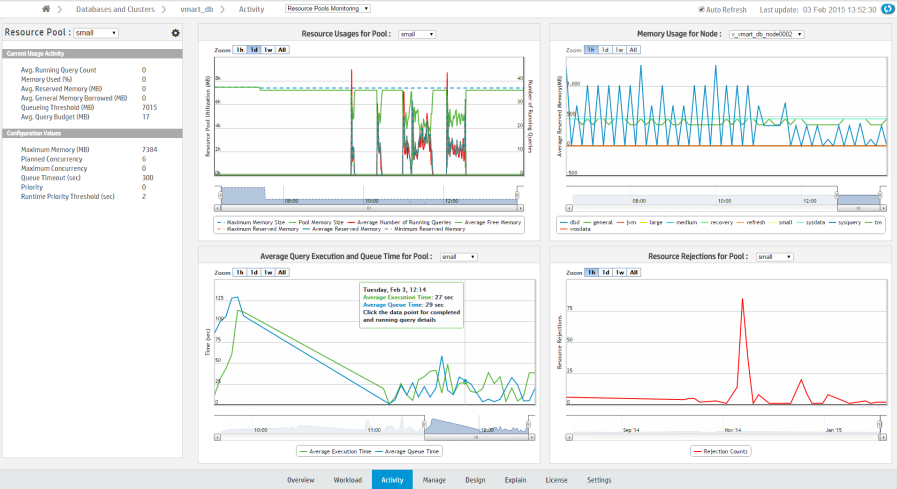
Select a resource pool to view using the Resource Pool menu, located in the leftmost sidebar. In the sidebar, Current Usage Activity displays the pool's real-time statistics.
Monitor the selected resource pool using the following charts, which display the pool's historic data:
-
Resource Usages for Pool: Shows the historically averaged acquired memory usage by each pool across all nodes. The graph uses two y-axes, one that shows memory size, and a second that shows the total number of running queries. Data is collected every hour. Hover over a data point for a summary of the memory usage at that specific point.
-
Memory Usage in Node: Shows the historically acquired memory usages by all pools across all nodes. Data is collected every hour. Hover over a data point for a summary of the memory usage at that specific point. Use the title bar dropdown to display the memory usage for a specific node. For Eon mode databases, you can also display the memory usage for a specific subcluster, all subclusters, or nodes not assigned to a subcluster. An Eon mode database has one default subcluster, and may have additional user-defined subclusters.
-
Average Query Execution and Query Time in Pool: Shows the averaged query queue time plotted against the query execution time by each pool across all nodes. Data is collected every minute. Hover over data to get the average query execution and queue time in the specified pool. Click a data point to show detailed individual query information.
-
Resource Rejections in Pool: Shows the historical total number of resource requests that were rejected in each pool across all nodes. Data is collected every hour. Click a data point to show rejection details and reasons in a pop-up window.
Configuring resource pools in MC
Database administrators can view information about resource pool parameters and make changes to existing parameters through the Management Console Configuration page. You can also create and remove new resource pools, assign resource pool users, and assign cascading pools.
See Configuring Resource Pools in Management Console
Permissions
Only the database administrator can monitor and configure resource pools in Management Console.
See also
8.10.1 - Configuring resource pools with MC
Database administrators can view information about resource pool parameters and make changes to existing parameters in MC through the Resource Pools Configuration page.
Database administrators can view information about resource pool parameters and make changes to existing parameters in MC through the Resource Pools Configuration page. You can also create and remove new resource pools, assign resource pool users, and assign cascading pools.
Access the Resource Pools Configuration page from the Settings page by selecting the Resource Pools tab.
You can also access the Configuration page from the Resource Pools Monitoring chart, accessible through the Management Console Activity page. Click the tools icon on the top of the leftmost sidebar.
Permissions for monitoring and configuring resource pools
Only the database administrator can monitor and configure resource pools in Management Console.
Modify resource pool parameters
-
On the Resource Pools Configuration page, choose a resource pool from the Resource Pools field. Parameter fields for that resource pool appear.
-
Use the parameter fields to view and modify parameters for the resource pool. Hover your cursor in the parameter field to display information about that parameter.
-
Click Apply to save your changes. A success message appears
Modify resource pool users
To add or remove resource pool users:
-
On the Resource Pools Configuration page, select a resource pool from the Resource Pools field.
-
Next to the Pool Users field, click Add/Remove Pool Users. The Modify Users for Resource Pool dialog appears.
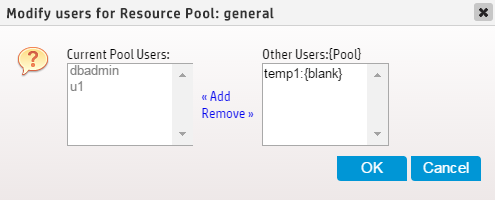
-
The dialog displays users assigned to the resource pool in the Current Pool Users list. The Other Users list displays all other resource pool users are displayed, along with the pool to which they are currently assigned.
-
To add users to the resource pool: Select the desired users from Other Users list and click Add.
-
To remove users from the resource pool: Select the users to be removed from the Current Pool Users list and click Remove.
-
Click Apply to save your changes. A success message appears.
Create and remove resource pools
Database administrators can use MC to create resource pools and assign resource pool users, and remove user-generated resource pools.
To create a resource pool:
-
On the Resource Pools Configuration page, click Create Pool. Fields pre-populated with pool parameter default values appear.
-
Enter the new resource pool's parameters in the fields.
-
Click Create Pool. A success message appears.
To remove a resource pool:
-
First, remove all users from the resource pool to be deleted. This can be done on the Resource Pool Configuration Page.
-
When all users have been removed from the resource pool, choose the resource pool from the Resource Pools field on the Resource Pool Configuration Page. Parameter fields for that resource pool appear.
-
Click Remove Pool. A Confirm dialog appears.
-
Click OK in the Confirm dialog. A success message appears.
See also
8.11 - Monitoring database messages and alerts with MC
Management Console periodically checks system health and performance.
Management Console periodically checks system health and performance. When an important event occurs or system performance fluctuates beyond user- or system-defined limits, the Management Console generates a message to alert you about the state of your system. View and manage alerts in the Message Center.
Message alert notifications
Management Console uses multiple methods to communicate alert notifications to ensure that you are immediately aware of any changes to your database that might require attention. You receive message notifications by email, and you can view notifications using the following components:
-
Message envelope icon: This icon is located by the MC Help icon, in the top-right of any database-specific page. Select this icon display the Message Center quick view, and perform archive, read, and delete message actions. For details about message actions and alerts, see Message center.
-
Unread Messages (This Week) widget: On the database Overview tab, this widget is located in the quick stats sidebar. It displays unread, high-priority messages. Select the number (including 0) in the widget to go to the Message Center.
Management Console provides pre-configured alerts to provide system monitoring capabilities without manual setup. Each alert has a pre-configured threshold that defines the acceptable performance limit, and MC sends a message notification when the database exceeds that threshold.
By default, pre-configured alerts are not active and require minimal initial setup. For details on how to set pre-configured alert properties, see Alert configuration.
Node health
Vertica provides the following pre-configured alerts to monitor node health:
-
Node CPU
-
Node Memory
-
Node Disk Usage
-
Node Disk I/O
-
Node CPU I/O Wait
-
Node Reboot Rate
-
Node State Change
-
Node Catalog Memory
Network health
Vertica provides the Network I/O Error pre-configured alert to monitor network health.
Query
Vertica provides the following pre-configured alerts to monitor queries:
-
Queued Query
-
NumberFailed
-
Query Number
-
Spilled Query Number
-
Retried Query Number
-
Query Running Time
License status
Vertica provides the License Usage pre-configured alert to monitor the status of your Vertica license.
Resource pool
MC can send alerts when an individual resource pool reaches a specified state or usage level. For details about resource pool configuration parameters, see Built-in resource pools configuration.
Important
Default settings for resource pool alerts apply to the GENERAL pool only.
You can configure the MC to send the following resource pool alerts:
-
Queries Reaching the Max Allowed Execution Time: Triggers an alert when the specified number of queries reach the RUNTIMECAP execution threshold for the resource pool. You cannot set this alert if the resource pool does not have a RUNTIMECAP threshold set, or if the resource pool has a secondary resource pool.
-
Queries With Resource Rejections: Triggers an alert when the specified number of queries exceed a specified number of resource rejections within a set period of time.
-
Minimum Starting Resource Value: Triggers an alert when the resource pool reaches the minimum amount of resources allocated for the MEMORYSIZE value.
Note
By default, you cannot set MEMORYSIZE for the GENERAL pool. The GENERAL pool must have at least 1GB of memory and it cannot be smaller than 25% of the entire system memory.
-
Maximum Allowed Resource Value: Triggers an alert when the resource pool reaches the MAXMEMORYSIZE value.
-
Ended Query With Queue Time Exceeding Limit: Triggers an alert when the specified number of completed queries were queued for a specified length of time within a timeframe.
-
Ended Query With Run Time Exceeding Limit: Triggers an alert when the specified number of completed queries ran for a specified length of time within a timeframe.
Custom alerts
Create custom alerts to measure system performance metrics that are not monitored by the pre-configured alerts. Create a dynamic SQL query that triggers an alert when it returns any results. You can configure how often an alert is generated, the alert priority, and who receives email alerts. For example, you can create custom alerts that monitor the following:
For details about creating and managing custom alerts, including a tutorial on how to create a custom alert that monitors failed logins, see Custom alerts.
Default notifications
Management Console generates the following messages about the database that appear only in the Message Center:
-
Low disk space
-
Read-only file system
-
Loss of K-safety
-
Current fault tolerance at critical level
-
Too many ROS containers
-
Change in node state
-
Recovery error
-
Recovery failure
-
Recovery lock error
-
Recovery projection retrieval error
-
Refresh error
-
Refresh lock error
-
Workload analyzer operations
-
Tuple Mover error
-
Timer service task error
-
Last Good Epoch (LGE) lag
-
License size compliance
-
License term compliance
Disk space check and cleanup
When the Management Console checks alerts, it generates a result set and saves it to disk. If you use aggressive alert configurations, the result set might use a large amount of disk space. By default, Vertica reserves 500MB of disk space to save result sets.
Vertica checks the free disk space 2 times each day and cleans alerts that are older than 7 days. If the available disk space is low, custom alerts are disabled. Notifications and emails are generated when an alert is disabled due to insufficient disk space.
The /opt/console/vconsole/config/console.properties file contains these settings. Edit the following values to configure the how the MC manages your disk space:
|
Property |
Description |
console.diskspace.threshold |
The amount of disk space Vertica reserves to save result sets.
Default: 500MB
|
customthreshold.alerts.toKeepInDays |
The number of days that alerts are retained on disk.
Default: 7
|
8.11.1 - Message center
The Message Center organizes system performance alerts to help you effectively monitor the state of your database.
The Message Center organizes system performance alerts to help you effectively monitor the state of your database. Pre-configured and custom alerts generate messages when the component they measure exceeds the specified threshold.
Access the Message Center in the following ways:
-
On the MC Home page, select Message Center in the MC Tools section.
-
Select the message envelope icon in the top-right of any database-specific page, then select Message Center in the quick view.
-
On the database Overview tab, select the number (including 0) in the Unread Messages (This Week) widget.
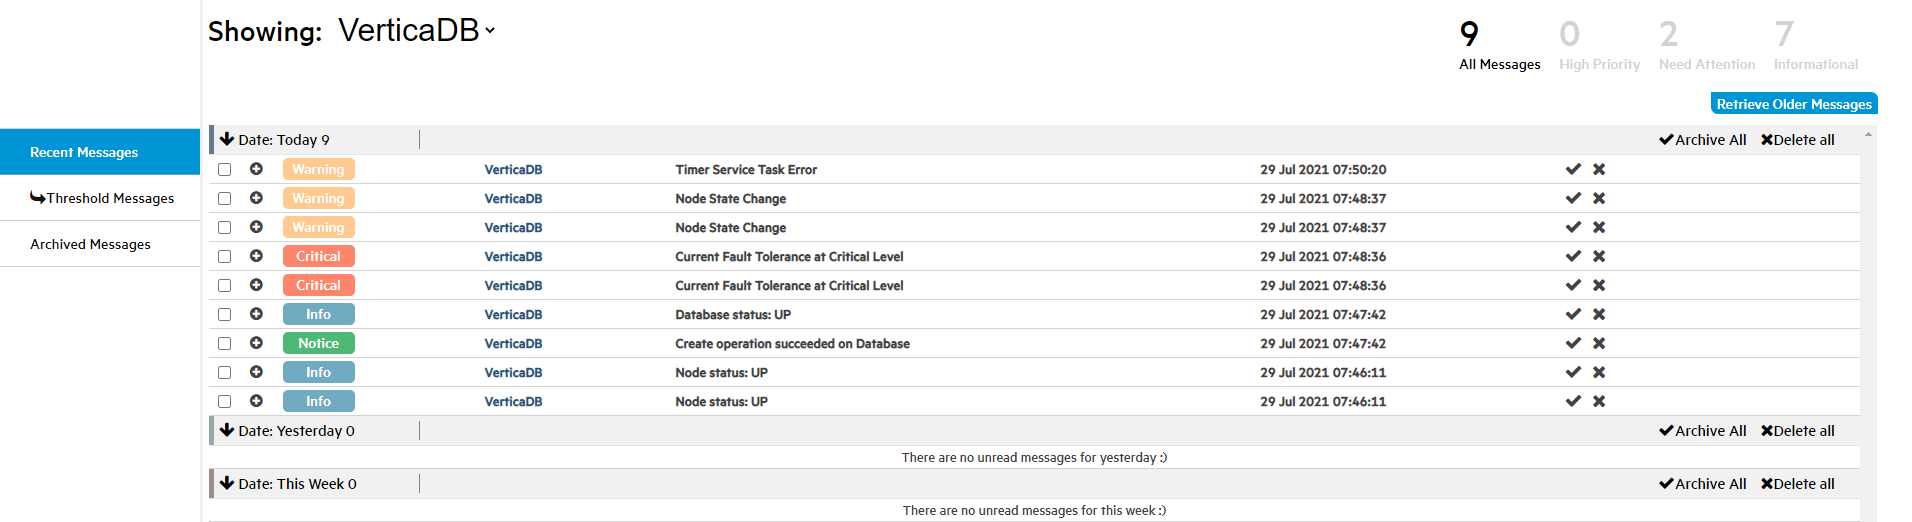
The Message Center can retrieve up to 10,000 of the most recent messages generated for a database. By default, it lists up to 600 messages generated in the previous week. For details on how to retrieve messages that predate the previous week, see Date Filtering.
Note
To adjust the maximum number of messages listed in the Message Center, edit the messageCenter.maxEntries value in the /opt/vconsole/config/console.properties file from the command line. For example, the following value increases the number of alerts listed in the Message Center to 5000:
messageCenter.maxEntries=5000
Filter the messages grid
The Management Console provides options that filter the messages that populate the messages grid by database, keyword, message type, and date. Use one or more of these options to view only the messages that you want to manage.
Database filtering
Select Showing to list the databases that are associated with the logged in user account. Choose a specific database to view only messages for that database, or select (All DBs) to view and manage messages across all of your databases.
Keyword filtering
Use the search bar at the top-right of the screen to list messages that contain the entered text. For example, if you enter 29, the grid lists any messages that contain those characters within the message title or message details available when you click the plus (+) icon to expand the message row.
Message type filtering
After you select a value for Showing, the number of messages for that value are totaled and grouped by type near the top-right corner of the screen, below the search bar. These message types use the syslog standard to define severity levels. The MC message types are defined as follows:
-
All Messages: Messages that are not archived or deleted, and are within messageCenter.maxEntries for the previous week.
-
High Priority: Messages that you assigned a High Priority alert priority on the Alerts tab. These messages correspond to syslog levels 0 and 1.
-
Need Attention: Critical or error messages that indicate that correspond to syslog levels 2 and 3.
-
Informational: Warning, notice, informational, or debugging messages that correspond to syslog levels 4, 5, 6, and 7.
To populate the grid with only a single message type, select the number or message type description.
Date filtering
Select Retrieve Older Messages to enter From and To dates to list messages that were generated before the previous week. Vertica stores 10,000 of the most recent database messages so that you can retrieve older messages when necessary.
Message groups
The Message Center groups messages and notifications as Recent Messages, Threshold Messages, and Archived Messages. All message groups use the following priority levels and color codes:
-
Critical (Red)
-
Warning (Orange)
-
Notice (Green)
-
Info (Blue)
Recent messages and threshold messages
Recent Messages include the most recent messages generated within the previous week within the messageCenter.maxEntries value. Threshold messages include messages that are generated when the database exceeds a pre-configured, custom, or default alert threshold.
Recent Messages and Threshold Messages are listed using the message type, database name, a description of the message, and the date and time that the message was generated. Additionally, there are collapsible grid headings that group the alerts by Today, Yesterday, and This Week.
Archived messages
Archived messages are messages that you manually saved for later. When you select the check icon for an individual message or select Archive All, MC marks the message as read and archives it. Archived messages do not have the same date or messageCenter.maxEntries restrictions as Recent Messages or Threshold Messages.
The Archived Messages tab contains the following tools to refine search result filters:
-
Use the From and To boxes above the grid to define a time frame for the archived message search. To combine multiple time frames, select the Do not clear existing search results checkbox.
-
Sort or filter messages even further using the Type, Database Name, Description, and Date columns.
Message actions
Perform actions on all, multiple, or individual messages. To execute actions on all messages at the same time, use the Select All or Select None buttons near the top-right of the screen by the search bar.
Each message row has a checkbox so that you can perform actions on one or more messages simultaneously. Select the plus (+) icon to expand the message row and display the following message details:
For additional information about each message, query EVENT_CONFIGURATIONS.
When you select the X icon or select multiple messages and click the Delete Msgs or Delete all buttons, the message is permanently deleted.
8.11.2 - Alert configuration
Enable and customize settings for pre-configured or custom alerts for each database.
Enable and customize settings for pre-configured or custom alerts for each database. For example, you can set the Threshold Value for Node Disk Usage to a 20% minimum or 80% maximum. If any node exceeds either of those thresholds, the MC generates a message and you receive a notification. Take action on alerts in the Message center.
To access the Alerts tab, log in to the Management Console, then select Go to database > Settings > Alerts.
Configurable settings
To configure any alert, you must toggle the switch on the left of the row to the on position. Node State Change is the only pre-configured alert turned on by default. By default, custom alerts are toggled off.
Pre-configued and custom alerts have the following settings:
-
Query variables: Custom alerts only. Query variables are the variables that you added when you created the alert. You must provide a value for each variable. The query variable is not validated after you create the alert. If you update the variable to a value that results in an invalid query, the alert is silently disabled during the next execution.
To view the original SQL query, hover the mouse over the alert name to display the alert in a tooltip.
-
Threshold Value: Pre-configured alerts only. You can add a lower and upper limit on acceptable operating values for the component.
-
Check Interval: This value determines how often Vertica executes the underlying SQL for the alert.
-
Alert Priority: You can assign one of the following priority labels to determine how the alert is distributed:
-
Alert and Critical: Displays the message using the message alert notification mechanisms on the Overview page and creates a message in the Message Center.
-
Warning: Creates a message in the Message center.
-
Alert Email Recipients: Configure email notifications for any alert priority when the alert is triggered. You must have SMPT configured. For details about adding email recipients to alerts, see Custom alerts.
-
Vertical ellipses: For custom alerts and new resource pool alerts, click the vertical ellipses to delete the alert. You must have MC ADMIN role privileges to delete an alert.
Configuring resource pool alerts
Resource pool alerts use the same configurable settings as the other alerts, but you can set alerts per resource pool. By default, pre-configured alerts are set for the GENERAL pool only.
Note
Only users with
MC ADMIN role privileges can add alerts for resource pools other than the GENERAL pool.
-
Log in to the Management Console and select Databases > Settings > Alerts.
-
In the top row labeled Resource Pool, select the blue box with a plus (+) symbol on the far right of the row. When you hover over the button, the button expands and displays Add Resource Pool Alert +.
The New Resource Pool Alert window opens.
-
In Alert Name, choose the alert that you want to add to a resource pool.
-
In Resource Pool, choose the resource pool that you want to add this alert to.
-
When you are finished configuring the remaining settings, select Create Alert.
Edit Check Interval, Alert Priority, and Alert Email Recipients as you would other alerts. For guidance, see Configurable Settings or Custom alerts.
To delete the alert, select the vertical ellipses at the right of the row, and select Delete. You must have MC ADMIN role privileges to delete an alert.
8.11.3 - Setting up SMTP for email alerts
Management Console can generate email notifications when your database exceeds high-priority alert thresholds.
Management Console can generate email notifications when your database exceeds high-priority alert thresholds. To receive email alerts, you must configure your SMTP settings in MC.
You must be an administrator to provide SMTP settings. To set up MC to send email:
-
Select the Email Gateway tab on the MC Settings page.
-
Provide the following information about your SMTP server:
-
Email Server (Hostname): the hostname or IP of the SMTP server
-
Port: the port of the SMTP server
-
Session Type: the type of connection to use (e.g. SSL)
-
SMTP Username (optional): the username credential for connecting to the server
-
SMTP Password (optional): the password credential for connecting to the server
-
Sender Address: The sender address for your server when it sends email alerts
-
Trust SSL Certificate: Whether to automatically trust the SMTP server's certificate
-
Click Test at the top of the page. MC validates your SMTP settings and sends a test email to the inbox of the email alias you provided.
-
Verify that you successfully received the test email.
-
Click Apply at the top-right of the page to save the settings.
After you set up SMTP for email, you can configure MC to send high-priority threshold alerts through email. For details, seeAlert configuration or Custom alerts.
8.11.4 - Custom alerts
Create custom events-based alerts to track abnormalities and performance fluctuations for node health, queries, and resource pools using your own database schemas and tables.
Create custom events-based alerts to track abnormalities and performance fluctuations for node health, queries, and resource pools using your own database schemas and tables. When the database triggers an active alert, you receive notifications according to the alert priority, and can take action in the Message center.
Creating a custom alert
You must have MC ADMIN role privileges to create a custom alert.
The following steps create a custom alert named Failed logins within a X time period to track the number of failed logins in the previous two hours, per user. This alert might indicate a possible distributed denial-of-service (DDoS) attack, or an application behaving inappropriately. The underlying SQL query uses a variable to create a dynamic threshold value that you can fine-tune after you create the alert.
-
Log in to the Management Console, then select Go to database > Settings > Alerts.
-
In the Custom Alerts row at the top of the page, click the blue box with a plus (+) symbol on the far right of the row. When you hover over the button, the button expands and displays Create Custom Alert +.
The Create custom alert window displays.
-
In Alert Name, enter Failed logins within X time period.
-
In SQL Query, enter the following SQL query:
SELECT
  login_timestamp,
  user_name,
  node_name,
  client_hostname,
  reason
FROM
  login_failures
WHERE
  reason in ('INVALID USER', 'FAILED', 'INVALID DATABASE')
  AND login_timestamp > sysdate - INTERVAL '{{Time_Interval}}'
The AND clause of the preceding query encloses the variable of type String named Time_Interval in double curly braces to represent a valid SQL syntax element.
A variable is a dynamic value that is evaluated at runtime that you can configure after you save the alert. You can add up to 6 variables per custom alert. Variable names may consist of a maximum of 14 alpha-numeric characters, including underscores. Verify that the variable uses the correct data type and format. Variables of type String require single quotes around the curly braces.
A SQL query triggers an alert if it returns one or more rows. Use the formatting or full screen buttons above and to the right of the SQL Query box as needed.
-
A box displays below the SQL Query box containing placeholder text that corresponds to each variable name. To test the alert, enter 2 Hours in this box.
-
Select Run Query. The Query Results section displays any rows returned from your query. Alternatively, you might encounter one of the following issues:
-
If you use invalid SQL syntax, you receive an error.
-
If the query returns more than 5 columns or 100 rows, you receive a warning. Because every query result set is saved to disk, it is important to be aware of the size of your result set. For more information, see Monitoring database messages and alerts with MC.
Important
Queries do not timeout. A long-running query runs until it succeeds or returns a Query Error that indicates that there are insufficient resources to continue.
Select Cancel Query to stop long-running queries.
-
When you are satisfied with the query results, select Create Alert.
The Create custom alert window closes and the alert you just created is listed in the Custom Alerts section on the Alerts page. When you point the mouse on the query name, the query is displayed in a tooltip. Under the query name, there are editable boxes that correspond to the variables you added when creating the alert.
-
In the Time_Interval variable box, enter 2 Hours.
-
Select a value for Check Interval. The default setting is 10 minutes. This value determines how often the query is executed.
-
Select a value for Alert Priority. By default, the alert is assigned the Critical value priority.
-
Optionally, select the Manage Emails icon under Alert Email Recipients to send an email alert to specific users when the alert is triggered. To register a user to receive email alerts, complete the steps in Setting up SMTP for email alerts.
-
Complete the following steps in the Manage Email Recipient window:
-
To add an existing user to an alert, click the checkbox beside the existing MC user, or select the box at the top to add all. For non-existing MC users, enter their email address at the bottom of the window.
-
In Email Interval, select how often the email is sent:
For example, if you select One hour, an email is sent every hour, even if the alert is triggered multiple times within the hour.
-
Click Save.
After you create the alert, toggle it on or off using switch at the far left of the alert row.
Editing a custom alert
You must have MC ADMIN role privileges to edit a custom alert.
-
Log in to the Management Console, then select Go to database > Settings > Alerts.
-
In the Custom Alerts row at the top of the page, locate the custom alert that you want to edit.
-
Select the vertical ellipses, and select Edit.
The Edit custom alert window opens and displays the previously saved values for the custom alert.
-
Edit the alert. You can edit any of the following alert properties:
-
Alert Name
-
SQL Query
-
Any variable values
-
Select Run Query. The Query Results section displays any rows returned from your query. Alternatively, you might encounter one of the following issues:
-
If you use invalid SQL syntax, you receive an error.
-
If the query returns more than 5 columns or 100 rows, you receive a warning. Because every query result set is saved to disk, it is important to be aware of the size of your result set. For more information, see Monitoring database messages and alerts with MC.
Important
Queries do not timeout. A long-running query runs until it succeeds or returns a Query Error that indicates that there are insufficient resources to continue.
Select Cancel Query to stop long-running queries.
-
When you are satisfied with the query results, select Update Alert.
Deleting an alert
To delete a custom alert, select the vertical ellipses at the right of the row, and select Delete. You must have MC ADMIN role privileges to delete an alert.
8.11.5 - Exporting MC-managed database messages and logs
You can export the contents of database messages, log details, query details, and MC user activity to a file.
You can export the contents of database messages, log details, query details, and MC user activity to a file.
Information comes directly from the MC interface. This means that if the last five minutes of vertica.log information displays on the interface, you can save that five minutes of data to a file, not the entire log. When you filter messages or logs, MC exports only the filtered results.
Depending on how you set your browser preferences, when you export messages you can view the output immediately or specify a location to save the file. System-generated file names include a timestamp for uniqueness.
The following table shows, by record type, the MC pages that contain content you can export, the name of the system-generated file, and what that file's output contains:
|
Message type |
Where you can export on MC |
System-generated filename |
Contents of exported file |
|
All db-related message types |
Message Center page |
vertica-alerts-<timestamp>sv |
Exports messages in the Message Center to a .csv file. Message contents are saved under the following headings:
|
|
MC log files |
Diagnostics page |
mconsole-<timestamp>.log |
Exports MC log search results from MC to a ** .log file under the following headings:
|
|
Vertica logs |
Manage page
Double-click any node to get to the details and then click the VerticaLog tab
|
vertica-vertica-<db>-<timestamp>.log |
Exports vertica log search results from MC to a .log file under the following headings:
|
|
Agent logs |
Manage page
Click any node to get to the details and then click the AgentTools Log tab.
|
vertica-agent-<db>-<timestamp>.log |
Exports agent log search results from MC to a .log file under the following headings:
|
|
Query details |
Activity page
Click any query spike in the Queries graph to get to the Detail page.
|
vertica-querydetails-<db>-<timestamp>.dat |
Exports query details for the database between <timestamp> and <timestamp> as a tab-delimited .dat file. Content is saved under the following headings:
-
Query type
-
Session ID
-
Node name
-
Started
-
Elapsed
-
User name
-
Request/Query
|
|
MC user activity |
Diagnostics page
Click the Audit Log task
|
vertica_audit<timestamp>.csv |
Exports MC user-activity results to a .csv file. Content is saved under the following headings:
-
Time
-
MC User
-
Resource
-
Target User
-
Client IP
-
Activity
|
8.12 - Monitoring MC user activity using audit log
When an MC user makes changes on the MC interface, whether to an MC-managed database or to the MC itself, their action generates a log entry that records a timestamp, the MC user name, the database and client host (if applicable), and the operation the user performed.
When an MC user makes changes on the MC interface, whether to an MC-managed database or to the MC itself, their action generates a log entry that records a timestamp, the MC user name, the database and client host (if applicable), and the operation the user performed. You monitor user activity on the Diagnostics > Audit Log page.
MC records the following types of user operations:
-
User log-on/log-off activities
-
Database creation
-
Database connection through the console interface
-
Start/stop a database
-
Remove a database from the console view
-
Drop a database
-
Database rebalance across the cluster
-
License activity views on a database, as well as new license uploads
-
Workload analyzer views on a database
-
Database password changes
-
Database settings changes (individual settings are tracked in the audit record)
-
Syncing the database with the cluster (who clicked Sync on grid view)
-
Query detail viewings of a database
-
Closing sessions
-
Node changes (add, start, stop, replace)
-
User management (add, edit, enable, disable, delete)
-
LDAP authentication (enable/disable)
-
Management Console setting changes (individual settings are tracked in the audit record)
-
SSL certificate uploads
-
Message deletion and number deleted
-
Console restart from the browser interface
-
Factory reset from the browser interface
-
Upgrade MC from the browser interface
Background cleanup of audit records
An internal MC job starts every day and, if required, clears audit records that exceed a specified timeframe and size. The default is 90 days and 2K in log size. MC clears whichever limit is first reached.
You can adjust the time and size limits by editing the following lines in the /opt/vconsole/config/console.properties file:
vertica.audit.maxDays=90vertica.audit.maxRecords=2000
Filter and export results
You can manipulate the output of the audit log by sorting column headings, scrolling through the log, refining your search to a specific date/time and you can export audit contents to a file.
If you want to export the log, see Exporting the user audit log.
If you perform a factory reset on MC's Diagnostics page (restore it to its pre-configured state), MC prompts you to export audit records before the reset occurs.
8.13 - Monitoring external data sources with MC
By default, Management Console monitors a database using information from that database's Data Collector (DC) tables.
By default, Management Console monitors a database using information from that database's Data Collector (DC) tables. MC can also monitor DC tables you have copied into Vertica tables, locally or remotely.
MC administrators provide mappings to local schemas or to an external database containing the corresponding DC data. MC can then render its charts and graphs from the new repository instead of from local DC tables. This offers the benefit of loading larger sets of data faster in MC, and retaining historical data long term.
Note
Note: MC also offers
External Monitoring, which allows you to set up a Vertica storage database through the MC interface, then use Kafka to stream your data to the storage database. You can use the Data Source mapping process below if you prefer to set up your own alternative data source, or do not plan to use Kafka streaming.
Map an alternative data source
-
On the MC Settings page, navigate to the Data Source tab.
-
Select the database for which you are creating the data source mapping.
-
Choose the database user for which you want to create the mapping.
-
Set Repository Location to Local or Remote.
-
If Remote is selected, provide JDBC connection parameters for the remote database repository. Click Validate Connection Properties to confirm a successful connection.
-
Enter the schema mappings for v_internal and v_catalog. MC does not support mapping the v_monitor schema.
-
Input your table mappings in one of the following ways:
-
Click Auto Discover. MC retrieves the table mappings based on the database and schema mappings you provided.
-
Click Manual Entry. Manually input table mappings.
-
Click Load Configurations. If you previously saved a data source configuration for the database in a file, import the file to use that configuration for the currently selected user.
-
Optionally, click Save Configurations to export this configuration file. You can create a mapping for another database user with this configuration file later.
-
Click Apply to save and apply your configuration settings.
Reports using unmapped schemas
If a report in MC needs to access a locally stored schema or table that is unmapped, MC includes information from the local DC tables for that schema to complete the report.
For remote configurations, if a report depends on an unmapped schema or table, the entire report is run against the local DC tables. If the remote database is down when MC attempts to run a report against it, MC reruns the report against the local database.
When the MC runs a report, it records missing mappings in the MC log under the INFO severity level.
8.14 - Monitoring depot activity with MC
The depot is a cache-like component on each node that downloads and stores local copies of table data.
The depot is a cache-like component on each node that downloads and stores local copies of table data. Queries that can access the data that they need on the depot, instead of fetching it from communal storage, generally execute much faster. If your database is in Eon Mode, you can use the Depot Activity page to view depot settings and evaluate how efficiently it handles queries and load activity.
To view depot settings and activity, navigate to Database > Activity > Depot Activity Monitoring. The Depot Activity page has the following tabs:
8.14.1 - Why monitor the depot?
If you run an Eon Mode database on a cloud platform such as AWS, monitoring your depot in MC can help you tune performance and reduce expenses.
If you run an Eon Mode database on a cloud platform such as AWS, monitoring your depot in MC can help you tune performance and reduce expenses. MC can help address the following questions:
To access depot monitoring capabilities: from the MC home page, navigate to Database > Activity > Depot Activity Monitoring. See Monitoring depot activity with MC.
How often do queries hit the depot versus the S3 bucket?
Queries run faster when they access node-based depot data rather than fetch it from communal storage. For details, see Query Depot Hits and Misses
Is the depot optimally sized?
To optimize your queries for speed, you might want to resize the depot to fit your query workload. This ensures that queries do not need to spend extra time fetching data from the communal repository on S3. The Eon meta-function ALTER_LOCATION_SIZE lets you change depot size on one node, all nodes in a subcluster, or all nodes in the database. The following statement resizes all depots in the database to 80MB:
=> SELECT alter_location_size('depot', '','80%');
 alter_location_size
---------------------
 depotSize changed.
(1 row)
On the Depot Activity Monitoring screen, in the Communal Storage Access Calls chart, MC displays how many of each type of API call your queries executed in a given timespan. To see details on which queries were running, click on any point on the chart.
What is the current depot usage on each node?
The Depot Content tab of the Depot Activity Monitoring page provides detailed information about how each table is using the depot space on the cluster nodes.
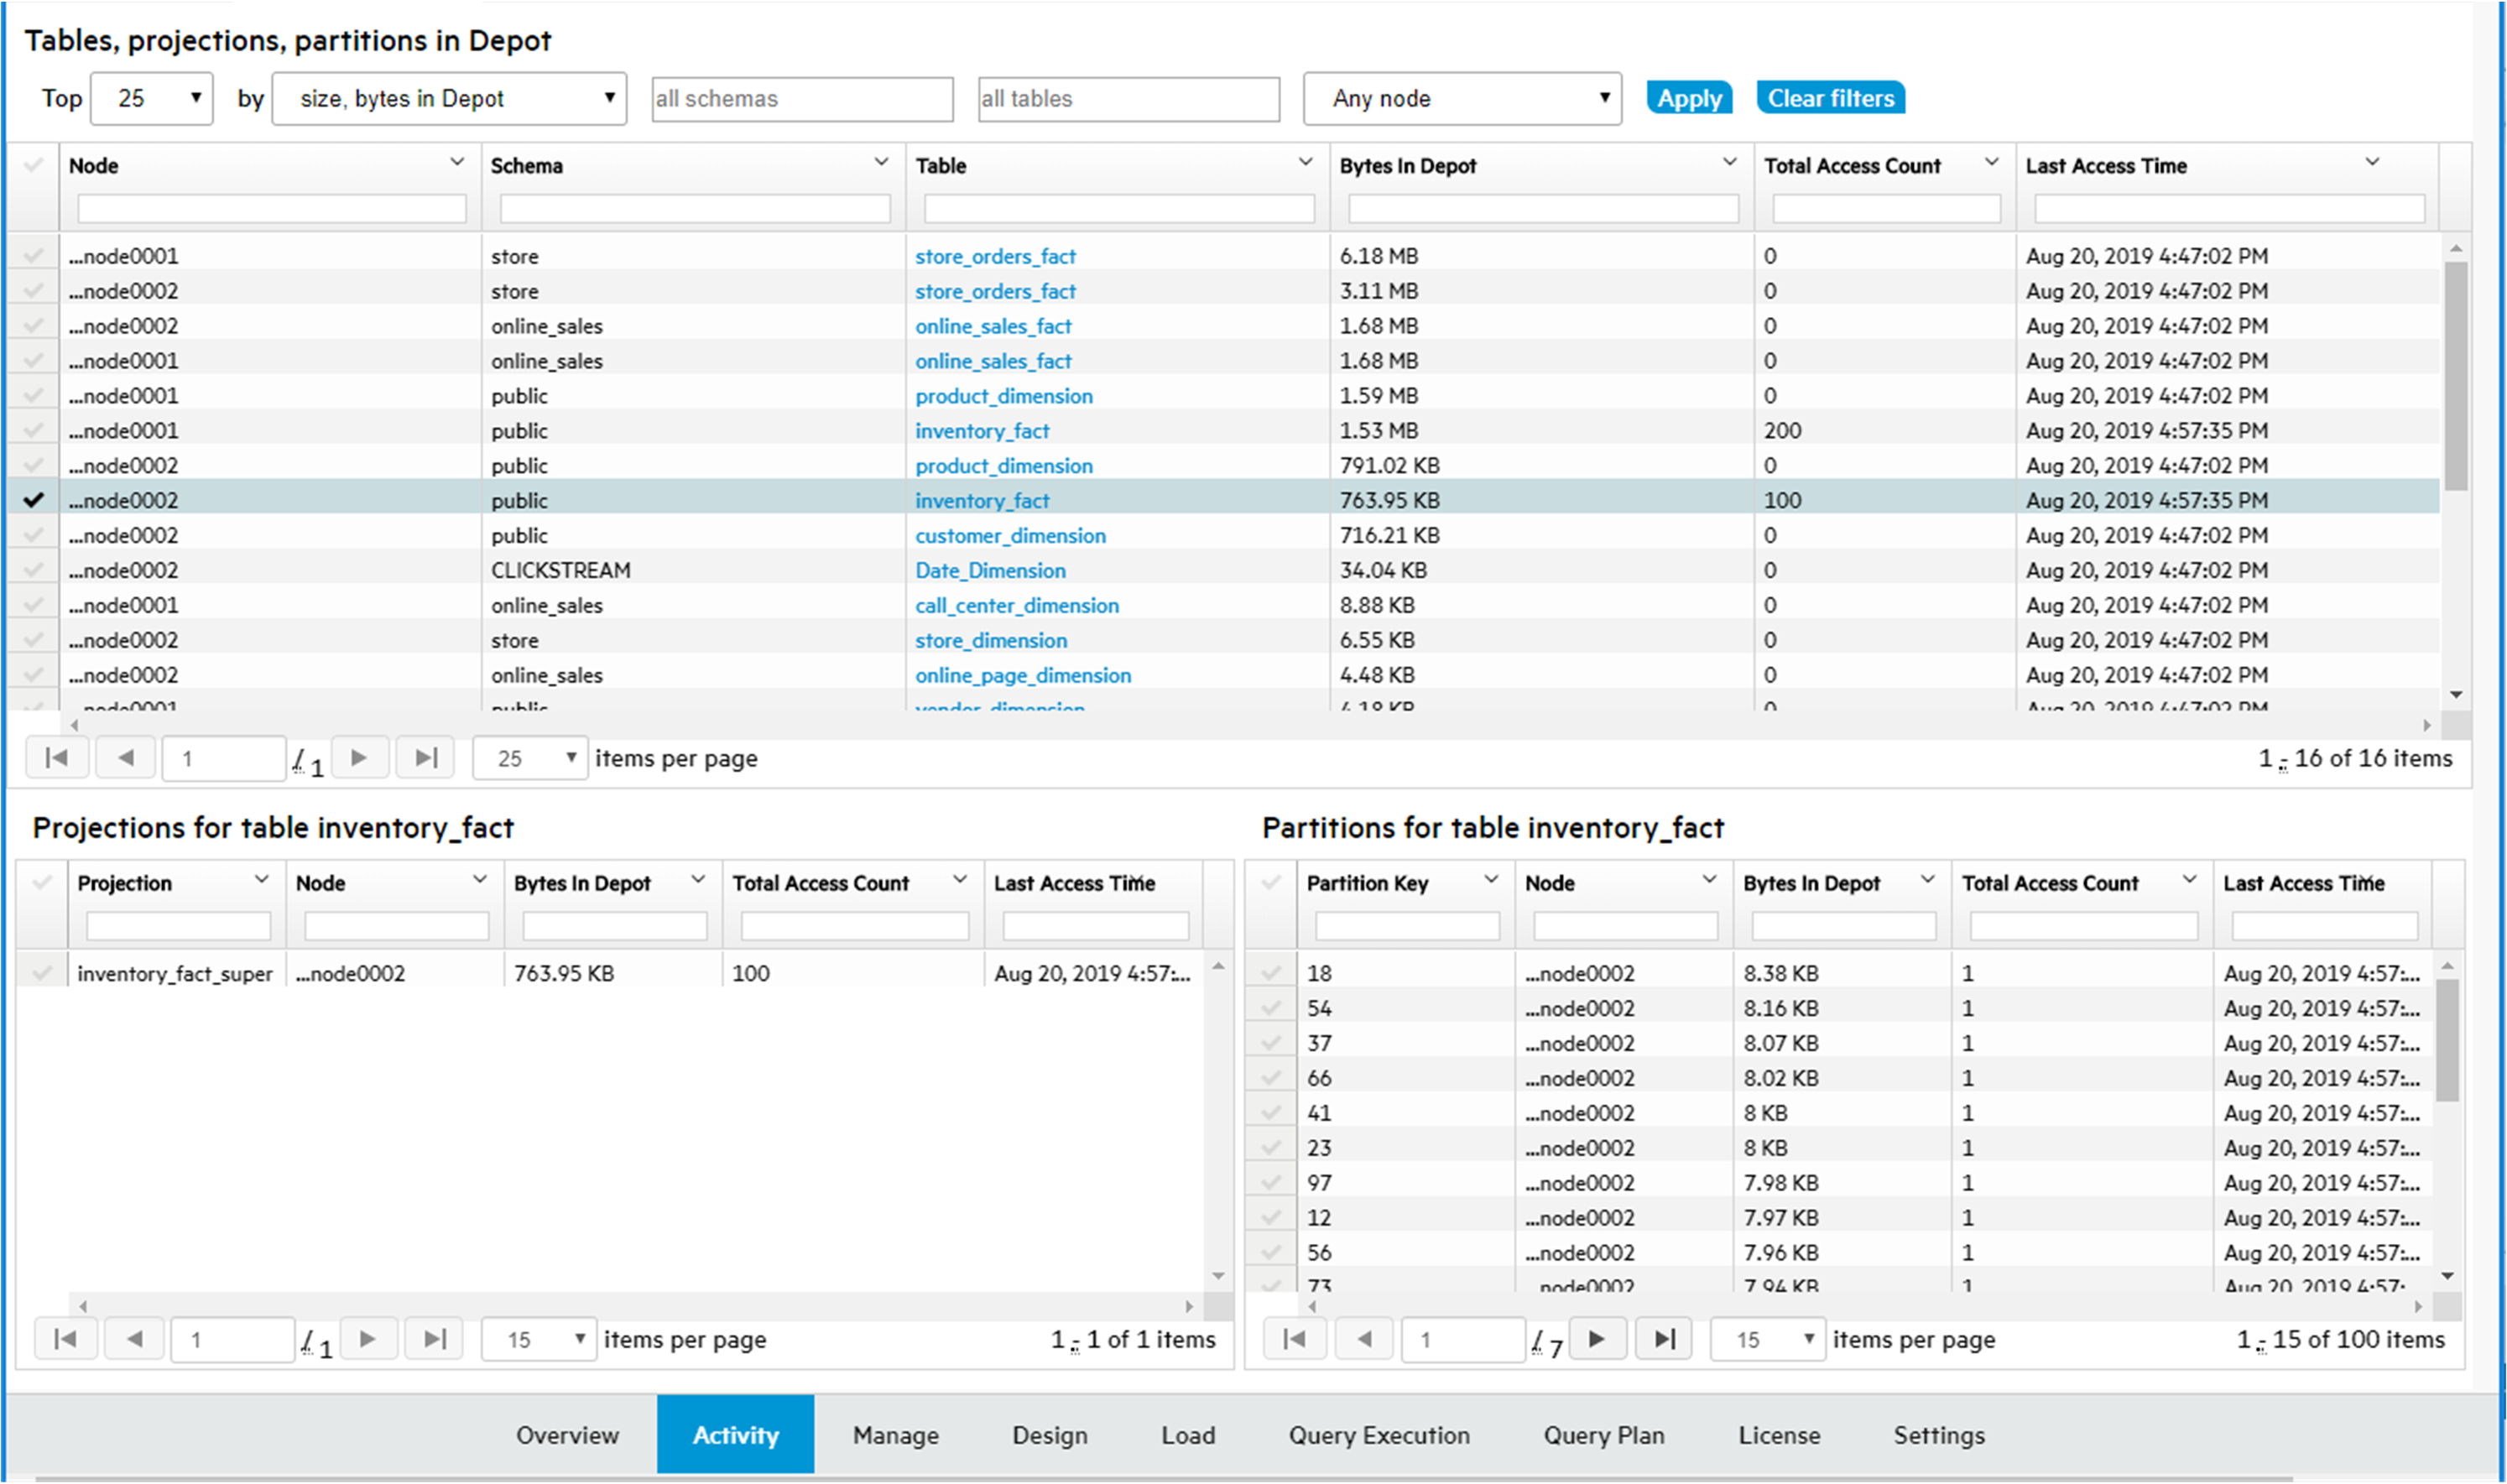
On the Depot Content tab, when you select a row, you are selecting the table depot content on a node. MC loads the details for that table for that node in the bottom section of the page, to show depot content for the selected table, broken down by either projections or partitions on a given node.
8.14.2 - Viewing depot activity
The At A Glance screen provides a high level view of depot activity.
The At A Glance screen provides a high level view of depot activity. The screen is divided into several sections:
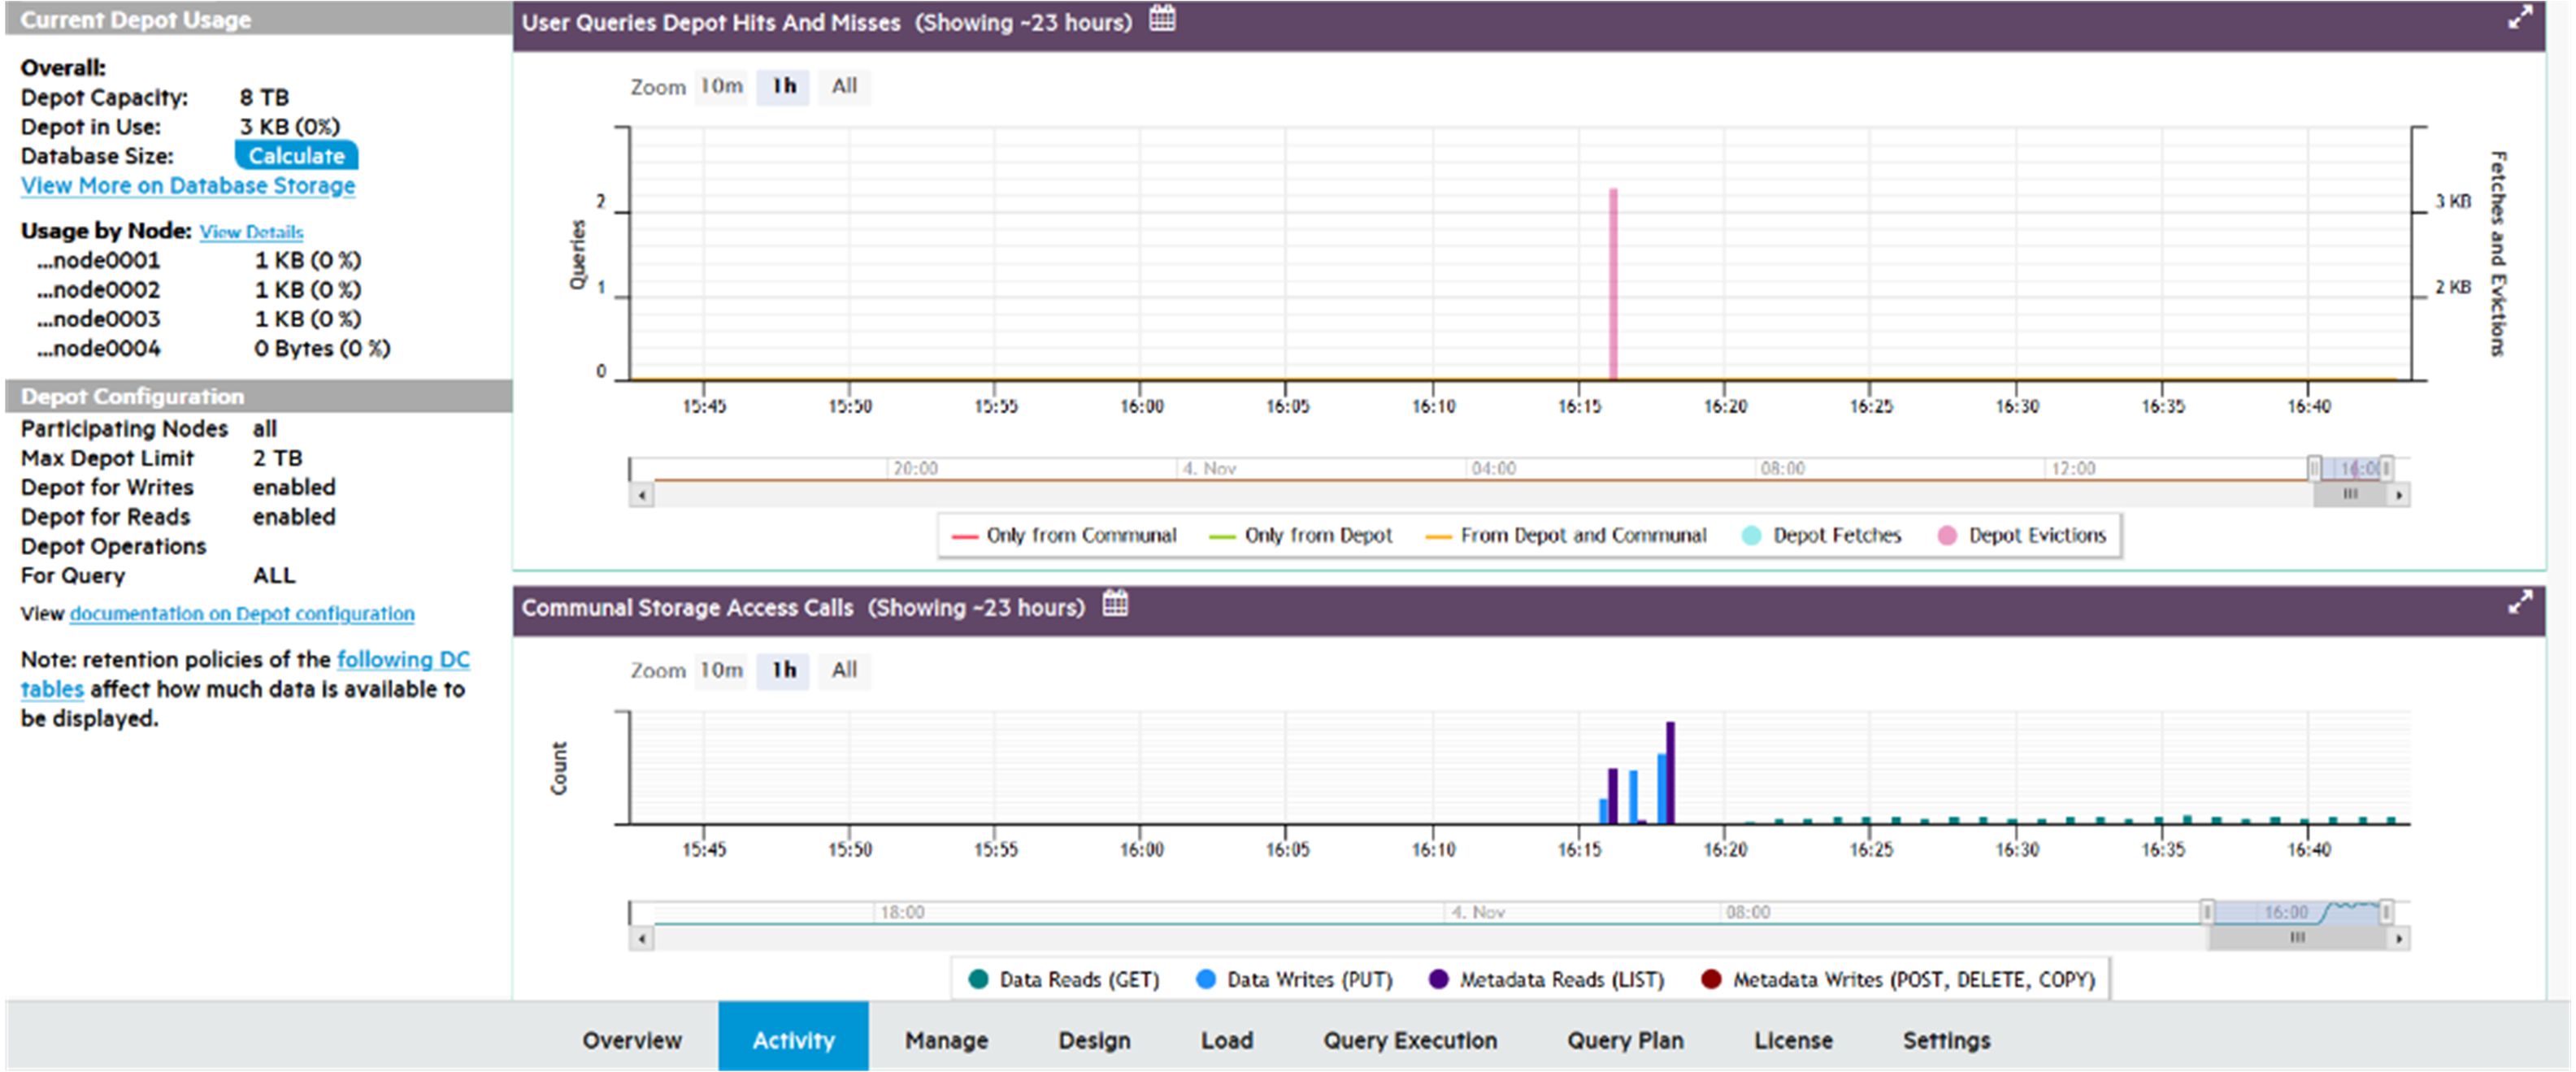
Current depot usage
Displays a summary of depot attributes and usage statistics:
Overall
-
Depot Capacity: Total depot capacity for all nodes in the database, added together.
-
Depot in Use: Total depot space currently in use, on all nodes in the database added together.
-
Database Size: Select Calculate to show the total size of the database, in GB.
-
View More on Database Storage: Click to see the Storage View tab, with details on the storage for this database.
Usage by node
-
Lists the number of bytes in the depot and percentage used, for each node in the database.
-
View More: Click to display depot usage for individual nodes.
Depot configuration
Provides information about how the depot is configured:
-
Participating Nodes: Number of nodes covered by these statistics.
-
Max Depot Limit: Total amount of depot space on all participating nodes.
-
Depot for Writes: Specifies whether the depot is Enabled or Disabled for write operations.
-
Depot for Reads: Specifies whether the depot is Enabled or Disabled for read operations.
-
Depot Operations for Query: Displays how system parameter DepotOperationsForQuery is set. This parameter specifies behavior when the depot does not contain queried file data, one of the following:
-
ALL (default): Fetch file data from communal storage, if necessary displace existing files by evicting them from the depot.
-
FETCHES: Fetch file data from communal storage only if space is available; otherwise, read the queried data directly from communal storage.
-
NONE: Do not fetch file data to the depot, read the queried data directly from communal storage.
-
A link for querying internal DC tables, to obtain retention limits on depot activity such as Depot Reads.
User queries depot hits and misses
For optimal performance, the majority of queries should access data that is locally stored on the depot. To maximize depot access, make sure that your depot is large enough to accommodate frequently accessed data. Otherwise, Vertica must access communal storage more often to retrieve required data, which can significantly affect query performance.
User Queries Depot Hits and Misses helps you evaluate how queries have interacted with the depot over time.
-
Color-coded graph lines show how many queries were accessing the depot or communal storage, or both, at any given time.
-
The left y-axis indicates the number of queries.
Depot fetches and evictions
When a query fetches data from communal storage to a depot that lacks enough space for the new data, Vertica attempts to evict older data. The User Queries Depot Hits and Misses chart can help you monitor churn—that is, how many files are evicted from the depot, and how often:
-
Colored bars show the moments of depot fetches and evictions, as measured in megabytes.
-
The right y-axis shows how much data was fetched or evicted.
If you observe that queries are consistently slower due to accessing communal storage, and notice the depot keeps experiencing frequent churn, it's likely that you need to increase depot size.
Depot query details
-
Hover over a point on the query line to see details about the number of queries that ran.
-
Hover over a Fetches or Evictions bar graph to see details about the number of bytes fetched or evicted.
-
Click the line or bar to view the Query Details page, which provides information about every query that ran in the selected timespan.
The following example shows a depot size sufficient to run all queries in the depot:
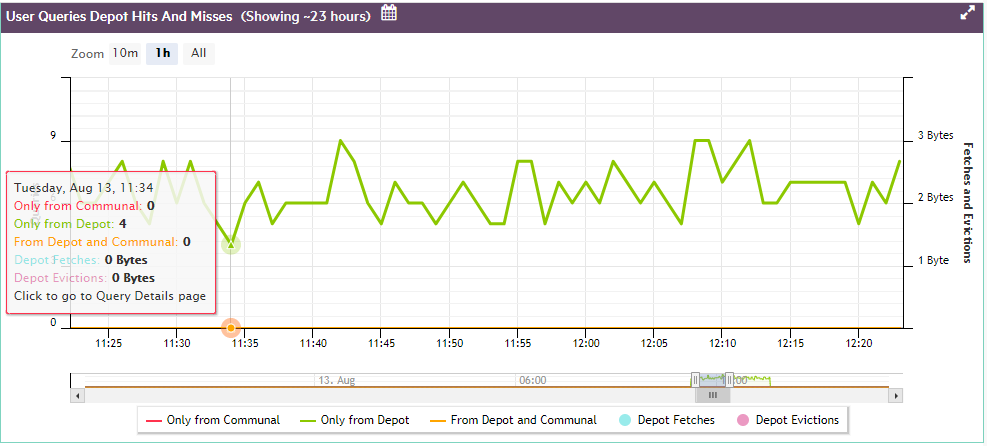
The next example shows what happens when the depot is too small for ongoing query activity, so a number of queries are forced to fetch their data from communal storage.
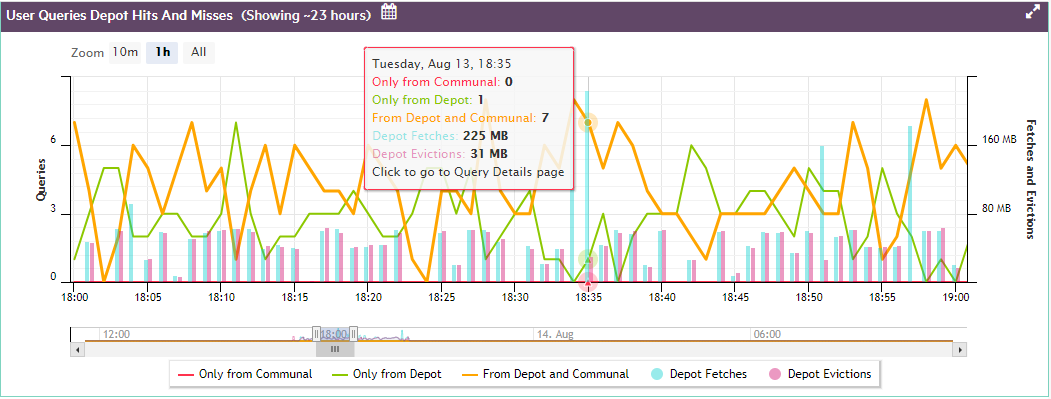
If you click on any point on the line, MC opens a Query Detail window that shows:
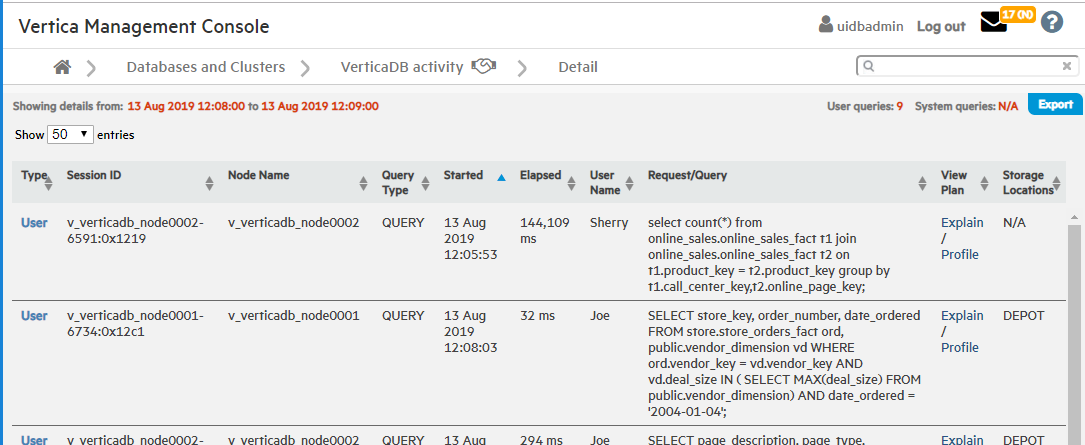
Communal storage access calls
Shows how many communal storage access calls (for example, AWS S3 API calls) of each type your database has executed over a given time span, one of the following:
Hover over any point on the Communal Storage Access Calls chart, to view a summary of data about that point. For example, if your cluster is on AWS, the summary lists how many of each AWS S3 API call type were executed in the selected timespan.
Click on any point on the bar graph to view details on:
For example:
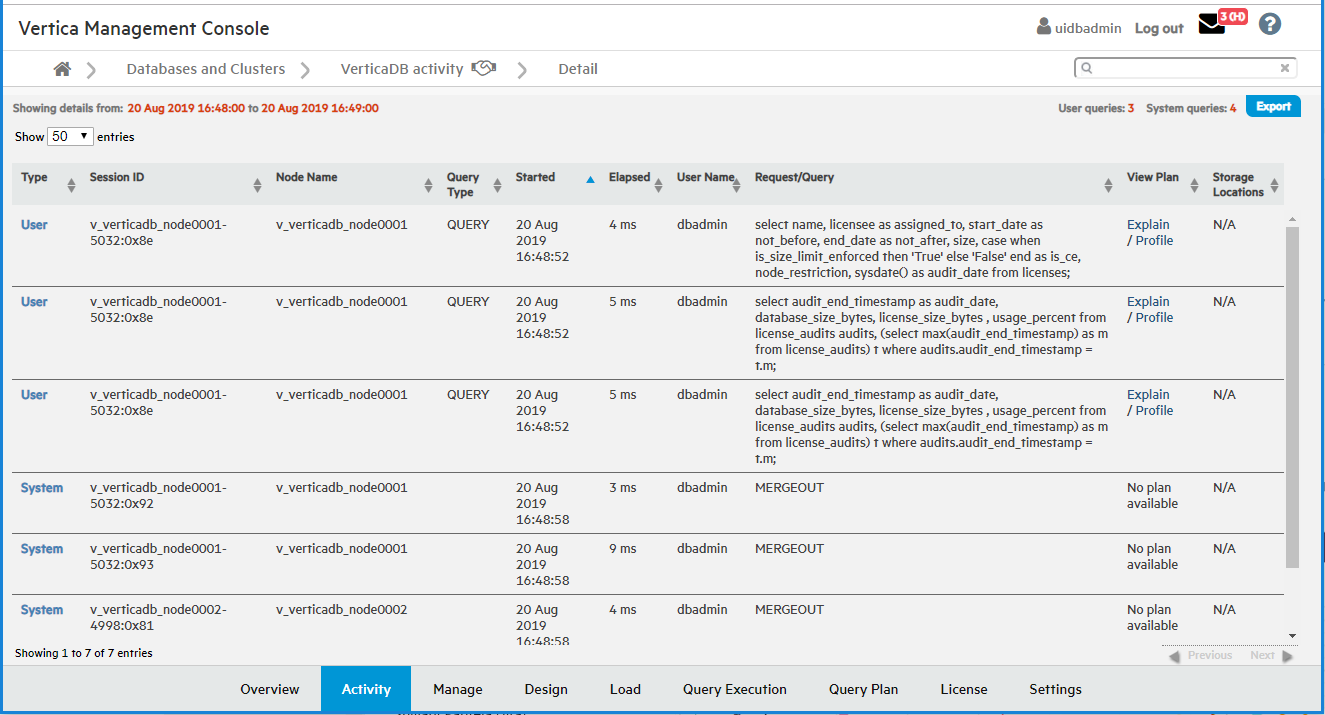
8.14.3 - Viewing depot efficiency
The Depot Efficiency tab provides several graphics that can help users quickly determine whether the depot is properly tuned.
The Depot Efficiency tab provides several graphics that can help users quickly determine whether the depot is properly tuned.
File reads by location
Shows the percentage of reads from depot and communal storage over the specified time span. In general, you want the majority of queries and other read operations to obtain their data from the depot rather than communal storage, as verified by the chart below.If communal storage shows a large percentage of file reads, it's likely that you need to increase the depot size.
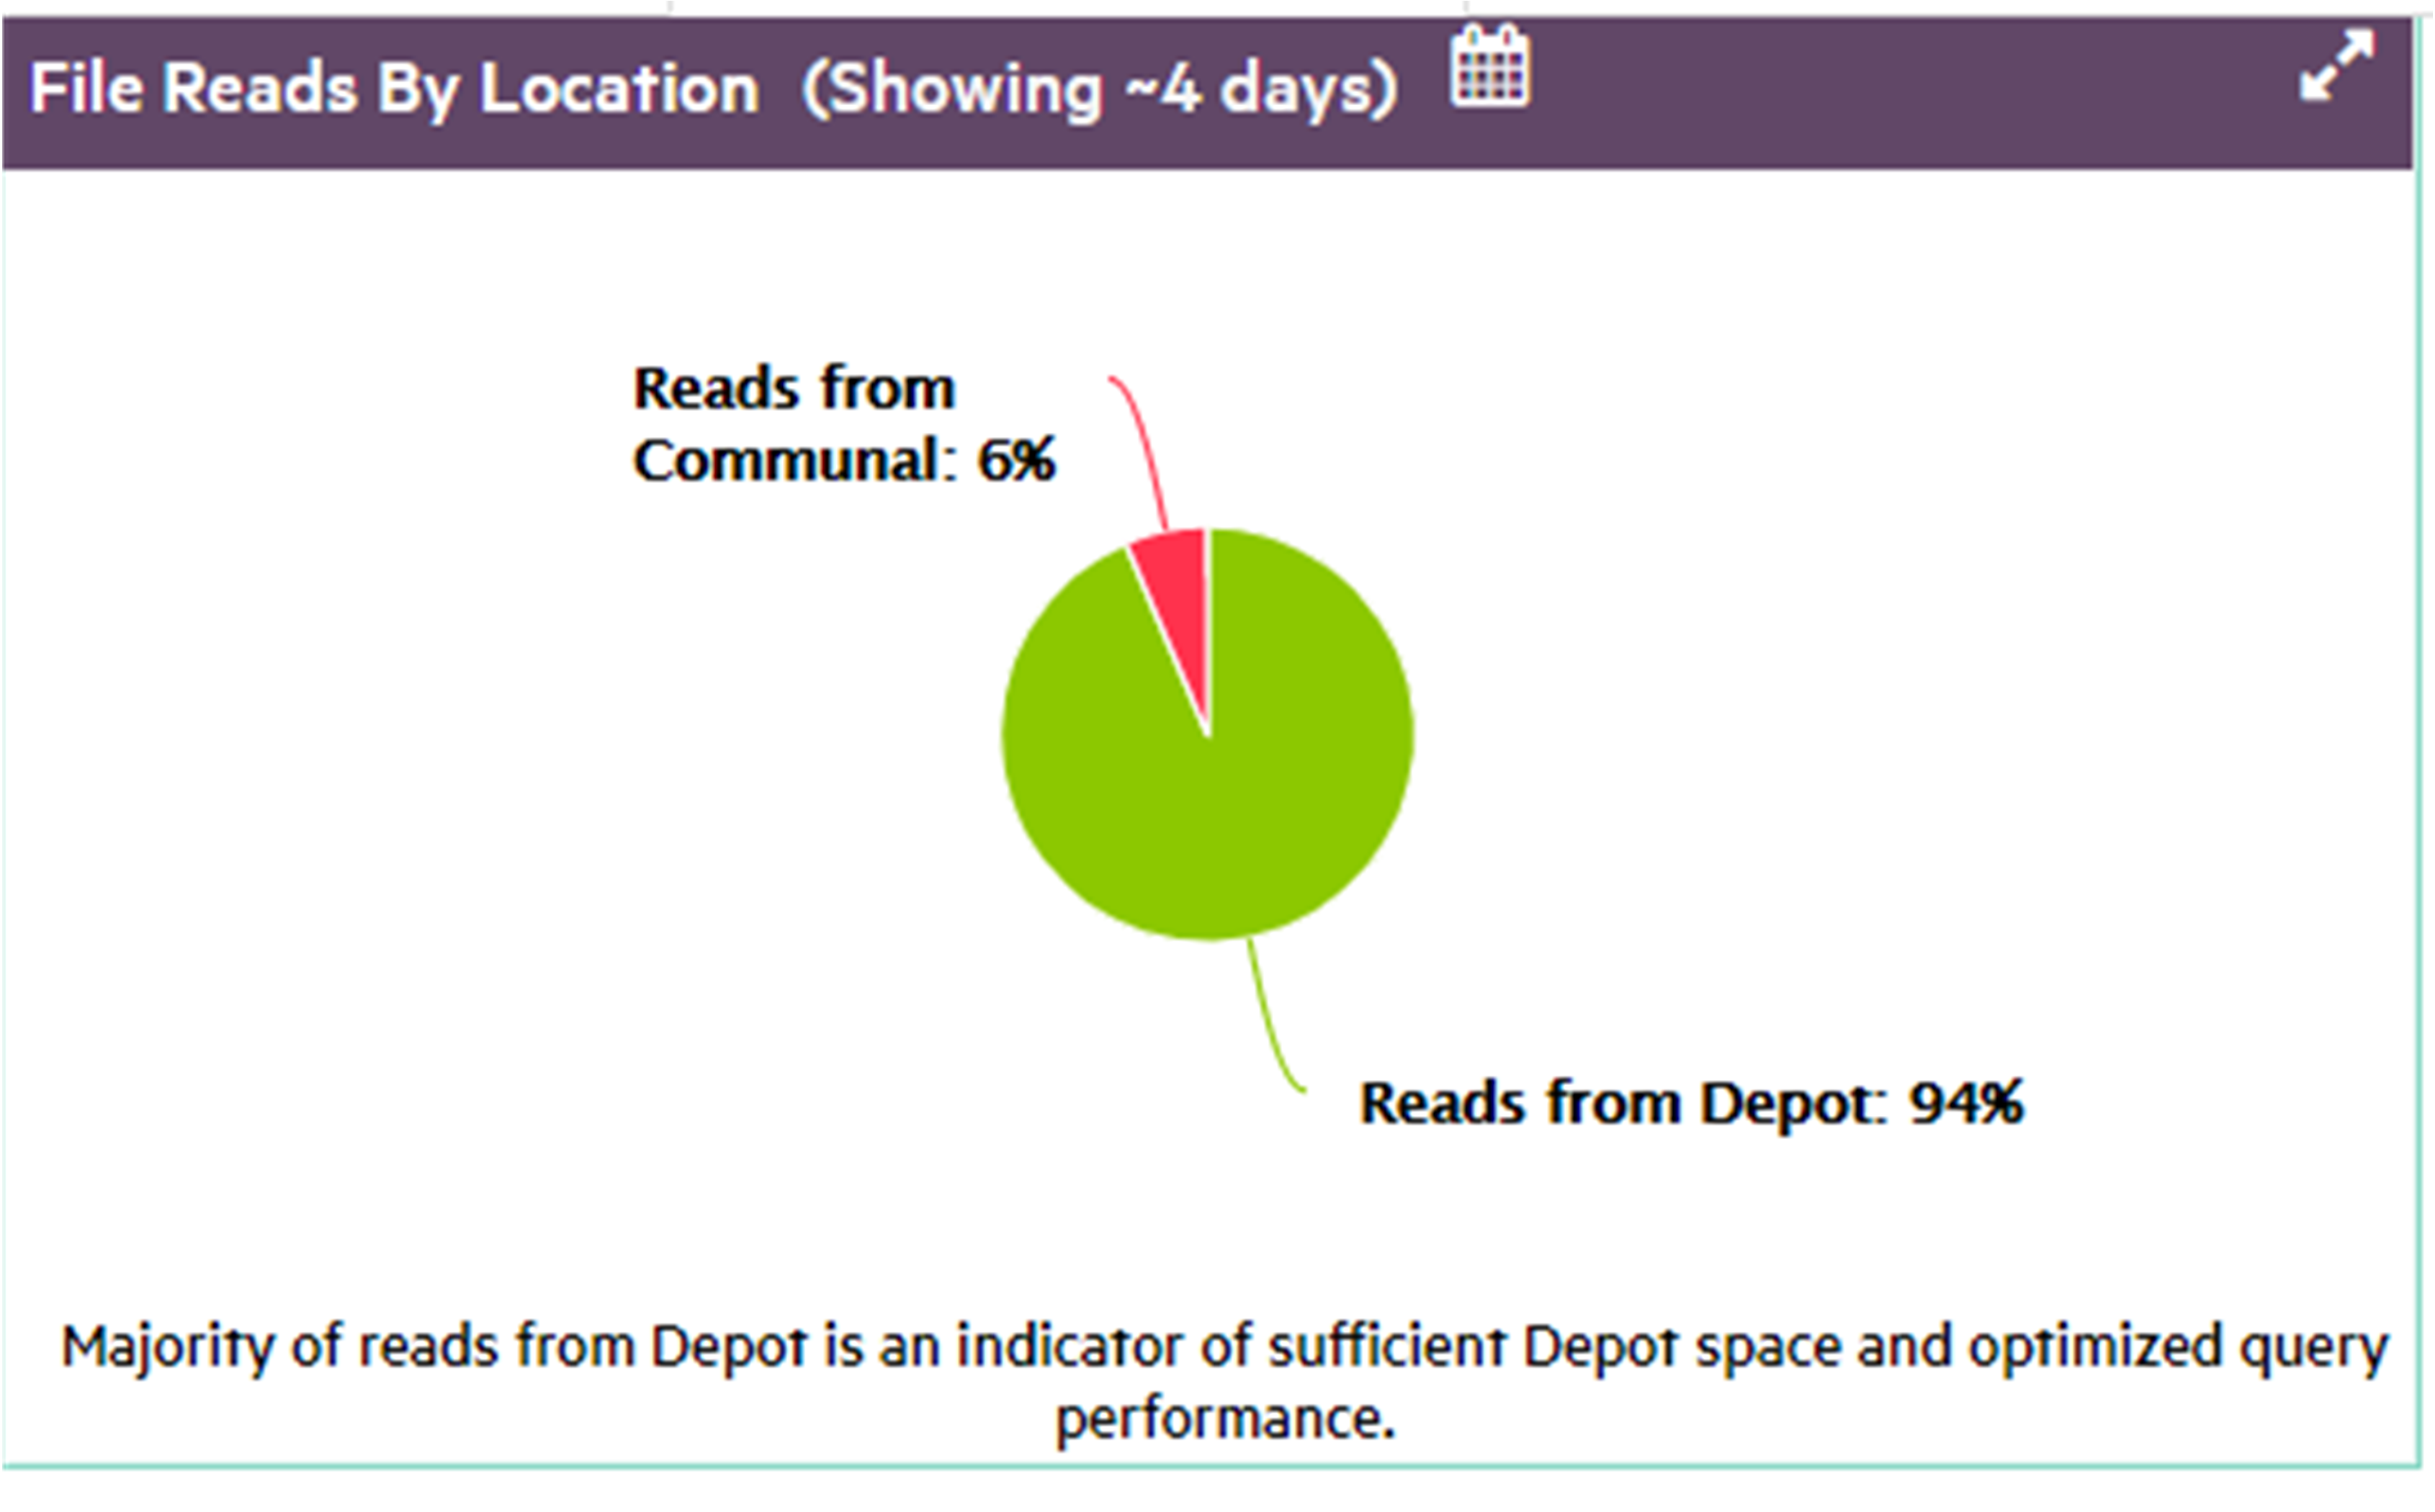
Top 10 re-fetches in depot
Vertica evicts data from the depot as needed to provide room for new data, and expedite request processing. Depot fetches and evictions are expected in a busy database. However, you generally want to avoid repeated evictions and fetches of the same table data. If this happens, consider increasing the depot size, or pinning the table or frequently accessed partitions to the depot.
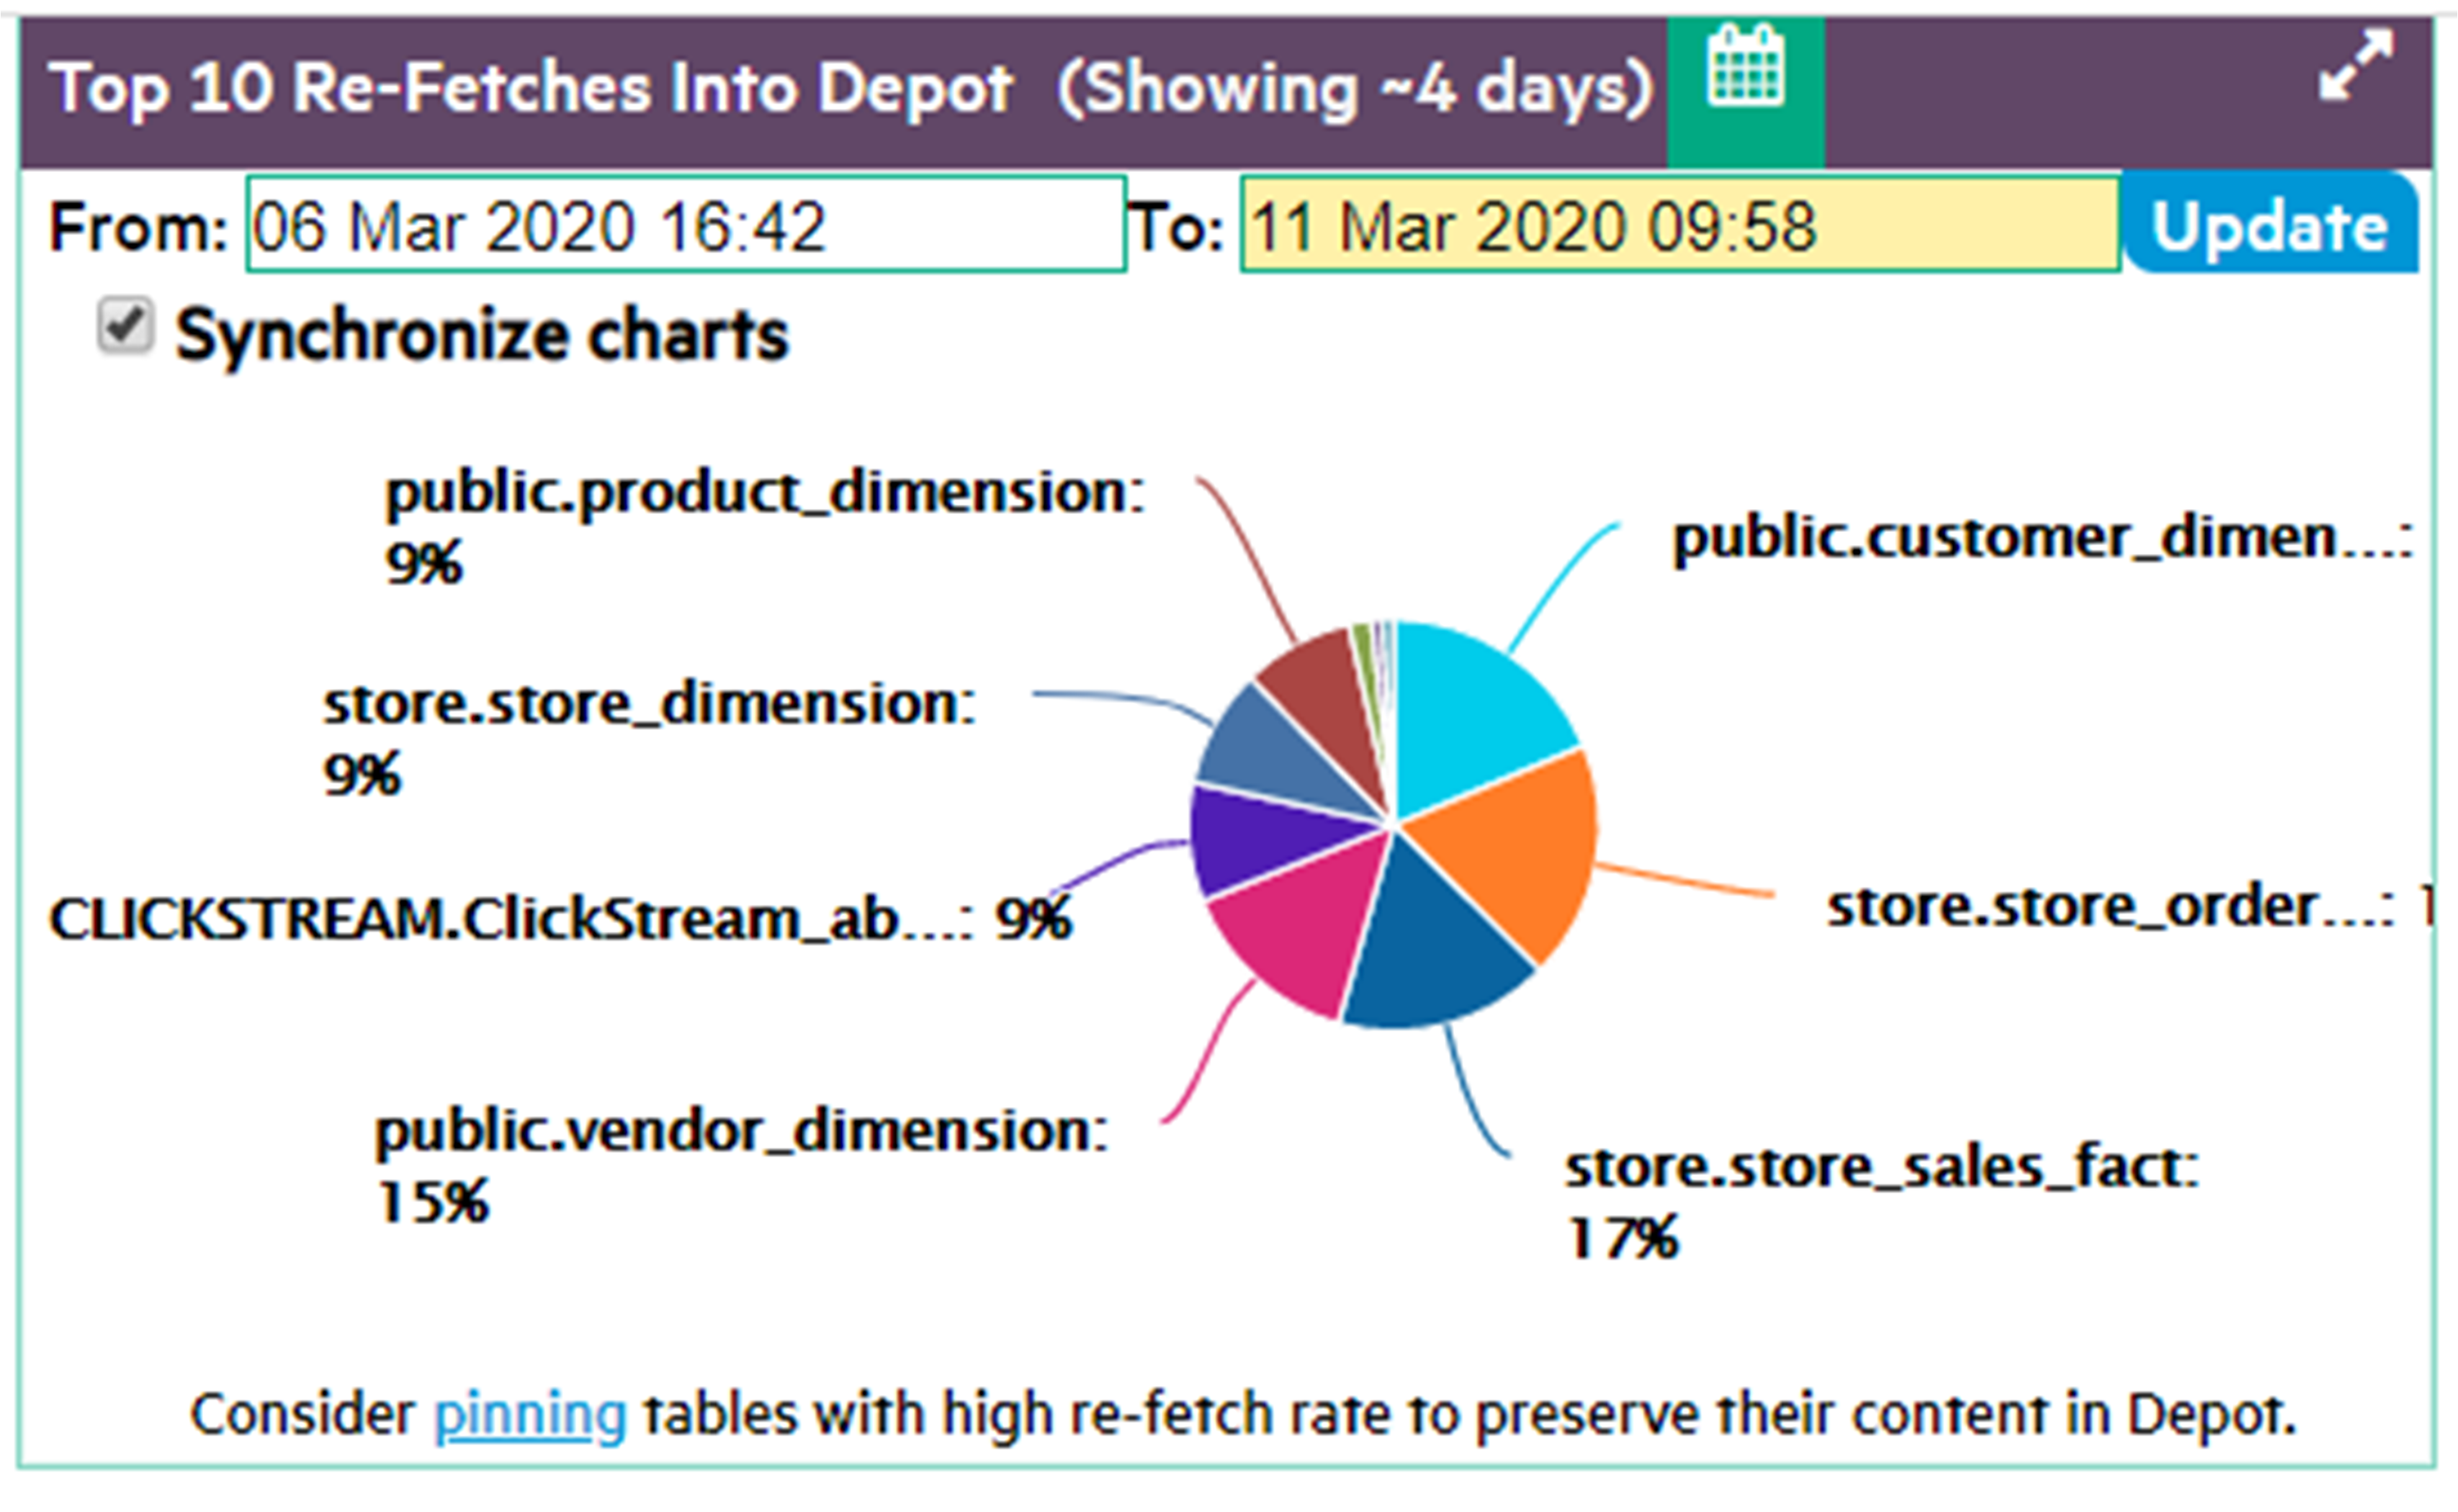
Depot pinning
It's often advisable to pin a table or table partitions whose data is frequently queried. Doing so reduces their exposure to eviction from the depot. However, you should also be careful not to use up too much depot storage with pinned data. If too much depot space is claimed by pinned objects (as shown below), the depot might be unable to handle load operations on unpinned objects.
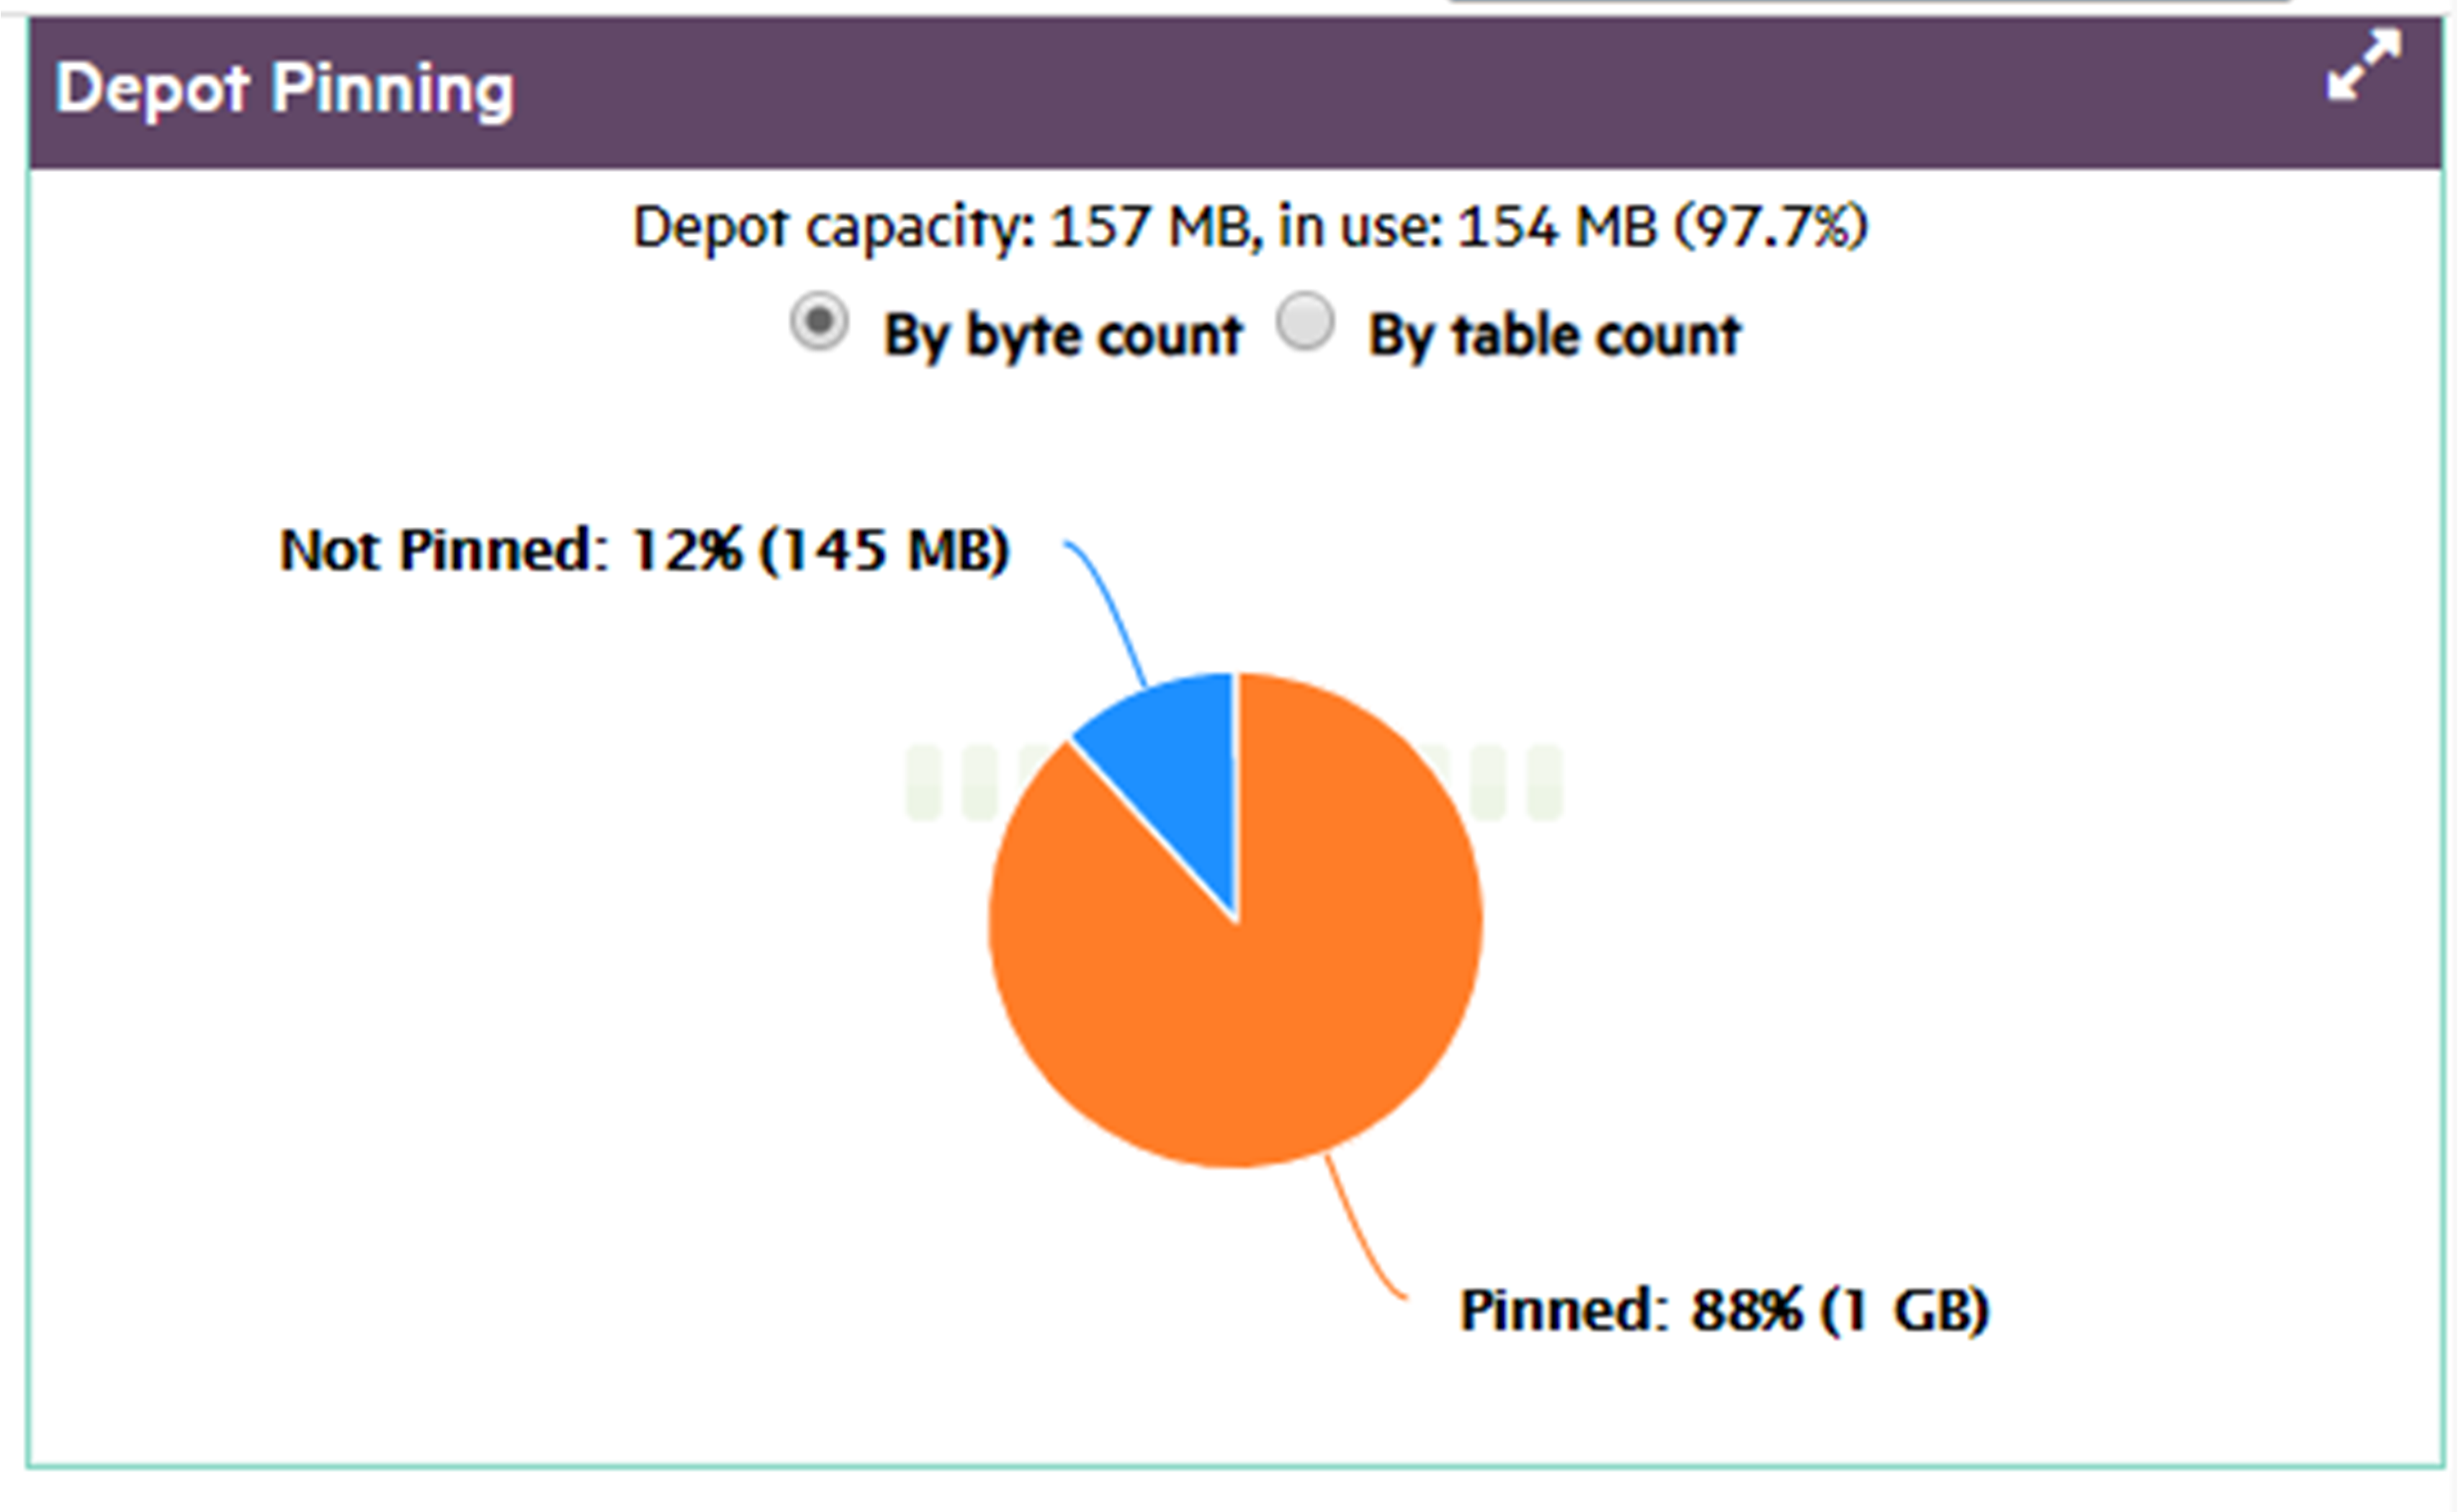
Number of tables in depot by age
Tables should typically reside in the depot for as long as their data are required. A short average lifespan of table residency might indicate frequent depot eviction, which can adversely impact overall performance. If this happens, consider increasing the depot size, or pinning frequently accessed table data.
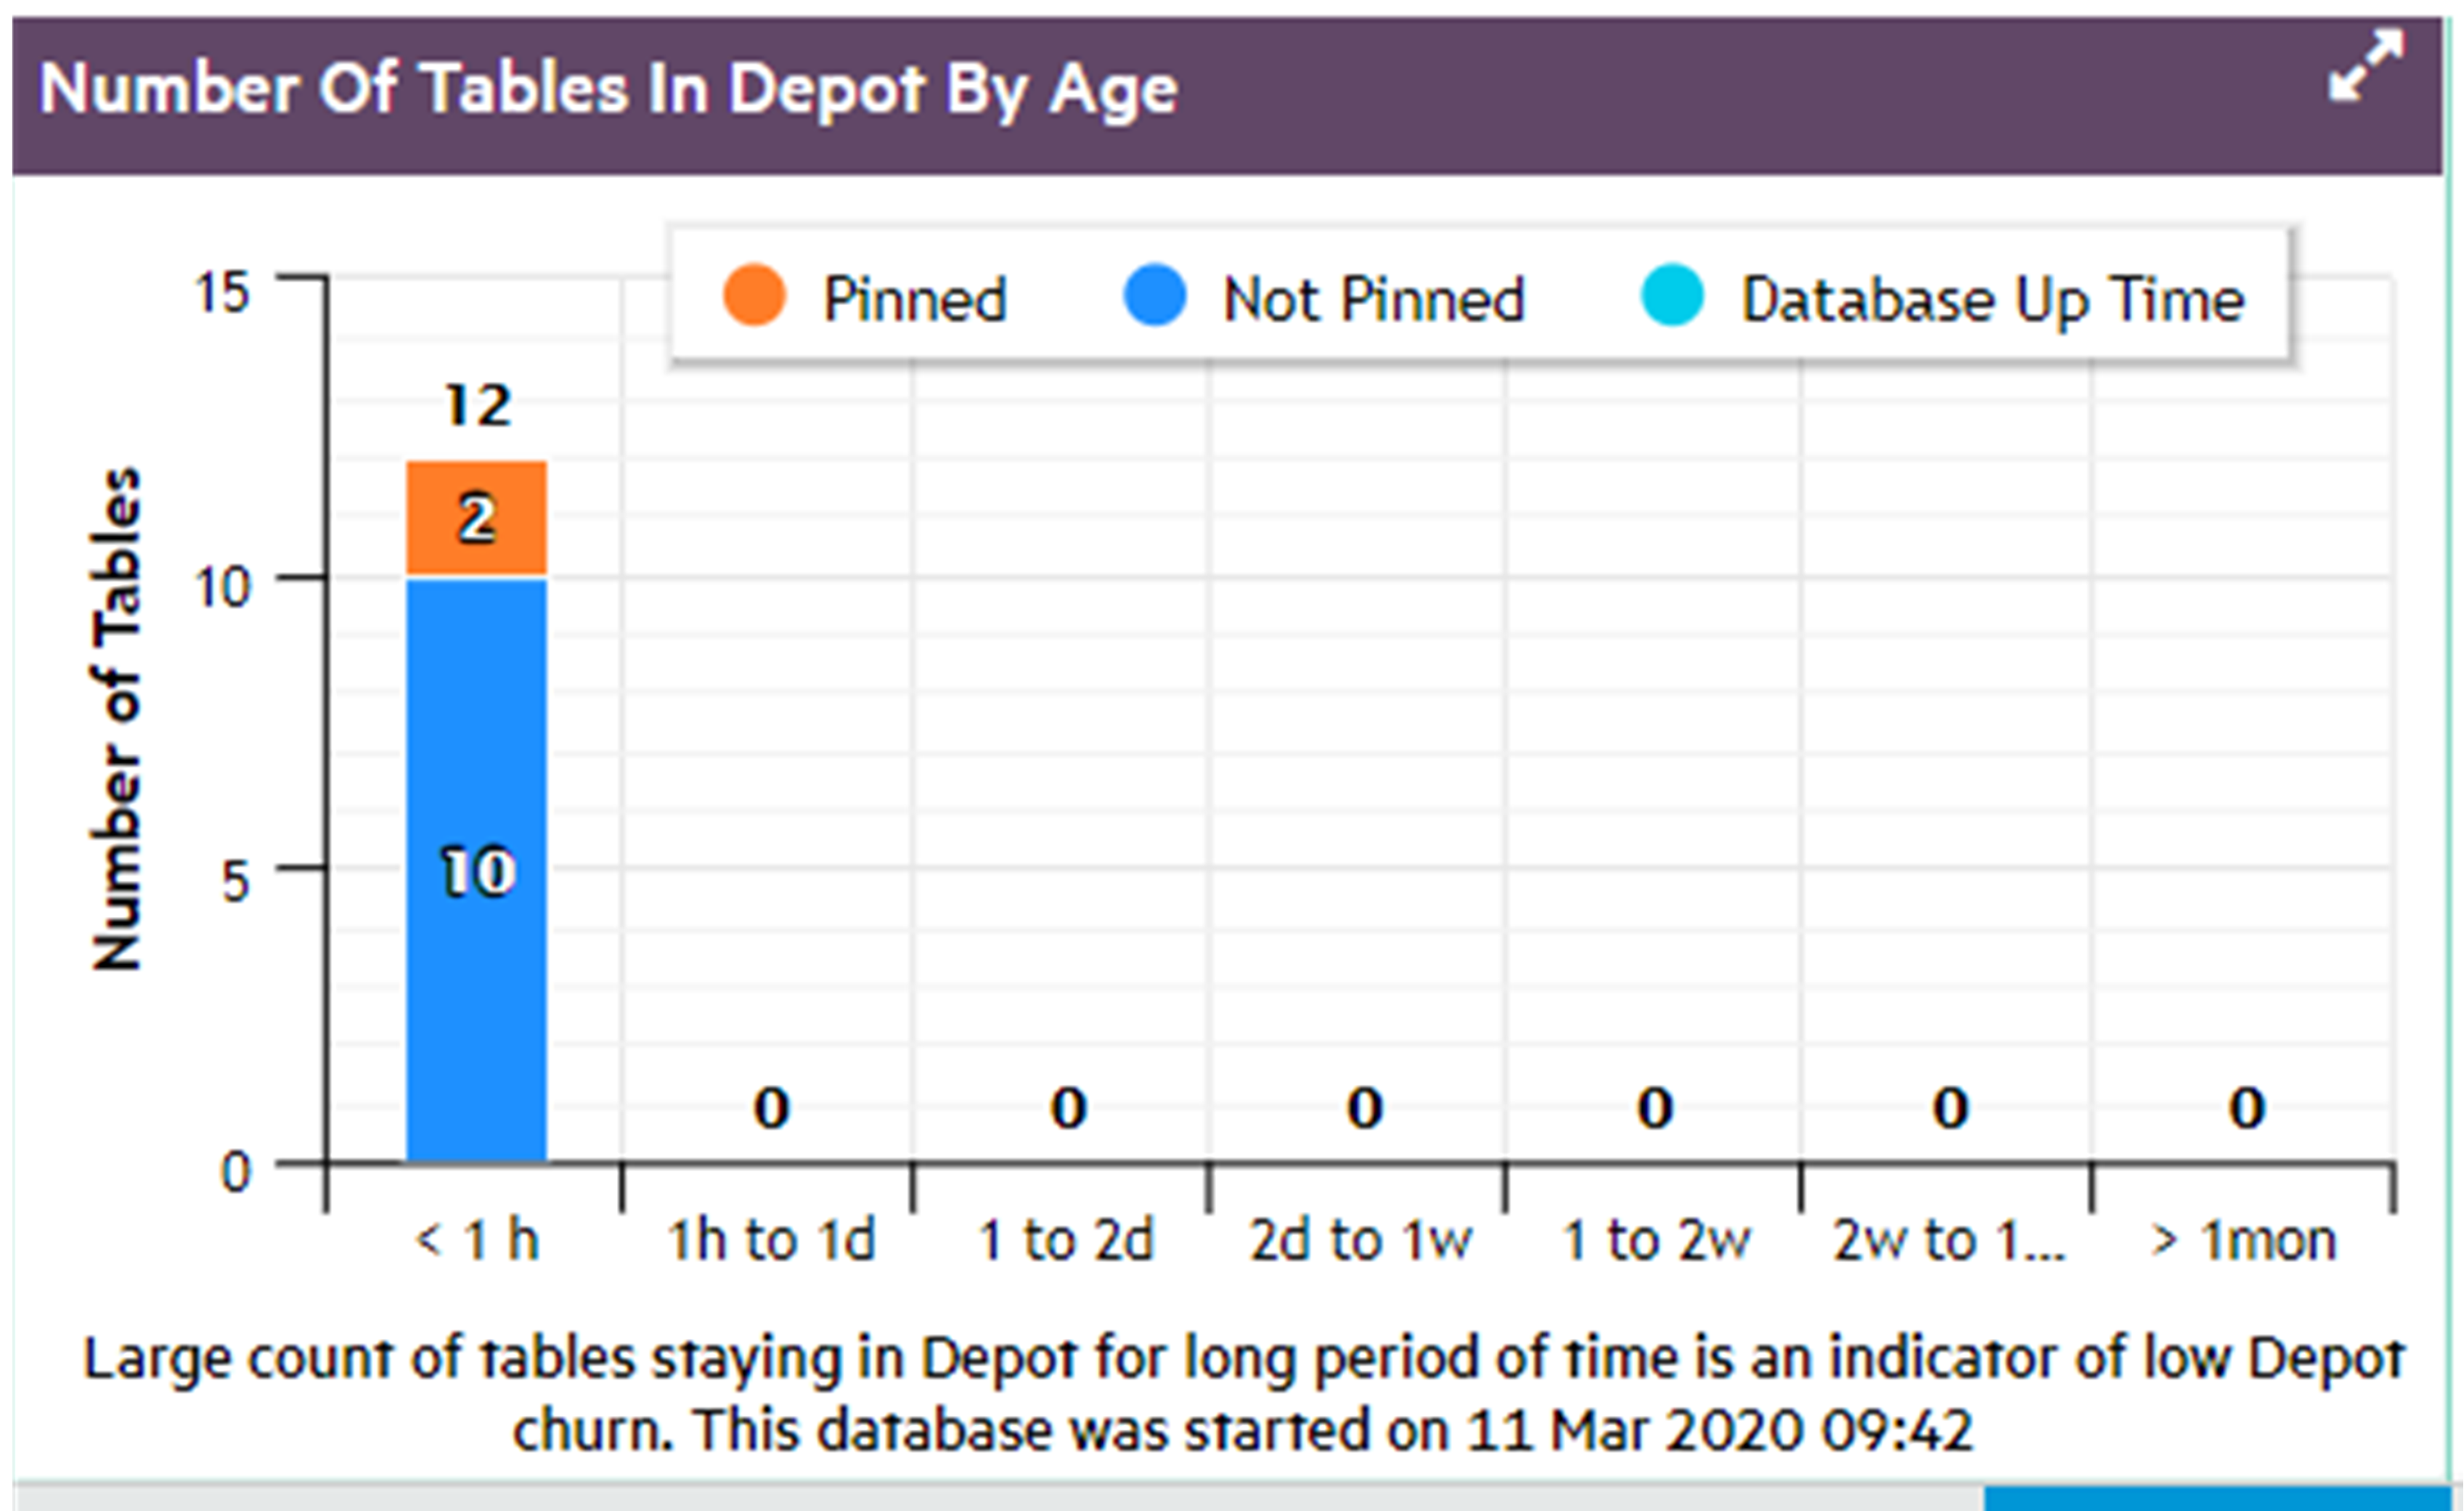
Number of tables in depot by access count
In general, the depot should largely be populated by tables that are frequently accessed, both pinned and unpinned.
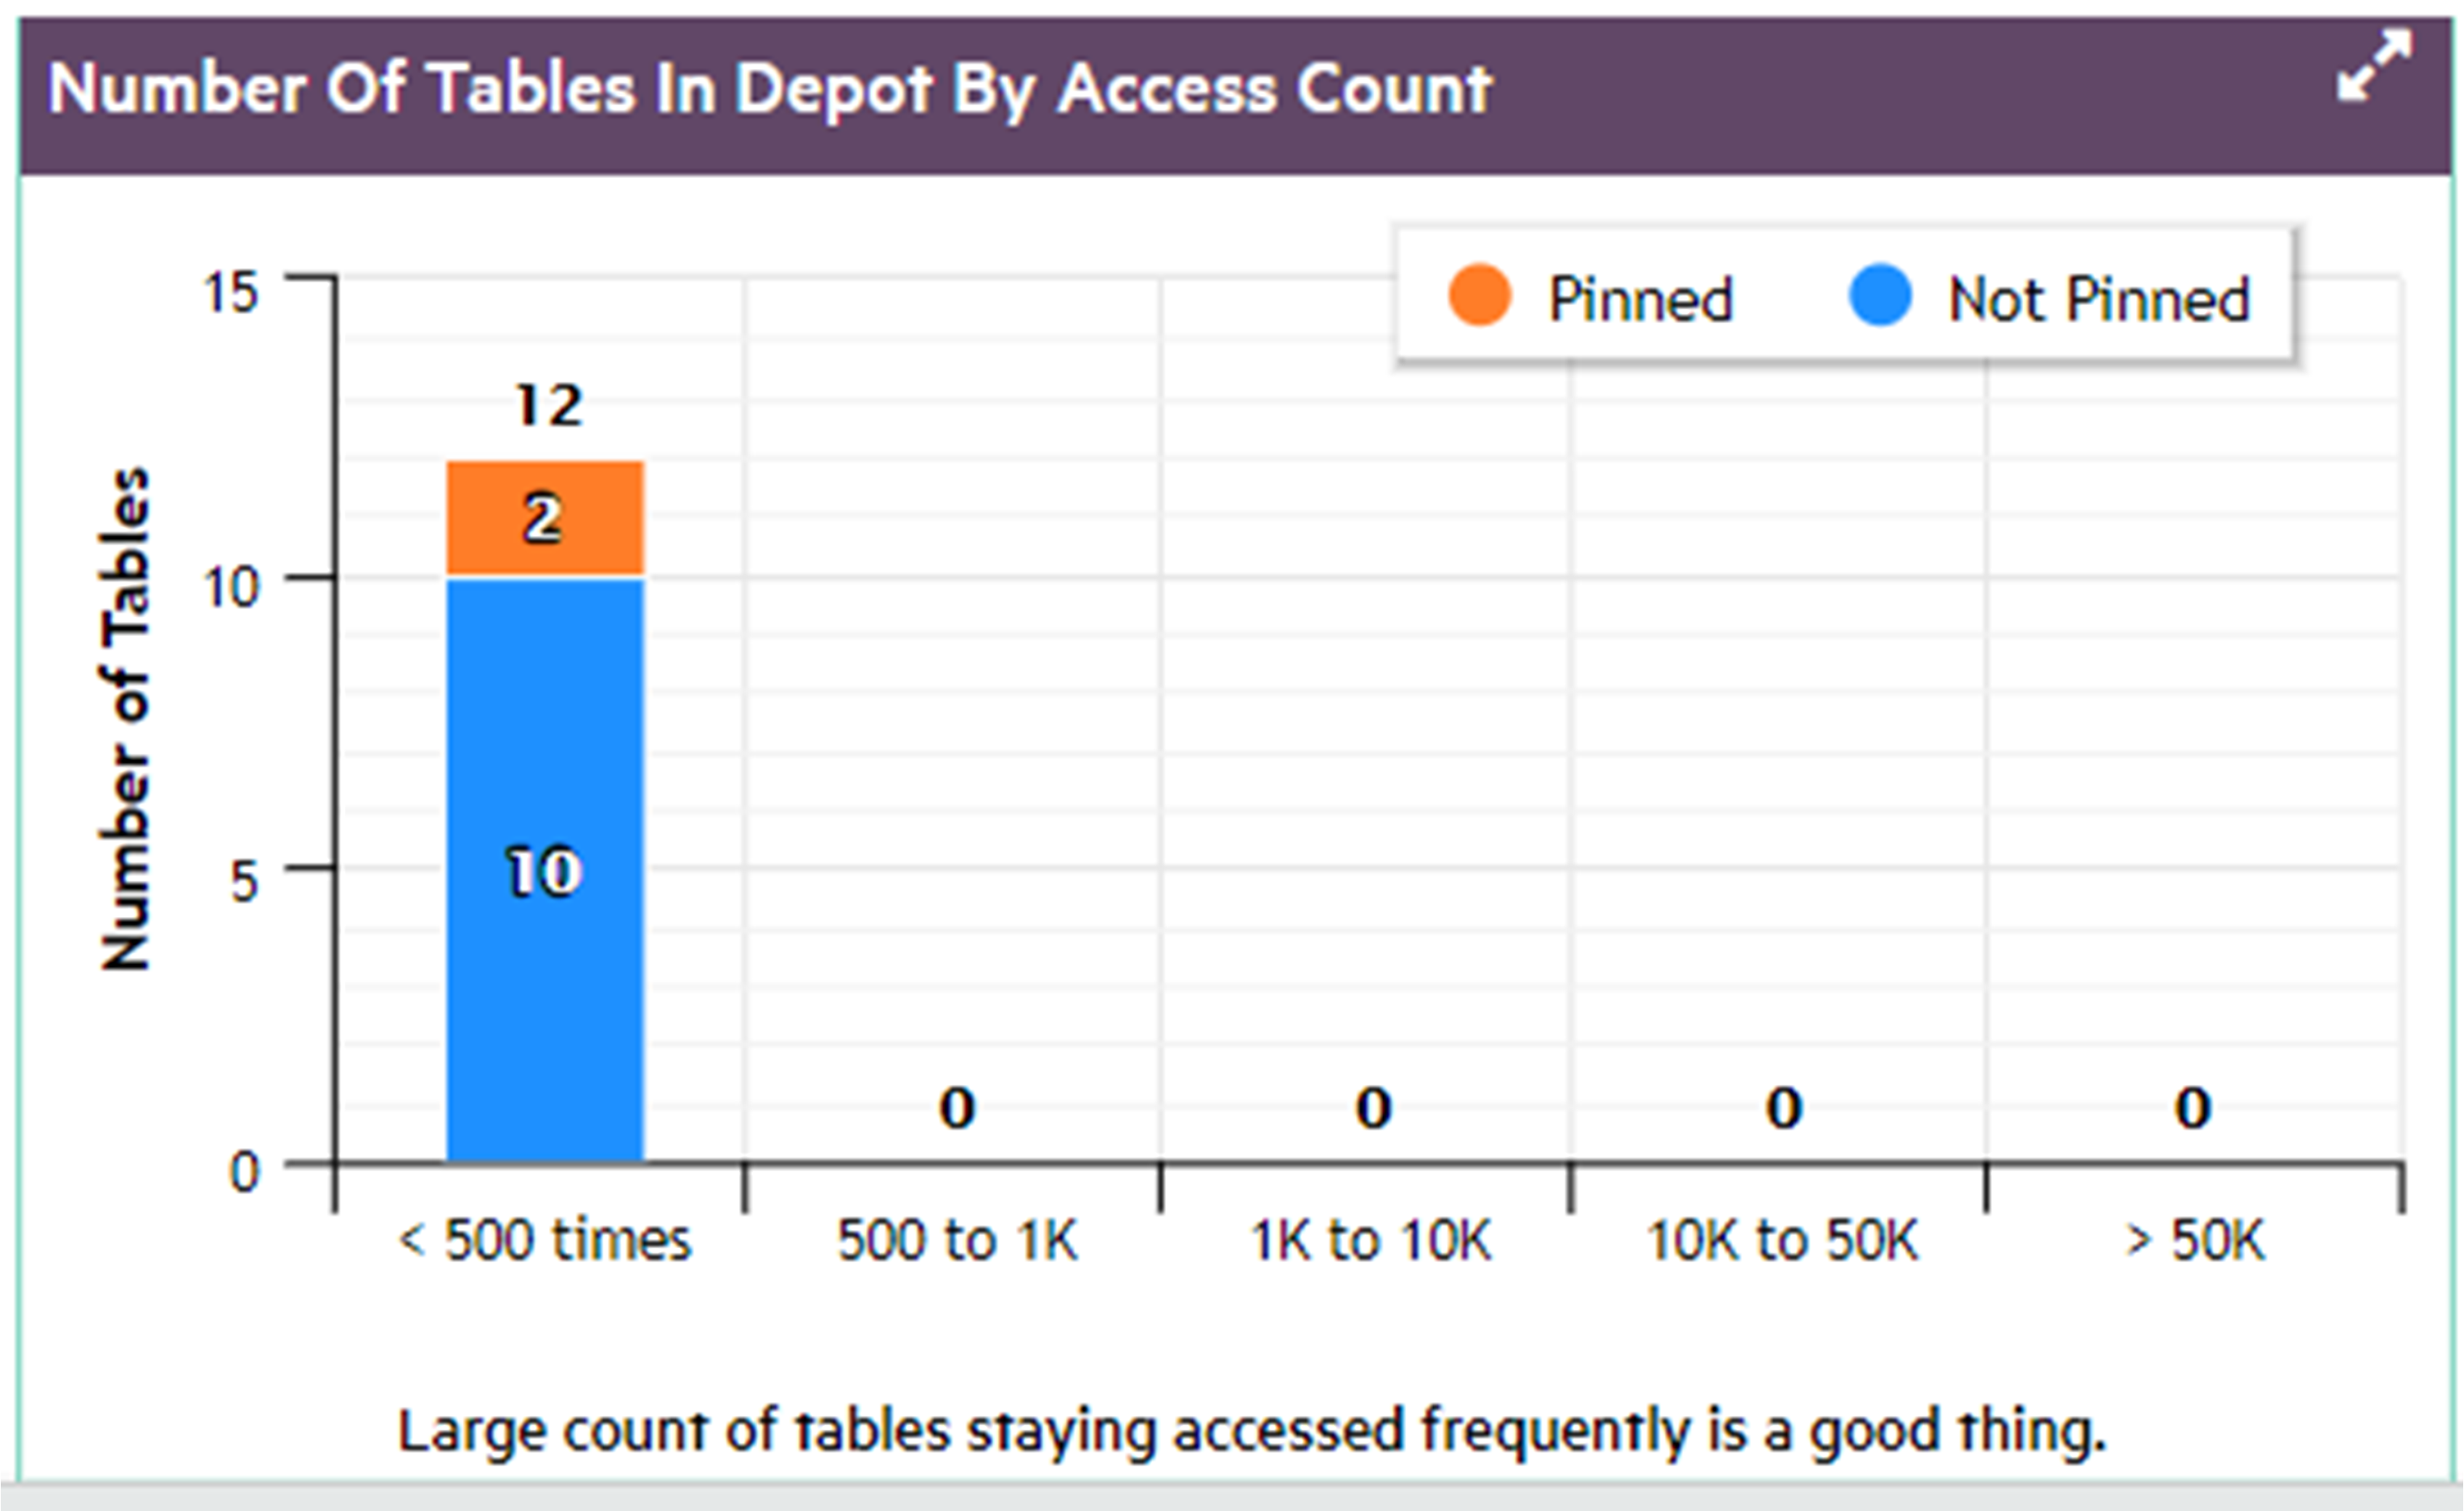
Number of tables in depot by size
It can be helpful to know the distribution of table sizes in the depot.
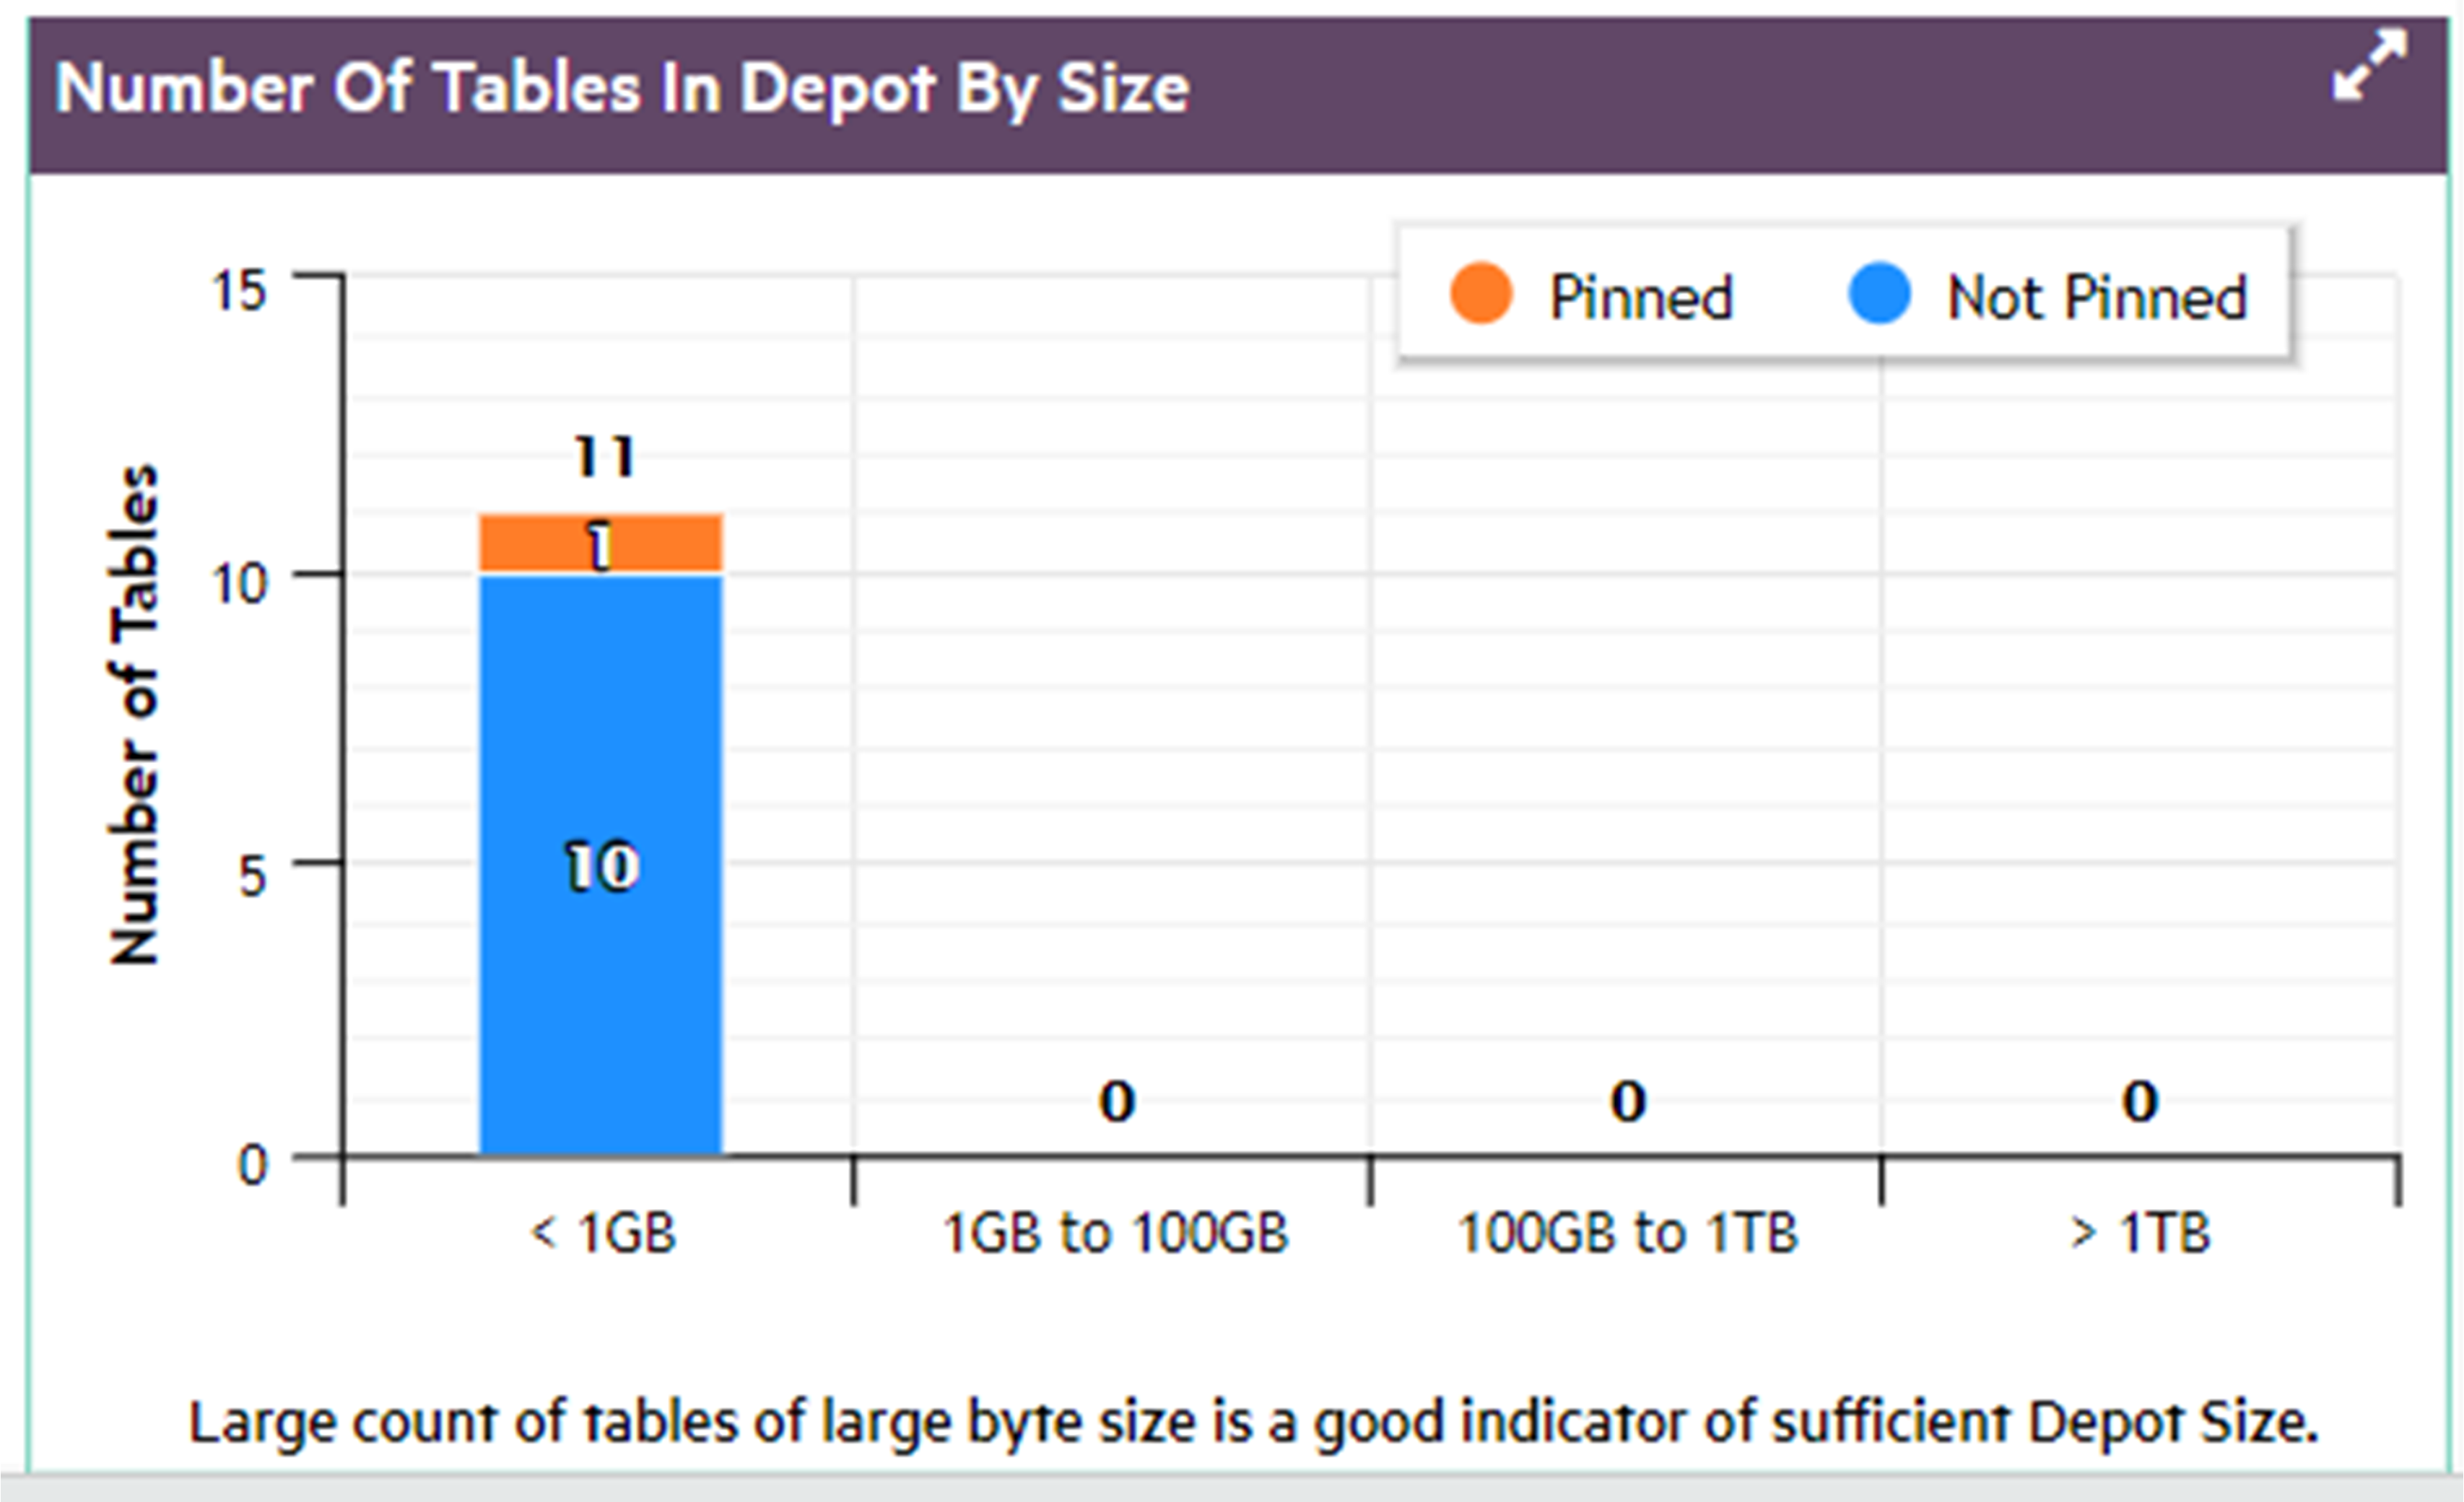
8.14.4 - Viewing depot content in MC
You can view in detail how the nodes in your Eon database are using the depot:.
You can view in detail how the nodes in your Eon database are using the depot:
-
Display a list of tables with the largest amount of data in the depot.
-
Use the filter fields to list the tables most frequently or most recently accessed in the depot.
-
Display details about how frequently the projections and partitions for a specific table access the depot, and the last time the depot was accessed.
The Depot Activity Monitoring > Depot Content tab opens showing a default list of the top 25 tables in the database, as ranked by each table's total bytes in the depot. The list shows all the nodes for each of those top tables. The nodes are sorted solely based on most bytes in depot, so the nodes for a given table do not necessarily appear together.
Filter the list
You can use the filter fields above the table to focus the list more narrowly. The filters let you select:
-
The number of top tables
-
Whether the tables are selected by most bytes in depot, the highest number of times their depot was accessed, or the most recent last access time
-
Tables in all schemas, or only in a specific schema
-
All tables, or only a specific table
-
All nodes, or only a specific node
In the Schema, Table, and Node filter fields, you can enter a text string to select all items whose names include that text string.
Select a node to see the breakdown of depot data in projections and partitions
Select a row in the top table. MC then loads the details to show how that table's depot content is distributed across the projections and the partitions for that table, that are on that node. The Projection and Partition panes show these details for the selected node:
-
Projection: Number of bytes of data for the selected table that each projection has in the depot on the selected node.
-
Partition: If the table is partitioned, this pane shows the number of bytes of data for the selected table that each partition has in the depot on the selected node.
For each projection and each partition, MC also displays the total number of times, that the projection or partition has accessed the depot on that node, and the last access time.
For more information about projections, see Projections.
For more information about partitions, see Partitioning tables.
Steps to monitor depot content
-
From the MC home page, open a database, select the Activity tab from the bottom menu, select Depot Activity Monitoring in the top selection box, and select the Depot Content tab. MC displays the top N tables (25 by default), ranked by the number of bytes of data each table has in the depot on all its nodes.
-
To narrow the list, use the filters at the top of the tab. You can show only the nodes in a certain schema and/or database, or display all the activity on a specific subgroup of nodes. Change the filters, then click Apply.
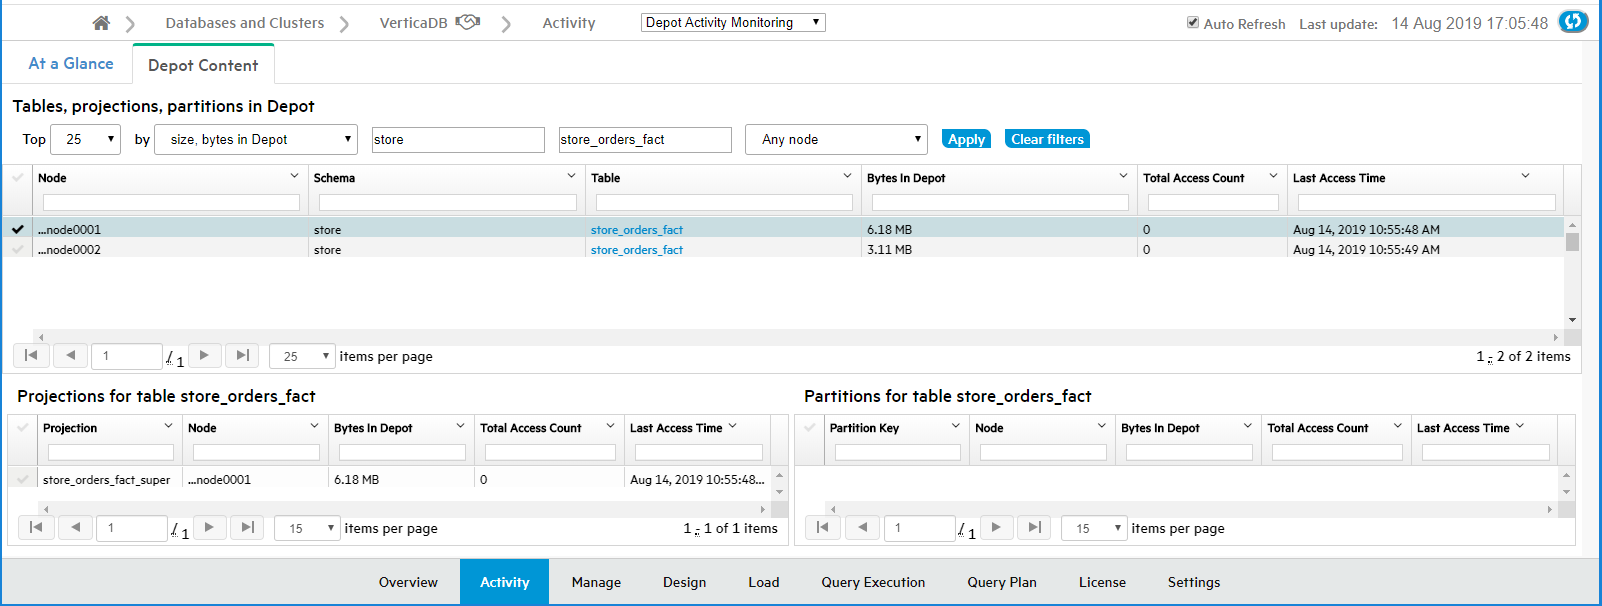
-
To select all items whose names contain a certain text string, enter that text string in a filter field. This example selects the nodes for the tables whose names contain the string "fact".
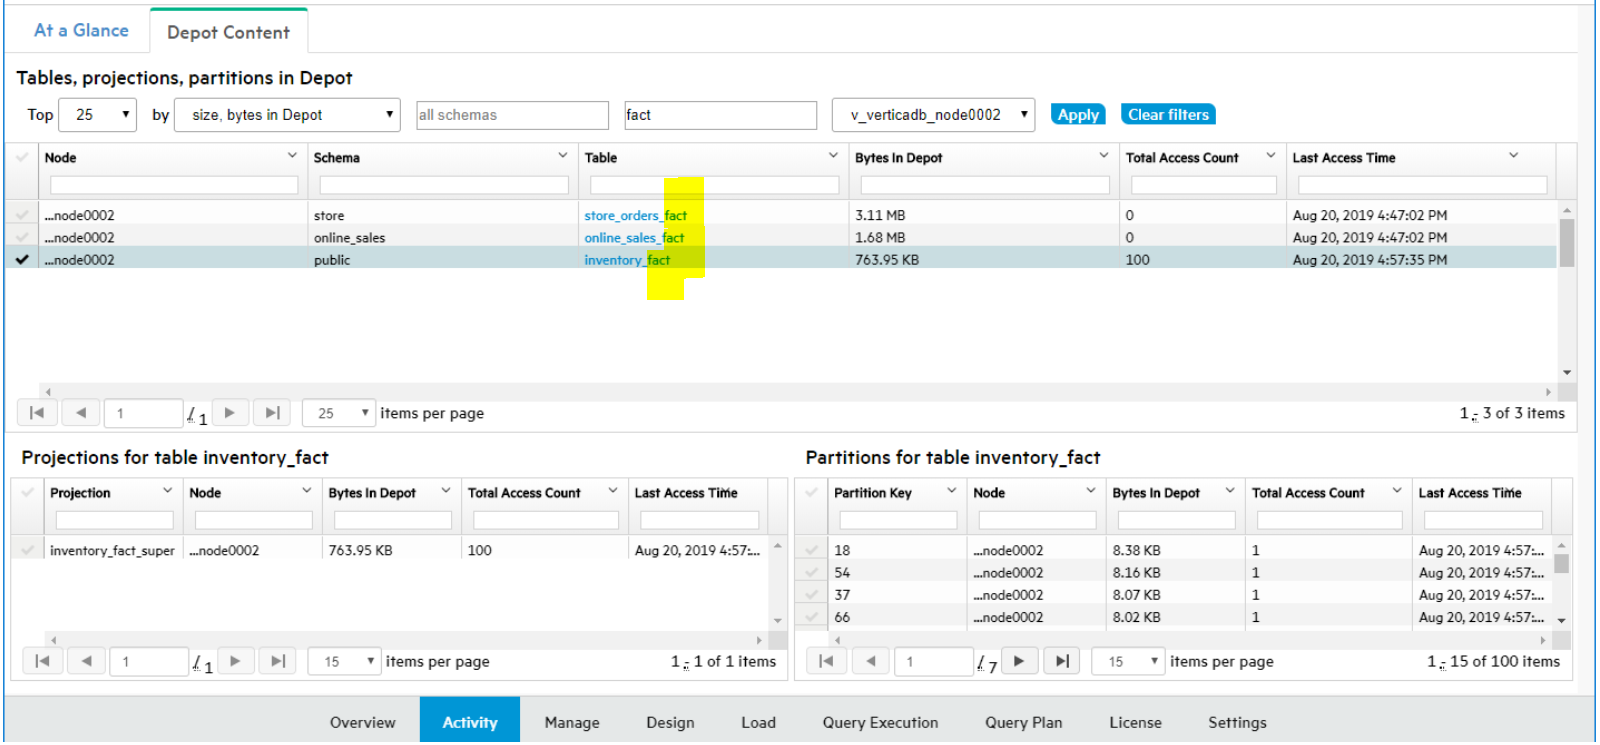
-
To display details on the projections and partitions for a specific table that are accessing the depot, select a row in the top pane of the Depot Content tab.
See also
Monitoring depot activity with MC
8.14.5 - Managing depot pinning policies
Vertica evicts data from depots as needed to provide room for new data, and expedite request processing.
Vertica evicts data from depots as needed to provide room for new data, and expedite request processing. You can pin database objects to reduce the risk of depot eviction. Two object types can be pinned: tables and table partitions.
The Depot Pinning tab lets you perform the following tasks:
For details on pinning policies, see Managing depot caching.
Listing pinning policies
To list existing depot pinning policies:
-
Select Display Existing Pinning Policies.
-
Click Search. Vertica lists all tables that are currently pinned to the depot, under Existing Pinning Policies:
-
If desired, filter and sort the list of policies by setting the following fields:
|
Filter on: |
Set to: |
|
Schema |
Full or partial name of the desired schema |
|
Table |
Full or partial name of the desired table |
|
Policy Type |
Table or Partition |
|
Policy Scope |
Database Level or subcluster name |
|
Partitioned Table |
Y (yes) or N (no) |
|
Sort on: |
In ascending/descending order: |
|
Size in Depot |
Absolute size (in MB) of cached data |
|
% of Depot |
Percentage of depot storage used by the cached data |
|
Total Access Count |
Number of times that cached data from this table has been queried or otherwise accessed |
|
Last Access Time |
Last time cached data of this table or partition was queried or otherwise accessed |
Removing existing policies
You can also use the result set under Existing Pinning Policies to remove one or more policies.
To remove one or more table policies:
- From the policy list, select the check boxes of policies to remove.
Note
Policy Type of all selected policies must be set to Table.
- Click Bulk Remove Table Policies.
To remove a table's partition policies:
-
On the policy to remove, click Modify Policy.
-
In the Modify Pinning Policy dialog, perform one of the following actions:
- Click Remove Policy on the desired policy.
- Select the check boxes of one or more policies, then click Remove Selected Policies.
-
Click Close.
Creating pinning policies
You can create a policy that pins table data to a subcluster depot or to all database depots. You can specify the following policy types:
Find candidates for pinning
-
Select Create or Modify Pinning Policies.
-
Optionally filter the search by specifying a schema and the full or (for wildcard searches) partial name of a table.
-
Click Search.
You can use the filtered data to determine which tables or partitions are good candidates for depot pinning. For example, a high total access count relative to other tables (Total Access Count) might argue in favor of pinning. This can be evaluated against data storage requirements (% of Depot) and age of the cached data. For example, if pinned objects claim too much storage, a depot might be required to:
-
Route large load operations directly to communal storage for processing.
-
Increase frequency of evictions.
-
Increase frequency of fetches from communal storage to handle queries on non-pinned objects.
All these cases can adversely affect overall database performance.
Tip
To minimize contention over depot usage, consider the following guidelines:
-
Pin only those objects that are most active in DML operations and queries.
-
Minimize the size of pinned data by setting policies at the smallest effective level—for example, pin only the data of a table's active partition.
For details on how Vertica handles depot storage and turnover, see Managing depot caching.
Create a table or partition pinning policy
To create a pinning policy for a single table or table partition:
-
Under the Create or Modify Pinning Policies list , find the table to pin.
-
Click Create Policy. The Create a Pinning Policy dialog opens.
-
Select the desired policy scope, one of the following:
- Database
- An available subcluster
-
Select the desired policy type: Table Policy or Partition Policy
Table Policy
Click Create:
Partition Policy
(available only if the table is partitioned)
For example:
-
Click Create.
Vertica displays the new pinning policy:
-
Optionally, add more partition-level policies on the same table by setting new partition keys.
-
When finished, click Close.
Note
If partition pinning policies on the same table specify overlapping key ranges, Vertica collates the partition ranges. For example, if you create two partition policies with key ranges of 1-3 and 2-4, Vertica creates a single pinning policy with a key range of 1-4.
Create pinning policies on multiple tables
To create a pinning policy on multiple tables:
-
On Create or Modify Pinning Policies, select the check boxes of the tables to pin.
Note
All checked tables must be unassigned to a pinning policy, as indicated by their Create Policy link.
-
Click Bulk Create Table Policies. The Bulk Create Table Policies dialog opens.
-
Select the desired policy scope, one of the following:
- Database
- subcluster (choose the desired subcluster)
-
Click Create, then click Close.
Removing a pinning policy
To remove an existing pinning policy:
-
On Create or Modify Pinning Policies, find the table with the policy to remove.
-
Click Modify Policy.
-
In the Modify Pinning Policy dialog, perform one of the following actions:
- Click Remove Policy on the policy to remove.
- Select the check boxes of one or more policies, then click Remove Selected Policies.
-
Click Close.
Remove pinning policies from multiple tables
To bulk-remove pinning policies from one or more tables:
-
On Create or Modify Pinning Policies, select the target table check boxes.
Note
All checked tables must comply with the following requirements:
-
Click Bulk Remove Table Policies. The Bulk Remove Table Policies dialog opens.
-
Click Remove, then click Close.
Viewing frequently fetched tables
You can query the depot for tables that are most frequently fetched from communal storage. This can help you quickly identify potential candidates for depot pinning:
-
Select Top num Refetched Tables(s) from Depot.
-
Specify the maximum number of results to return (by default 10), and the range of dates to query.
From the list, you can perform the following tasks:
8.15 - Monitoring depot storage with MC
To display detailed storage monitoring information for your Eon database:.
To display detailed storage monitoring information for your Eon database:
-
From the MC home page, select View Your Infrastructure.
-
On the Infrastructure page, select the Storage View tab.MC displays the Storage View screen, with details about the database storage and links to further detail screens:
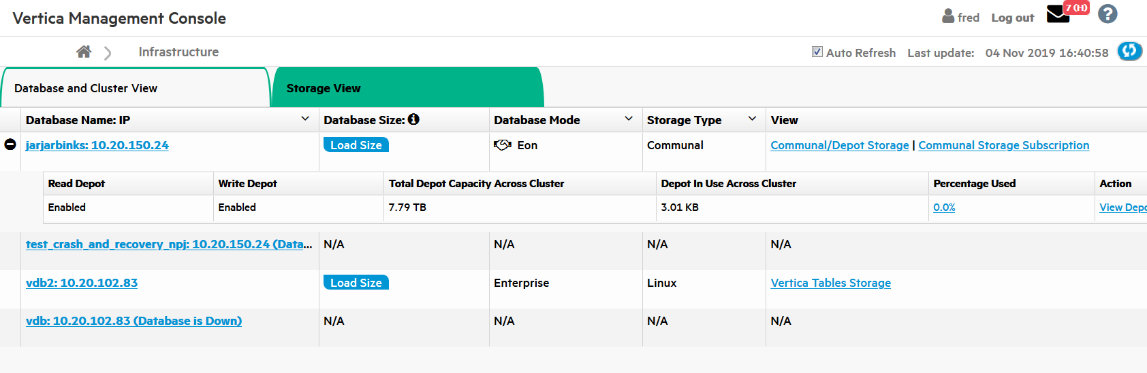
-
To see the loaded size of the database, click Load Size.
-
To see communal storage details for the database, such as its location and size, and the IP addresses of the nodes, click Communal/Depot Storage.
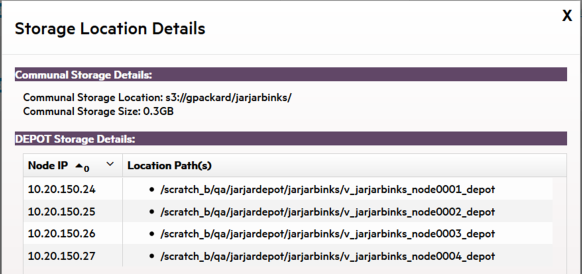
-
To view the shard subscriptions for your Eon nodes, click Communal Storage Subscription. MC displays the shard type, how many nodes are subscribed to each shard, and the status of each shard subscription (Active, Inactive, Passive, Pending, Removing).
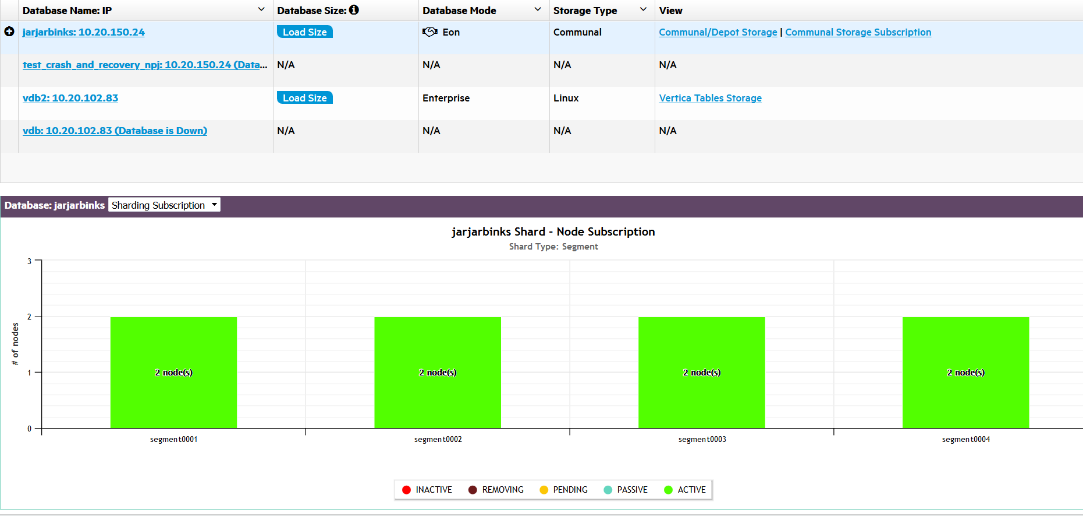
There are two views:
Hover over a bar to display the details.
-
To display the depot details for all nodes in the database, click View Depot Details by Nodes. MC lists the nodes by node name, and for each node shows the number of bytes the node has in its depot, the total capacity of the depot, the percent used, and the path to the node's depot.
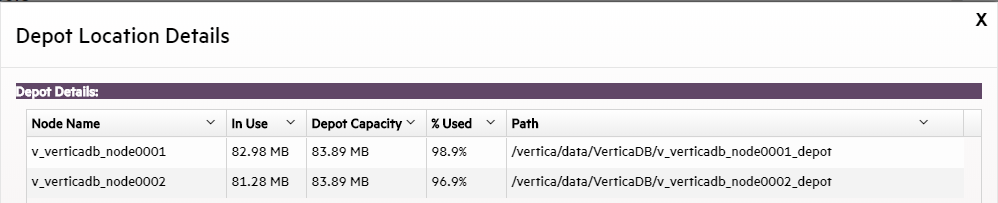
See also
Monitoring depot activity with MC
8.16 - Extended monitoring
Enabling extended monitoring allows you to monitor a longer range of data through MC.
Enabling extended monitoring allows you to monitor a longer range of data through MC. This can offer insight into long-term trends in your database's health. MC can also continue to display your monitored database's dashboard while it is down.
Extended monitoring uses Kafka to stream monitoring data from your monitored databases to a single MC storage database. MC can query the storage database instead of your monitored database to render some of its charts, reducing impact on your monitored database's performance.
How extended monitoring works
By default, MC monitors your database by querying it directly for monitoring data about system activities, performance, and resource utilization. Typically, the Data collector stores all monitoring data in data collector (DC) tables. However, DC tables have limited retention periods. See Data collector utility.
Extended monitoring stores your database's monitoring data in a dedicated storage database. Vertica streams data from your database's DC tables through Kafka servers to the storage database. To use extended monitoring, you must have access to a running Kafka server. For more how Vertica integrates with Kafka, see Apache Kafka integration.
After you set up and enable extended monitoring for a monitored database, MC renders several of your database's charts and graphs by querying the MC storage database instead of directly querying the database you are monitoring.
You can enable extended monitoring for any, or all, of your monitored databases. The MC storage database provides a single repository for monitoring data from every database that uses enabled extended monitoring.
In the following example, Kafka streams system data from two monitored databases to the storage database. MC uses the storage database to render individual dashboards for each monitored database. Be aware that MC always creates a dashboard that monitors the MC storage database.
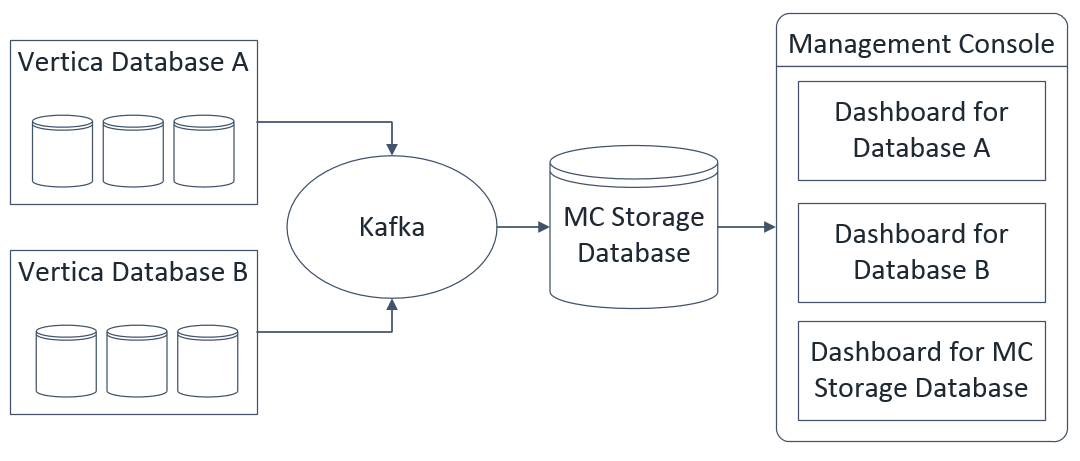
Use extended monitoring
Important
Important: To use extended monitoring, OpenText recommends installing Management Console on a host without any other Vertica databases.
When a database has extended monitoring enabled, the MC charts that use the feature display a rocket ship icon in the corner. You can use these charts to access longer-term data about your database's health or performance.
To view historical information in these charts, click the calendar icon to specify the timeframe to display. For example, if your database has been down for several hours, your charts do not display recent activity in your database. You could use the timeframe filter in the System Bottlenecks chart to see unusual resource usage occurred in your database in the hour it went down.
You can view a history of the Kafka streaming jobs loading data into the storage database. MC displays these jobs on the Load tab of your storage database's dashboard. See Viewing load history.
Set up extended monitoring
To set up extended monitoring, see Managing the storage database and Managing extended monitoring on a database.
See also
8.16.1 - Managing the storage database
Extended Monitoring stores your Vertica database's monitoring data in a dedicated MC storage database.
Extended Monitoring stores your Vertica database's monitoring data in a dedicated MC storage database.
To use Extended Monitoring, you must first set up the storage database and configure it for Kafka streaming. Then, turn on Extended Monitoring for any or all monitored databases.
MC automatically configures a schema for the storage database, named dcschema, which is synced with DC tables on your monitored databases.
Caution
Do not alter dcschema after MC has configured it. Altering it could cause the storage database to lose data or supply incorrect monitoring information to MC.
MC preparation
First verify that MC is not installed on the same host as a Vertica database. When Extended Monitoring is enabled, MC sharing a host with a production database can affect performance.
You must also increase the allocation of memory for the MC application server, as described in the next section. Tune the memory allocation options based on:
For example, MC requires more memory to display a week of data in a chart.
Modify memory allocation
To modify memory allocation:
-
In Management Console, select the Configuration tab on the MC Settings page.
-
Modify the following fields under Application Server JVM Settings to increase the allocation of memory for the JVM:
-
Initial Heap Size: For Extended Monitoring, a minimum value of 2 GB is recommended. (The default value is 1 GB.)
-
Maximum Heap Size: For Extended Monitoring, a minimum value of 4 GB is recommended. (The default value is 2 GB.)
-
Click Apply at the top right of the page. A prompt appears to restart MC.
-
Click OK to restart MC and save your changes.
Storage database requirements
To set up storage for Extended Monitoring, your system must meet the following prerequisites:
-
An available host, or available database whose Vertica version is the same version or a higher version of the database you plan to monitor.
-
Configured MC for Extended Monitoring (See Prepare MC to Use Extended Monitoring.)
-
Access to a deployed Kafka server (For details on installing Kafka, see the Apache Kafka site.)
Set up the storage database
To configure the storage database for Extended Monitoring, on the MC Settings page, select the MC Storage DB Setup tab. Modify the settings in each of the three areas:
1) Kafka Broker>
Enter the host name or IP addresses and ports for one or more of your deployed Kafka servers.
2) MC external storage database
Designate the storage database. You can create a new database or use an existing database.
-
Create a new database: To create a new single node cluster on an available host using a Community Edition license of Vertica, choose this option. Doing so does not affect your normal Vertica license usage.
-
Use an existing database known to MC: To designate a database you have already imported to MC, choose this option. If the schema 'dcschema' exists in the database, a dialog appears. Depending on your system needs, do one of the following:
- To keep the existing schema's data, click Append. For example, if you have already used this database for Extended Monitoring storage and are reimporting it, you can use this option to retain its historical data for continued use.
- To clear the existing schema from the database and create a fresh version of dcschema configured for Extended Monitoring storage, click Remove.
At the Database name prompt:
-
Select the database you want to use from the drop-down list.
-
To use that database for Extended Monitoring, click Prepare MC Storage database.
Advanced Streaming Options:
To change the value of the Scheduler Frame Duration, click Advanced Streaming Options. Management Console displays the Streaming Options window, which allows you to modify the Scheduler Frame Duration default that Management Console uses for Extended Monitoring..
The Scheduler Frame Duration is the amount of time given to the Kafka scheduler for each individual frame to process and run the COPY statements, after which KafkaSource terminates the COPY statements. Vertica must have enough time to complete COPY tasks within this duration.
If the frame duration is too small, you would see data loss, as the scheduler does not have sufficient time to process all the data. You may see errors or messages on Management Console’s Load page for microbatches that are not able to process the data.
On the contrary, if the frame duration is too large, the scheduler will have too much time to process the incoming data and after it has finished processing the data, it might wait for the frame duration to expire. In this case, you may see some latency in the data getting processed. In addition, the charts in Management Console may not show the data in real time and may show some latency.
You can approximate the average available time per COPY using the following equation:
TimePerCopy=(FrameDurationParallelism)/Microbatches*
This equation provides only a rough estimate. There are many factors that impact the amount of time that each COPY statement needs to run.
Vertica requires at least 100 milliseconds per COPY to function.
Note
The Advanced Scheduler options button is enabled when the Streaming is turned off. If Kafka Streaming is enabled, the Advanced Scheduler options button is disabled.
3) enable extended monitoring
Click Select database(s) for extended monitoring.
Restart the storage database
If you stop the storage database while streaming is enabled, streaming to the storage database stops automatically. You must re-enable streaming on the MC Storage DB Setup tab after you restart the storage database.
If streaming to the MC storage database is disabled while Extended Monitoring on your database is on, the Kafka retention policy determines how long streaming can remain disabled without data loss. See Managing streaming services for extended monitoring.
Discontinue the storage database
-
Select the Extended Monitoring tab in MC Settings.
-
Set Extended Monitoring for all databases to OFF.
-
Select the MC Storage DB Setup tab in MC Settings.
-
Click Disable Streaming in the MC External Storage Database section to de-activate your storage database.
-
Click Remove in the MC External Storage Database section to remove the MC Storage Database from MC.
-
Choose whether to keep or remove the data your storage database has collected:
-
Keep Data: Existing data will not removed. If you re-use this database for Extended Monitoring storage, you can choose to append new collected monitoring data to this existing data.
-
Remove Data: MC deletes its customized storage schema from the database.
On the Resource Pools tab of the storage database, you can optionally increase the memory size of SYSQUERY and KAFKA_DEFAULT_POOL. For setting resource pool parameters in MC, see Configuring resource pools with MC.
-
SYSQUERY: Reserved for temporary storage of intermediate results of queries against system monitoring and catalog tables. Default setting is 1G. For best performance for MC, set to 2G or higher.
-
KAFKA_DEFAULT_POOL: Reserved for all queries executed by the Kafka scheduler. Default setting is 30%, which is the recommended setting. By default, queries spill to the general pool when they exceed the 30% memory size.
Manage disk space
The storage database uses a customized schema, named dcschema. You can monitor these tables on MC, using the Table Utilization chart on the storage database's Activity tab. The Table Utilization chart lists all the tables in dcschema and their details, such as row counts and column properties. You can sort by row count to determine if certain tables use more disk space on your storage database. SeeMonitoring table utilization and projections with MC.
You should regularly drop partitions from dcschema if you have limited disk space for the MC storage database. MC does not automatically drop partitions from the storage database. For more information on dropping partitions, seeDropping partitions.
The table dc_execution_engine_profiles is partitioned by day. Because this table typically contains the most rows, as a best practice you should drop partitions from this table more often. The following example shows how you can specify partition key 2016-08-22 to drop a partition from dc_execution_engine_profiles.
=> SELECT DROP_PARTITIONS
  ('dcschema.dc_execution_engine_profiles', 2016-08-2, 2016-08-22);
Other than dc_execution_engine_profiles, all other tables in dcschema are partitioned by week. The next example shows you how you can drop a partition from the table dc_cpu_aggregate_by_minute, specifying the thirty-fourth week of 2016.
=> SELECT DROP_PARTITION
  ('dcschema.dc_cpu_aggregate_by_minute', 201634, 201634);
Manage client sessions
By default Vertica allows 50 client sessions and an additional five administrator sessions per node. If you reach the limit on the storage database, MC switches back to default monitoring, and does not use Extended Monitoring data from the storage database.
You can optionally configure the maximum number of client sessions that can run on a single database cluster node on your MC storage database's Settings page:
-
On the storage database dashboard, click the Settings page.
-
Choose the General tab.
-
Enter a value in the Maximum client sessions field. Valid values are 0–1000.
For more details about managing client connections in MC, see Configuring Management Console.
See also
8.16.2 - Managing extended monitoring on a database
When you enable extended monitoring on your Vertica database, monitoring data from your database streams through Kafka servers to the MC storage database.
When you enable extended monitoring on your Vertica database, monitoring data from your database streams through Kafka servers to the MC storage database.
You can enable streaming for any or all databases that MC monitors.
Extended monitoring prerequisites
Before you can enable extended monitoring, your system must meet these prerequisites:
Enable extended monitoring
-
Select the Extended Monitoring tab on MC Settings.
The Extended Monitoring page displays all databases monitored by MC.
-
In the Memory Limit field for the database of your choice, set the maximum amount of memory the database can use for streaming monitoring data. For more about the memory limit, see Managing streaming services for extended monitoring.
-
In the Extended Monitoring column, select ON to enable streaming for the database of your choice.
The database begins streaming its monitoring data to the Kafka server.
User access
When you change user permissions for a database using extended monitoring, the user access policy on the storage database does not automatically update. On the Extended Monitoring page, in the user access column for your database, click Refresh to sync the policy.
If you rename a Vertica user, you must re-map the user in MC Settings before refreshing the user access policy.
See also
8.16.3 - Managing streaming services for extended monitoring
When extended monitoring is enabled, Vertica streams data from your database through Kafka servers to the storage database.
When extended monitoring is enabled, Vertica streams data from your database through Kafka servers to the storage database.
For additional parameters that optimize the performance of Kafka with Vertica, see Kafka and Vertica configuration settings.
View streaming details in MC
Click the Load tab on your database's MC dashboard to see the Data Load Activity page. On this page, the Continuous tab displays details about all continuous loading jobs for extended monitoring. You can use this page to monitor whether your extended monitoring data is streaming successfully to the MC storage database.
See Viewing load history for more about the Data Load Activity page.
Tip
Tip: If you do not see loading jobs for extended monitoring, verify that you have selected Show MC data collector monitoring streams at the top of the Continuous tab.
Prevent data loss
The Memory Limit buffer allows you to restart the Kafka server without data loss. Vertica queues the streamed data until you restart the Kafka server. When the Kafka server remains down for an extended period of time, data loss occurs when the queue of streamed data exceeds the buffer. You set the buffer size on the Extended Monitoring tab when you enable extended monitoring for a database. See Managing extended monitoring on a database.
The Kafka retention policy determines when data loss occurs during the following scenarios:
The Kafka retention policy can allow you to restart these extended monitoring components without data loss. The Kafka server retains the data while the listed components are disabled. Data loss occurs when the streamed data exceeds the Kafka retention policy's log size or retention time limits. See the Apache Kafka documentation for how to configure the retention policy.
Changing the Kafka server
Be aware that when you change Kafka servers for extended monitoring on the MC Storage DB Setup page, you must disable all extended monitoring processes and re-configure the MC storage database. For storage database setup instructions, see Managing the storage database.
See also
9 - Troubleshooting with MC diagnostics
this topic doesn't appear to be used.
The Management Console Diagnostics page, which you access from the Home page, helps you resolve issues within the MC process, not the database.
What you can diagnose
-
View Management Console logs, which you can sort by column headings, such as type, component, or message).
-
Search messages for key words or phrases and search for log entries within a specific time frame.
-
Export database messages to a file.
-
Reset console parameters to their original configuration.
Caution
Reset removes all data (monitoring and configuration information) from storage and sets
MC to factory settings.
-
Restart the Management Console process. When the process completes, you are directed back to the login page.
9.1 - Viewing the MC log
If you want to browse MC logs (not database logs), navigate to the Diagnostics > MC Log page.
If you want to browse MC logs (not database logs), navigate to the Diagnostics > MC Log page.
This page provides a tabular view of the contents at /opt/vconsole/log/mc/mconsole.log, letting you more easily identify and troubleshoot issues related to MC.
You can sort log entries by clicking the column header and search within messages for key words, phrases, and log entries within a specific time frame. You can also export log messages to a file.
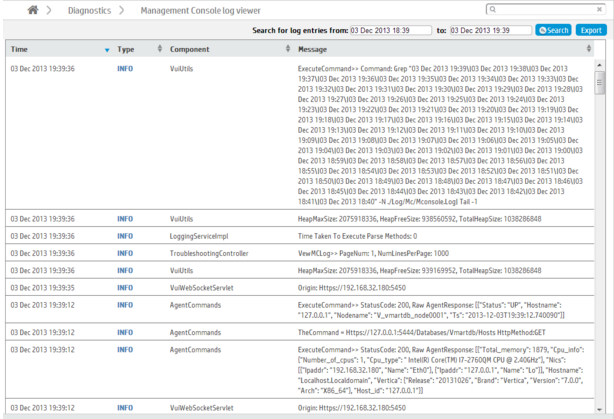
9.2 - Exporting the user audit log
When an MC user makes changes on Management Console, whether to an MC-managed database or to the MC itself, their action generates a log entry that contains data you can export to a file.
When an MC user makes changes on Management Console, whether to an MC-managed database or to the MC itself, their action generates a log entry that contains data you can export to a file.
If you perform an MC factory reset (restore MC to its pre-configured state), you automatically have the opportunity to export audit records before the reset occurs.
To manually export MC user activity
-
From the MC Home page, click Diagnostics and then click Audit Log.
-
On the Audit log viewer page, click Export and save the file to a location on the server.
To see what types of user operations the audit logger records, see Monitoring MC user activity using audit log.
9.3 - Restarting MC
You might need to restart the MC web/application server for a number of reasons, such as after you change port assignments, use the MC interface to import a new SSL certificate, or if the MC interface or Vertica-related tasks become unresponsive.
You might need to restart the MC web/application server for a number of reasons, such as after you change port assignments, use the MC interface to import a new SSL certificate, or if the MC interface or Vertica-related tasks become unresponsive.
Restarting MC requires ADMIN Role (MC) or SUPER Role (MC) privileges. For details about these roles, see Configuration privileges.
How to restart MC through the MC interface (using your browser)
-
Open a web browser and connect to MC as an administrator.
-
On MC's Home page, click Diagnostics.
-
Click Restart Console and then click OK to continue or Cancel to return to the Diagnostics page..
The MC process shuts down for a few seconds and automatically restarts. After the process completes, you are directed back to the sign-in page.
How to restart MC at the command line
If you are unable to connect to MC through a web browser for any reason, such as if the MC interface or Vertica-related tasks become unresponsive, you can run the vertica-consoled script with start, stop, or restart arguments.
Follow these steps to start, stop, or restart MC.
-
As root, open a terminal window on the server on which MC is installed.
-
Run the vertica-consoled script:
# /etc/init.d/vertica-consoled { stop | start | restart }
For versions CentOS 7 and above, run:
# systemctl { stop | start | restart } vertica-consoled
Important
The systemctl function requires you to both start and stop services explicitly. If you kill or stop the vertica-consoled process without using systemctl stop, you cannot start the MC process again with the original systemctl start command. Instead, you must run systemctl stop vertica-consoled before running systemctl start vertica-consoled.
stop |
Stops the MC application/web server. |
start |
Starts the MC application/web server.
Caution: Use start only if you are certain MC is not already running. As a best practice, stop MC before you issue the start command.
|
restart |
Restarts the MC application/web server. This process will report that the stop didn't work if MC is not already running. |
How to restart MC on an AMI
You can use the following steps to restart an MC AMI instance.
- SSH into the MC host as user dbadmin:
$ ssh -i example.pem dbadmin@52.xx.xx.xx
- Run the vertica-consoled script using sudo:
# sudo /etc/init.d/vertica-consoled { stop | start | restart }
Starting over
If you need to return MC to its original state (a "factory reset"), see Resetting MC to pre-configured state.
9.4 - Resetting MC to pre-configured state
If you decide to reset MC to its original, preconfigured state, you can do so on the Diagnostics page by clicking Factory Reset.
If you decide to reset MC to its original, preconfigured state, you can do so on the Diagnostics page by clicking Factory Reset.
Tip
Consider trying one of the options described in
Restarting MC first.
A factory reset removes all metadata (about a week's worth of database monitoring/configuration information and MC users) from storage and forces you to reconfigure MC again, as described in Configuring MC.
After you click Factory Reset, you have the chance to export audit records to a file by clicking Yes. If you click No (do not export audit records), the process begins. There is no undo.
Keep the following in mind concerning user accounts and the MC.
-
When you first configure MC, during the configuration process you create an MC superuser (a Linux account). Issuing a Factory Reset on the MC does not create a new MC superuser, nor does it delete the existing MC superuser. When initializing after a Factory Reset, you must logon using the original MC superuser account.
-
Note that, once MC is configured, you can add users that are specific to MC. Users created through the MC interface are MC specific. When you subsequently change a password through the MC, you only change the password for the specific MC user. Passwords external to MC (i.e., system Linux users and Vertica database passwords) remain unchanged.
For information on MC users, refer to the sections, Creating an MC User and MC configuration privileges.
9.5 - Avoiding MC self-signed certificate expiration
When you connect to MC through a client browser, Vertica assigns each HTTPS request a self-signed certificate, which includes a timestamp. To increase security and protect against password replay attacks, the timestamp is valid for several seconds only, after which it expires.
To avoid being blocked out of MC, synchronize time on the hosts in your Vertica cluster, and on the MC host if it resides on a dedicated server. To recover from loss or lack of synchronization, resync system time and the Network Time Protocol.
10 - Uninstalling Management Console
The uninstall command shuts down Management Console (MC) and removes most of the files that MC installation script installed.
The uninstall command shuts down Management Console (MC) and removes most of the files that MC installation script installed.
-
Log in to the target server as root.
-
Stop Management Console:
# /etc/init.d/vertica-consoled stop
For versions of Red Hat 7/CentOS 7 and above, use:
# systemctl stop vertica-consoled
-
Look for previously-installed versions of MC and note the version:
RPM
# rpm -qa | grep vertica
DEB
# dpkg -l | grep vertica
-
Remove the package:
RPM
# rpm -e vertica-console
DEB
# dpkg -r vertica-console
-
Optionally, delete the MC directory and all subdirectories:
# rm -rf /opt/vconsole