Charting subcluster resource usage in MC
On the Database Overview page, in the CPU/Memory/Disk I/O chart and the Database General Pool Usage chart, you can use the dropdown in the title bar to focus the chart on:
-
All nodes in the database
-
All subclusters in the database
-
An individual subcluster, by name
For example, the CPU/Memory/Disk I/O chart dropdown allows you to choose the database nodes, one named subcluster, or all subclusters.
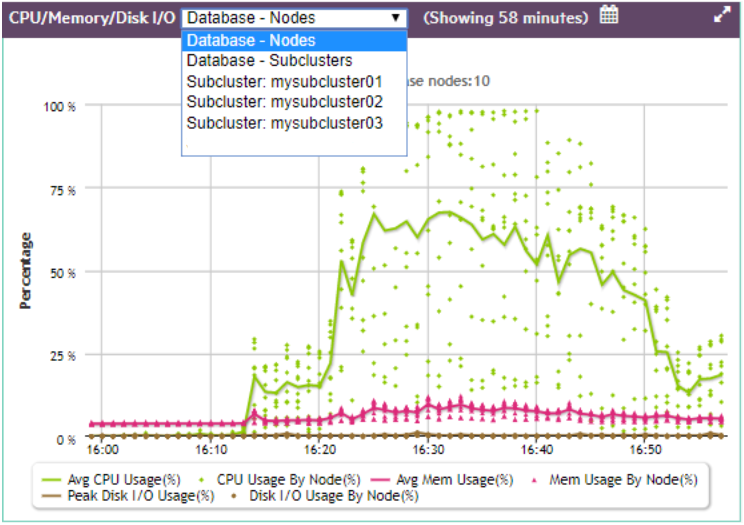
If you choose Database - Subclusters, the line in a given color represents the trend of all subclusters averaged together for that statistic, and each dot of the same color represents an individual subcluster at a certain time, for that same statistic.
For more in-depth information on how expand detail areas of charts and drill into the details, see Viewing the overview page.