READ_TREE
Reads the contents of trees within the random forest or XGBoost model.
Reads the contents of trees within the random forest or XGBoost model.
Syntax
READ_TREE ( USING PARAMETERS model_name = 'model-name' [, tree_id = tree-id] [, format = 'format'] )
Parameters
model_name- Identifies the model that is stored as a result of training, where
model-nameconforms to conventions described in Identifiers. It must also be unique among all names of sequences, tables, projections, views, and models within the same schema. tree_id- The tree identifier, an integer between 0 and
n-1, wherenis the number of trees in the random forest or XGBoost model. If you omit this parameter, all trees are returned. format- Output format of the returned tree, one of the following:
-
tabular: Returns a table with the twelve output columns. -
graphviz: Returns DOT language source that can be passed to a graphviz tool and render a graphic visualization of the tree.
-
Privileges
Non-superusers: USAGE privileges on the model
Examples
Get tabular output from READ_TREE for a random forest model:
=> SELECT READ_TREE ( USING PARAMETERS model_name='myRFModel', tree_id=1 ,
format= 'tabular') LIMIT 2;
-[ RECORD 1 ]-------------+-------------------
tree_id                   | 1
node_id                   | 1
node_depth                | 0
is_leaf                   | f
is_categorical_split      | f
split_predictor           | petal_length
split_value               | 1.921875
weighted_information_gain | 0.111242236024845
left_child_id             | 2
right_child_id            | 3
prediction                |
probability/variance      |

-[ RECORD 2 ]-------------+-------------------
tree_id                   | 1
node_id                   | 2
node_depth                | 1
is_leaf                   | t
is_categorical_split      |
split_predictor           |
split_value               |
weighted_information_gain |
left_child_id             |
right_child_id            |
prediction                | setosa
probability/variance      | 1
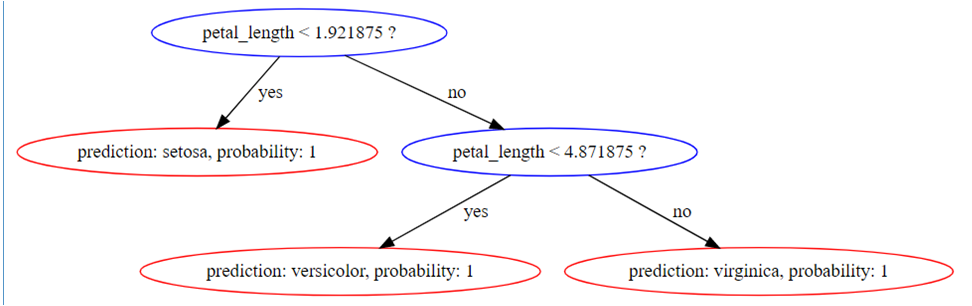
Get graphviz-formatted output from READ_TREE:
=> SELECT READ_TREE ( USING PARAMETERS model_name='myRFModel', tree_id=1 ,
format= 'graphviz')LIMIT 1;

-[ RECORD 1 ]+-------------------------------------------------------------------
---------------------------------------------------------------------------------
tree_id      | 1
tree_digraph | digraph Tree{
1 [label="petal_length < 1.921875 ?", color="blue"];
1 -> 2 [label="yes", color="black"];
1 -> 3 [label="no", color="black"];
2 [label="prediction: setosa, probability: 1", color="red"];
3 [label="petal_length < 4.871875 ?", color="blue"];
3 -> 6 [label="yes", color="black"];
3 -> 7 [label="no", color="black"];
6 [label="prediction: versicolor, probability: 1", color="red"];
7 [label="prediction: virginica, probability: 1", color="red"];
}
This renders as follows: