A set of Vertica machine learning functions evaluate the prediction data that is generated by trained models, or return information about the models themselves.
This is the multi-page printable view of this section. Click here to print.
Model evaluation
A set of Vertica machine learning functions evaluate the prediction data that is generated by trained models, or return information about the models themselves.
- 1: CONFUSION_MATRIX
- 2: CROSS_VALIDATE
- 3: ERROR_RATE
- 4: LIFT_TABLE
- 5: MSE
- 6: PRC
- 7: READ_TREE
- 8: RF_PREDICTOR_IMPORTANCE
- 9: ROC
- 10: RSQUARED
- 11: XGB_PREDICTOR_IMPORTANCE
1 - CONFUSION_MATRIX
Computes the confusion matrix of a table with observed and predicted values of a response variable.
Computes the confusion matrix of a table with observed and predicted values of a response variable. CONFUSION_MATRIX produces a table with the following dimensions:
-
Rows: Number of classes
-
Columns: Number of classes + 2
Syntax
CONFUSION_MATRIX ( targets, predictions [ USING PARAMETERS num_classes = num-classes ] OVER()
Arguments
targets- An input column that contains the true values of the response variable.
predictions- An input column that contains the predicted class labels.
Arguments targets and predictions must be set to input columns of the same data type, one of the following: INTEGER, BOOLEAN, or CHAR/VARCHAR. Depending on their data type, these columns identify classes as follows:
-
INTEGER: Zero-based consecutive integers between 0 and (
num-classes-1) inclusive, wherenum-classesis the number of classes. For example, given the following input column values—{0, 1, 2, 3, 4}—Vertica assumes five classes.Note
If input column values are not consecutive, Vertica interpolates the missing values. Thus, given the following input values—{0, 1, 3, 5, 6,}— Vertica assumes seven classes. -
BOOLEAN: Yes or No
-
CHAR/VARCHAR: Class names. If the input columns are of type CHAR/VARCHAR columns, you must also set parameter
num_classesto the number of classes.Note
Vertica computes the number of classes as the union of values in both input columns. For example, given the following sets of values in the
targetsandpredictionsinput columns, Vertica counts four classes:{'milk', 'soy milk', 'cream'} {'soy milk', 'almond milk'}
Parameters
num_classesAn integer > 1, specifies the number of classes to pass to the function.
You must set this parameter if the specified input columns are of type CHAR/VARCHAR. Otherwise, the function processes this parameter according to the column data types:
-
INTEGER: By default set to 2, you must set this parameter correctly if the number of classes is any other value.
-
BOOLEAN: By default set to 2, cannot be set to any other value.
-
Examples
This example computes the confusion matrix for a logistic regression model that classifies cars in the mtcars data set as automatic or manual transmission. Observed values are in input column obs, while predicted values are in input column pred. Because this is a binary classification problem, all values are either 0 or 1.
In the table returned, all 19 cars with a value of 0 in column am are correctly predicted by PREDICT_LOGISTIC_REGRESSION as having a value of 0. Of the 13 cars with a value of 1 in column am, 12 are correctly predicted to have a value of 1, while 1 car is incorrectly classified as having a value of 0:
=> SELECT CONFUSION_MATRIX(obs::int, pred::int USING PARAMETERS num_classes=2) OVER()
    FROM (SELECT am AS obs, PREDICT_LOGISTIC_REG(mpg, cyl, disp,drat, wt, qsec, vs, gear, carb
             USING PARAMETERS model_name='myLogisticRegModel')AS PRED
             FROM mtcars) AS prediction_output;

actual_class | predicted_0 | predicted_1 |        comment
-------------+-------------+-------------+------------------------------------------
0            |          19 |           0 |
1            |           0 |          13 | Of 32 rows, 32 were used and 0 were ignored
(2 rows)
2 - CROSS_VALIDATE
Performs k-fold cross validation on a learning algorithm using an input relation, and grid search for hyper parameters.
Performs k-fold cross validation on a learning algorithm using an input relation, and grid search for hyper parameters. The output is an average performance indicator of the selected algorithm. This function supports SVM classification, naive bayes, and logistic regression.
This is a meta-function. You must call meta-functions in a top-level SELECT statement.
Behavior type
VolatileSyntax
CROSS_VALIDATE ( 'algorithm', 'input-relation', 'response-column', 'predictor-columns'
        [ USING PARAMETERS
              [exclude_columns = 'excluded-columns']
           [, cv_model_name = 'model']
           [, cv_metrics = 'metrics']
           [, cv_fold_count = num-folds]
           [, cv_hyperparams = 'hyperparams']
           [, cv_prediction_cutoff = prediction-cutoff] ] )
Arguments
algorithm- Name of the algorithm training function, one of the following:
input-relation- The table or view that contains data used for training and testing. If the input relation is defined in Hive, use
SYNC_WITH_HCATALOG_SCHEMAto sync thehcatalogschema, and then run the machine learning function. response-column- Name of the input column that contains the response.
predictor-columnsComma-separated list of columns in the input relation that represent independent variables for the model, or asterisk (*) to select all columns. If you select all columns, the argument list for parameter
exclude_columnsmust includeresponse-column, and any columns that are invalid as predictor columns.
Parameters
exclude_columns- Comma-separated list of columns from
predictor-columnsto exclude from processing. cv_model_name- The name of a model that lets you retrieve results of the cross validation process. If you omit this parameter, results are displayed but not saved. If you set this parameter to a model name, you can retrieve the results with summary functions
GET_MODEL_ATTRIBUTEandGET_MODEL_SUMMARY -
cv_metrics - The metrics used to assess the algorithm, specified either as a comma-separated list of metric names or in a JSON array. In both cases, you specify one or more of the following metric names:
-
accuracy(default) -
error_rate -
TP: True positive, the number of cases of class 1 predicted as class 1 -
FP: False positive, the number of cases of class 0 predicted as class 1 -
TN: True negative, the number of cases of class 0 predicted as class 0 -
FN: False negative, the number of cases of class 1 predicted as class 0 -
TPRorrecall: True positive rate, the correct predictions among class 1 -
FPR: False positive rate, the wrong predictions among class 0 -
TNR: True negative rate, the correct predictions among class 0 -
FNR: False negative rate, the wrong predictions among class 1 -
PPVorprecision: The positive predictive value, the correct predictions among cases predicted as class 1 -
NPV: Negative predictive value, the correct predictions among cases predicted as class 0 -
MSE: Mean squared error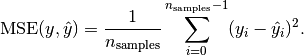
-
MAE: Mean absolute error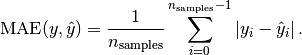
-
rsquared: coefficient of determination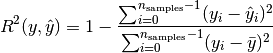
-
explained_variance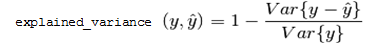
-
fscore(1 + beta˄2) * precison * recall / (beta˄2 * precision + recall)beta equals 1 by default
-
auc_roc: AUC of ROC using the specified number of bins, by default 100 -
auc_prc: AUC of PRC using the specified number of bins, by default 100 -
counts: Shortcut that resolves to four other metrics:TP,FP,TN, andFN -
count: Valid only in JSON syntax, counts the number of cases labeled by one class (case-class-label) but predicted as another class (predicted-class-label):cv_metrics='[{"count":[case-class-label, predicted-class-label]}]'
-
cv_fold_count- The number of folds to split the data.
Default: 5
cv_hyperparams- A JSON string that describes the combination of parameters for use in grid search of hyper parameters. The JSON string contains pairs of the hyper parameter name. The value of each hyper parameter can be specified as an array or sequence. For example:
{"param1":[value1,value2,...], "param2":{"first":first_value, "step":step_size, "count":number_of_values} }Hyper parameter names and string values should be quoted using the JSON standard. These parameters are passed to the training function.
cv_prediction_cutoff- The cutoff threshold that is passed to the prediction stage of logistic regression, a FLOAT between 0 and 1, exclusive
Default: 0.5
Model attributes
call_string- The value of all input arguments that were specified at the time
CROSS_VALIDATEwas called. run_average- The average across all folds of all metrics specified in parameter
cv_metrics, if specified; otherwise, average accuracy. fold_info- The number of rows in each fold:
-
fold_id: The index of the fold. -
row_count: The number of rows held out for testing in the fold.
-
counters- All counters for the function, including:
-
accepted_row_count: The total number of rows in theinput_relation, minus the number of rejected rows. -
rejected_row_count: The number of rows of theinput_relationthat were skipped because they contained an invalid value. -
feature_count: The number of features input to the machine learning model.
-
run_details- Information about each run, where a run means training a single model, and then testing that model on the one held-out fold:
-
fold_id: The index of the fold held out for testing. -
iteration_count: The number of iterations used in model training on non-held-out folds. -
accuracy: All metrics specified in parametercv_metrics, or accuracy ifcv_metricsis not provided. -
error_rate: All metrics specified in parametercv_metrics, or accuracy if the parameter is omitted.
-
Privileges
Non-superusers:
-
SELECT privileges on the input relation
-
CREATE and USAGE privileges on the default schema where machine learning algorithms generate models. If
cv_model_nameis provided, the cross validation results are saved as a model in the same schema.
Specifying metrics in JSON
Parameter cv_metrics can specify metrics as an array of JSON objects, where each object specifies a metric name . For example, the following expression sets cv_metrics to two metrics specified as JSON objects, accuracy and error_rate:
cv_metrics='["accuracy", "error_rate"]'
In the next example, cv_metrics is set to two metrics, accuracy and TPR (true positive rate). Here, the TPR metric is specified as a JSON object that takes an array of two class label arguments, 2 and 3:
cv_metrics='[ "accuracy", {"TPR":[2,3] } ]'
Metrics specified as JSON objects can accept parameters. In the following example, the fscore metric specifies parameter beta, which is set to 0.5:
cv_metrics='[ {"fscore":{"beta":0.5} } ]'
Parameter support can be especially useful for certain metrics. For example, metrics auc_roc and auc_prc build a curve, and then compute the area under that curve. For ROC, the curve is formed by plotting metrics TPR against FPR; for PRC, PPV (precision) against TPR (recall). The accuracy of such curves can be increased by setting parameter num_bins to a value greater than the default value of 100. For example, the following expression computes AUC for an ROC curve built with 1000 bins:
cv_metrics='[{"auc_roc":{"num_bins":1000}}]'
Using metrics with Multi-class classifier functions
All supported metrics are defined for binary classifier functions
LOGISTIC_REG and
SVM_CLASSIFIER. For multi-class classifier functions such as
NAIVE_BAYES, these metrics can be calculated for each one-versus-the-rest binary classifier. Use arguments to request the metrics for each classifier. For example, if training data has integer class labels, you can set cv_metrics with the precision (PPV) metric as follows:
cv_metrics='[{"precision":[0,4]}]'
This setting specifies to return two columns with precision computed for two classifiers:
-
Column 1: classifies 0 versus not 0
-
Collumn 2: classifies 4 versus not 4
If you omit class label arguments, the class with index 1 is used. Instead of computing metrics for individual one-versus-the-rest classifiers, the average is computed in one of the following styles: macro, micro, or weighted (default). For example, the following cv_metrics setting returns the average weighted by class sizes:
cv_metrics='[{"precision":{"avg":"weighted"}}]'
AUC-type metrics can be similarly defined for multi-class classifiers. For example, the following cv_metrics setting computes the area under the ROC curve for each one-versus-the-rest classifier, and then returns the average weighted by class sizes.
cv_metrics='[{"auc_roc":{"avg":"weighted", "num_bins":1000}}]'
Examples
=> SELECT CROSS_VALIDATE('svm_classifier', 'mtcars', 'am', 'mpg'
      USING PARAMETERS cv_fold_count= 6,
                       cv_hyperparams='{"C":[1,5]}',
                       cv_model_name='cv_svm',
                       cv_metrics='accuracy, error_rate');
         CROSS_VALIDATE
----------------------------
 Finished

===========
run_average
===========
C  |accuracy      |error_rate
---+--------------+----------
1 | 0.75556       |  0.24444
5 | 0.78333       |  0.21667
(1 row)
3 - ERROR_RATE
Using an input table, returns a table that calculates the rate of incorrect classifications and displays them as FLOAT values.
Using an input table, returns a table that calculates the rate of incorrect classifications and displays them as FLOAT values. ERROR_RATE returns a table with the following dimensions:
-
Rows: Number of classes plus one row that contains the total error rate across classes
-
Columns: 2
Syntax
ERROR_RATE ( targets, predictions [ USING PARAMETERS num_classes = num-classes ] ) OVER()
Arguments
targets- An input column that contains the true values of the response variable.
predictions- An input column that contains the predicted class labels.
Arguments targets and predictions must be set to input columns of the same data type, one of the following: INTEGER, BOOLEAN, or CHAR/VARCHAR. Depending on their data type, these columns identify classes as follows:
-
INTEGER: Zero-based consecutive integers between 0 and (
num-classes-1) inclusive, wherenum-classesis the number of classes. For example, given the following input column values—{0, 1, 2, 3, 4}—Vertica assumes five classes.Note
If input column values are not consecutive, Vertica interpolates the missing values. Thus, given the following input values—{0, 1, 3, 5, 6,}— Vertica assumes seven classes. -
BOOLEAN: Yes or No
-
CHAR/VARCHAR: Class names. If the input columns are of type CHAR/VARCHAR columns, you must also set parameter
num_classesto the number of classes.Note
Vertica computes the number of classes as the union of values in both input columns. For example, given the following sets of values in the
targetsandpredictionsinput columns, Vertica counts four classes:{'milk', 'soy milk', 'cream'} {'soy milk', 'almond milk'}
Parameters
num_classesAn integer > 1, specifies the number of classes to pass to the function.
You must set this parameter if the specified input columns are of type CHAR/VARCHAR. Otherwise, the function processes this parameter according to the column data types:
-
INTEGER: By default set to 2, you must set this parameter correctly if the number of classes is any other value.
-
BOOLEAN: By default set to 2, cannot be set to any other value.
-
Privileges
Non-superusers: model owner, or USAGE privileges on the model
Examples
This example shows how to execute the ERROR_RATE function on an input table named mtcars. The response variables appear in the column obs, while the prediction variables appear in the column pred. Because this example is a classification problem, all response variable values and prediction variable values are either 0 or 1, indicating binary classification.
In the table returned by the function, the first column displays the class id column. The second column displays the corresponding error rate for the class id. The third column indicates how many rows were successfully used by the function and whether any rows were ignored.
=> SELECT ERROR_RATE(obs::int, pred::int USING PARAMETERS num_classes=2) OVER()
    FROM (SELECT am AS obs, PREDICT_LOGISTIC_REG (mpg, cyl, disp, drat, wt, qsec, vs, gear, carb
                USING PARAMETERS model_name='myLogisticRegModel', type='response') AS pred
             FROM mtcars) AS prediction_output;
 class |     error_rate     |                   comment
-------+--------------------+---------------------------------------------
     0 |                  0 |
     1 | 0.0769230797886848 |
       |            0.03125 | Of 32 rows, 32 were used and 0 were ignored
(3 rows)
4 - LIFT_TABLE
Returns a table that compares the predictive quality of a machine learning model.
Returns a table that compares the predictive quality of a machine learning model. This function is also known as a lift chart.
Syntax
LIFT_TABLE ( targets, probabilities
        [ USING PARAMETERS [num_bins = num-bins] [, main_class = class-name ] ] )
OVER()
Arguments
targets- An input column that contains the true values of the response variable, one of the following data types: INTEGER, BOOLEAN, or CHAR/VARCHAR. Depending on the column data type, the function processes column data as follows:
-
INTEGER: Uses the input column as containing the true value of the response variable.
-
BOOLEAN: Resolves Yes to 1, 0 to No.
-
CHAR/VARCHAR: Resolves the value specified by parameter
main_classto 1, all other values to 0.
Note
If the input column is of data type INTEGER or BOOLEAN, the function ignores parametermain_class. -
probabilities- A FLOAT input column that contains the predicted probability of response being the main class, set to 1 if
targetsis of type INTEGER.
Parameters
num_binsAn integer value that determines the number of decision boundaries. Decision boundaries are set at equally spaced intervals between 0 and 1, inclusive. The function computes the table at each
num-bin+ 1 point.Default: 100
main_classUsed only if
targetsis of type CHAR/VARCHAR, specifies the class to associate with theprobabilitiesargument.
Examples
Execute LIFT_TABLE on an input table mtcars.
=> SELECT LIFT_TABLE(obs::int, prob::float USING PARAMETERS num_bins=2) OVER()
    FROM (SELECT am AS obs, PREDICT_LOGISTIC_REG(mpg, cyl, disp, drat, wt, qsec, vs, gear, carb
                                                    USING PARAMETERS model_name='myLogisticRegModel',
                                                    type='probability') AS prob
             FROM mtcars) AS prediction_output;
 decision_boundary | positive_prediction_ratio |       lift       |                   comment
-------------------+---------------------------+------------------+---------------------------------------------
                 1 |                         0 |              NaN |
               0.5 |                   0.40625 | 2.46153846153846 |
                 0 |                         1 |                1 | Of 32 rows, 32 were used and 0 were ignored
(3 rows)
The first column, decision_boundary, indicates the cut-off point for whether to classify a response as 0 or 1. For instance, for each row, if prob is greater than or equal to decision_boundary, the response is classified as 1. If prob is less than decision_boundary, the response is classified as 0.
The second column, positive_prediction_ratio, shows the percentage of samples in class 1 that the function classified correctly using the corresponding decision_boundary value.
For the third column, lift, the function divides the positive_prediction_ratio by the percentage of rows correctly or incorrectly classified as class 1.
5 - MSE
Returns a table that displays the mean squared error of the prediction and response columns in a machine learning model.
Returns a table that displays the mean squared error of the prediction and response columns in a machine learning model.
Syntax
MSE ( targets, predictions ) OVER()
Arguments
targets- The model response variable, of type FLOAT.
predictions- A FLOAT input column that contains predicted values for the response variable.
Examples
Execute the MSE function on input table faithful_testing. The response variables appear in the column obs, while the prediction variables appear in the column prediction.
=> SELECT MSE(obs, prediction) OVER()
   FROM (SELECT eruptions AS obs,
                PREDICT_LINEAR_REG (waiting USING PARAMETERS model_name='myLinearRegModel') AS prediction
         FROM faithful_testing) AS prediction_output;
        mse        |                   Comments
-------------------+-----------------------------------------------
 0.252925741352641 | Of 110 rows, 110 were used and 0 were ignored
(1 row)
6 - PRC
Returns a table that displays the points on a receiver precision recall (PR) curve.
Returns a table that displays the points on a receiver precision recall (PR) curve.
Syntax
PRC ( targets, probabilities
       [ USING PARAMETERS
             [num_bins = num-bins]
             [, f1_score = return-score ]
             [, main_class = class-name ] )
OVER()
Arguments
targets- An input column that contains the true values of the response variable, one of the following data types: INTEGER, BOOLEAN, or CHAR/VARCHAR. Depending on the column data type, the function processes column data as follows:
-
INTEGER: Uses the input column as containing the true value of the response variable.
-
BOOLEAN: Resolves Yes to 1, 0 to No.
-
CHAR/VARCHAR: Resolves the value specified by parameter
main_classto 1, all other values to 0.
Note
If the input column is of data type INTEGER or BOOLEAN, the function ignores parametermain_class. -
probabilities- A FLOAT input column that contains the predicted probability of response being the main class, set to 1 if
targetsis of type INTEGER.
Parameters
num_binsAn integer value that determines the number of decision boundaries. Decision boundaries are set at equally spaced intervals between 0 and 1, inclusive. The function computes the table at each
num-bin+ 1 point.Default: 100
f1_score- A Boolean that specifies whether to return a column that contains the f1 score—the harmonic average of the precision and recall measures, where an F1 score reaches its best value at 1 (perfect precision and recall) and worst at 0.
Default: false
main_classUsed only if
targetsis of type CHAR/VARCHAR, specifies the class to associate with theprobabilitiesargument.
Examples
Execute the PRC function on an input table named mtcars. The response variables appear in the column obs, while the prediction variables appear in column pred.
=> SELECT PRC(obs::int, prob::float USING PARAMETERS num_bins=2, f1_score=true) OVER()
    FROM (SELECT am AS obs,
                    PREDICT_LOGISTIC_REG (mpg, cyl, disp, drat, wt, qsec, vs, gear, carb
                          USING PARAMETERS model_name='myLogisticRegModel',
                                           type='probability') AS prob
             FROM mtcars) AS prediction_output;
decision_boundary | recall | precision |     f1_score      |     comment
------------------+--------+-----------+-------------------+--------------------------------------------
0                 |      1 |   0.40625 | 0.577777777777778 |
0.5               |      1 |         1 |                 1 | Of 32 rows, 32 were used and 0 were ignored
(2 rows)
The first column, decision_boundary, indicates the cut-off point for whether to classify a response as 0 or 1. For example, in each row, if the probability is equal to or greater than decision_boundary, the response is classified as 1. If the probability is less than decision_boundary, the response is classified as 0.
7 - READ_TREE
Reads the contents of trees within the random forest or XGBoost model.
Reads the contents of trees within the random forest or XGBoost model.
Syntax
READ_TREE ( USING PARAMETERS model_name = 'model-name' [, tree_id = tree-id] [, format = 'format'] )
Parameters
model_name- Identifies the model that is stored as a result of training, where
model-nameconforms to conventions described in Identifiers. It must also be unique among all names of sequences, tables, projections, views, and models within the same schema. tree_id- The tree identifier, an integer between 0 and
n-1, wherenis the number of trees in the random forest or XGBoost model. If you omit this parameter, all trees are returned. format- Output format of the returned tree, one of the following:
-
tabular: Returns a table with the twelve output columns. -
graphviz: Returns DOT language source that can be passed to a graphviz tool and render a graphic visualization of the tree.
-
Privileges
Non-superusers: USAGE privileges on the model
Examples
Get tabular output from READ_TREE for a random forest model:
=> SELECT READ_TREE ( USING PARAMETERS model_name='myRFModel', tree_id=1 ,
format= 'tabular') LIMIT 2;
-[ RECORD 1 ]-------------+-------------------
tree_id                   | 1
node_id                   | 1
node_depth                | 0
is_leaf                   | f
is_categorical_split      | f
split_predictor           | petal_length
split_value               | 1.921875
weighted_information_gain | 0.111242236024845
left_child_id             | 2
right_child_id            | 3
prediction                |
probability/variance      |

-[ RECORD 2 ]-------------+-------------------
tree_id                   | 1
node_id                   | 2
node_depth                | 1
is_leaf                   | t
is_categorical_split      |
split_predictor           |
split_value               |
weighted_information_gain |
left_child_id             |
right_child_id            |
prediction                | setosa
probability/variance      | 1
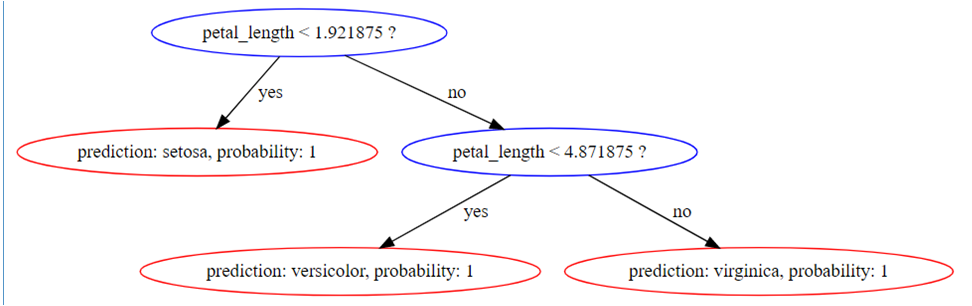
Get graphviz-formatted output from READ_TREE:
=> SELECT READ_TREE ( USING PARAMETERS model_name='myRFModel', tree_id=1 ,
format= 'graphviz')LIMIT 1;

-[ RECORD 1 ]+-------------------------------------------------------------------
---------------------------------------------------------------------------------
tree_id      | 1
tree_digraph | digraph Tree{
1 [label="petal_length < 1.921875 ?", color="blue"];
1 -> 2 [label="yes", color="black"];
1 -> 3 [label="no", color="black"];
2 [label="prediction: setosa, probability: 1", color="red"];
3 [label="petal_length < 4.871875 ?", color="blue"];
3 -> 6 [label="yes", color="black"];
3 -> 7 [label="no", color="black"];
6 [label="prediction: versicolor, probability: 1", color="red"];
7 [label="prediction: virginica, probability: 1", color="red"];
}
This renders as follows:
See also
8 - RF_PREDICTOR_IMPORTANCE
Measures the importance of the predictors in a random forest model using the Mean Decrease Impurity (MDI) approach.
Measures the importance of the predictors in a random forest model using the Mean Decrease Impurity (MDI) approach. The importance vector is normalized to sum to 1.
Syntax
RF_PREDICTOR_IMPORTANCE ( USING PARAMETERS model_name = 'model-name' [, tree_id = tree-id] )
Parameters
model_name- Identifies the model that is stored as a result of the training, where
model-namemust be of typerf_classifierorrf_regressor. tree_id- Identifies the tree to process, an integer between 0 and
n-1, wherenis the number of trees in the forest. If you omit this parameter, the function uses all trees to measure importance values.
Privileges
Non-superusers: USAGE privileges on the model
Examples
This example shows how you can use the RF_PREDICTOR_IMPORTANCE function.
=> SELECT RF_PREDICTOR_IMPORTANCE ( USING PARAMETERS model_name = 'myRFModel');
 predictor_index | predictor_name | importance_value
-----------------+----------------+--------------------
               0 | sepal.length   | 0.106763318092655
               1 | sepal.width    | 0.0279536658041994
               2 | petal.length   | 0.499198722346586
               3 | petal.width    | 0.366084293756561
(4 rows)
See also
9 - ROC
Returns a table that displays the points on a receiver operating characteristic curve.
Returns a table that displays the points on a receiver operating characteristic curve. The ROC function tells you the accuracy of a classification model as you raise the discrimination threshold for the model.
Syntax
ROC ( targets, probabilities
        [ USING PARAMETERS
              [num_bins = num-bins]
              [, AUC = output]
              [, main_class = class-name ] ) ] )
OVER()
Arguments
targets- An input column that contains the true values of the response variable, one of the following data types: INTEGER, BOOLEAN, or CHAR/VARCHAR. Depending on the column data type, the function processes column data as follows:
-
INTEGER: Uses the input column as containing the true value of the response variable.
-
BOOLEAN: Resolves Yes to 1, 0 to No.
-
CHAR/VARCHAR: Resolves the value specified by parameter
main_classto 1, all other values to 0.
Note
If the input column is of data type INTEGER or BOOLEAN, the function ignores parametermain_class. -
probabilities- A FLOAT input column that contains the predicted probability of response being the main class, set to 1 if
targetsis of type INTEGER.
Parameters
num_binsAn integer value that determines the number of decision boundaries. Decision boundaries are set at equally spaced intervals between 0 and 1, inclusive. The function computes the table at each
num-bin+ 1 point.Default: 100
Greater values result in more precise approximations of the AUC.
AUC- A Boolean value that specifies whether to output the area under the curve (AUC) value.
Default: True
main_classUsed only if
targetsis of type CHAR/VARCHAR, specifies the class to associate with theprobabilitiesargument.
Examples
Execute ROC on input table mtcars. Observed class labels are in column obs, predicted class labels are in column prob:
=> SELECT ROC(obs::int, prob::float USING PARAMETERS num_bins=5, AUC = True) OVER()
    FROM (SELECT am AS obs,
          PREDICT_LOGISTIC_REG (mpg, cyl, disp, drat, wt, qsec, vs, gear, carb
               USING PARAMETERS
                  model_name='myLogisticRegModel', type='probability') AS prob
   FROM mtcars) AS prediction_output;
 decision_boundary | false_positive_rate | true_positive_rate | AUC |comment
-------------------+---------------------+--------------------+-----+-----------------------------------
0                  |                   1 |                  1 |     |
0.5                |                   0 |                  1 |     |
1                  |                   0 |                  0 |   1 | Of 32 rows,32 were used and 0 were ignoreded
(3 rows)
The function returns a table with the following results:
-
decision_boundaryindicates the cut-off point for whether to classify a response as 0 or 1. In each row, ifprobis equal to or greater thandecision_boundary, the response is classified as 1. Ifprobis less thandecision_boundary, the response is classified as 0. -
false_positive_rateshows the percentage of false positives (when 0 is classified as 1) in the correspondingdecision_boundary. -
true_positive_rateshows the percentage of rows that were classified as 1 and also belong to class 1.
10 - RSQUARED
Returns a table with the R-squared value of the predictions in a regression model.
Returns a table with the R-squared value of the predictions in a regression model.
Syntax
RSQUARED ( targets, predictions ) OVER()
Important
TheOVER() clause must be empty.
Arguments
targets- A FLOAT response variable for the model.
predictions- A FLOAT input column that contains the predicted values for the response variable.
Examples
This example shows how to execute the RSQUARED function on an input table named faithful_testing. The observed values of the response variable appear in the column, obs, while the predicted values of the response variable appear in the column, pred.
=> SELECT RSQUARED(obs, prediction) OVER()
     FROM (SELECT eruptions AS obs,
                  PREDICT_LINEAR_REG (waiting
                                       USING PARAMETERS model_name='myLinearRegModel') AS prediction
           FROM faithful_testing) AS prediction_output;
        rsq        |                    comment
-------------------+-----------------------------------------------
 0.801392981147911 | Of 110 rows, 110 were used and 0 were ignored
(1 row)
11 - XGB_PREDICTOR_IMPORTANCE
Measures the importance of the predictors in an XGBoost model.
Measures the importance of the predictors in an XGBoost model. The function outputs three measures of importance for each predictor:
-
frequency: relative number of times the model uses a predictor to split the data. -
total_gain: relative contribution of a predictor to the model based on the total information gain across a predictor's splits. A higher value means more predictive importance. -
avg_gain: relative contribution of a predictor to the model based on the average information gain across a predictor's splits.
The sum of each importance measure is normalized to one across all predictors.
Syntax
XGB_PREDICTOR_IMPORTANCE ( USING PARAMETERS param=value[,...] )
Parameters
model_name- Name of the model, which must be of type
xgb_classifierorxgb_regressor. tree_id- Integer in the range [0,
n-1], wherenis the number of trees inmodel_name, that specifies the tree to process. If you omit this parameter, the function uses all trees in the model to measure predictor importance values.
Privileges
Non-superusers: USAGE privileges on the model
Examples
The following example measures the importance of the predictors in the model 'xgb_iris', an XGBoost classifier model, across all trees:
=> SELECT XGB_PREDICTOR_IMPORTANCE( USING PARAMETERS model_name = 'xgb_iris' );
 predictor_index | predictor_name |     frequency     |     total_gain     |      avg_gain
-----------------+----------------+-------------------+--------------------+--------------------
               0 | sepal_length   |  0.15384615957737 |    0.0183021749937 | 0.0370849960701401
               1 | sepal_width    | 0.215384617447853 | 0.0154729501420881 | 0.0223944615251752
               2 | petal_length   | 0.369230777025223 |  0.607349886817728 |  0.512770753876444
               3 | petal_width    | 0.261538475751877 |  0.358874988046484 |  0.427749788528241
(4 rows)
To sort the predictors by importance values, you can use a nested query with an ORDER BY clause. The following sorts the model predictors by descending avg_gain:
=> SELECT * FROM (SELECT XGB_PREDICTOR_IMPORTANCE( USING PARAMETERS model_name = 'xgb_iris' )) AS importances ORDER BY avg_gain DESC;
 predictor_index | predictor_name |     frequency     |     total_gain     |      avg_gain
-----------------+----------------+-------------------+--------------------+--------------------
               2 | petal_length   | 0.369230777025223 |  0.607349886817728 |  0.512770753876444
               3 | petal_width    | 0.261538475751877 |  0.358874988046484 |  0.427749788528241
               0 | sepal_length   |  0.15384615957737 |    0.0183021749937 | 0.0370849960701401
               1 | sepal_width    | 0.215384617447853 | 0.0154729501420881 | 0.0223944615251752
(4 rows)