This is the multi-page printable view of this section.
Click here to print.
Return to the regular view of this page.
Managing queries using MC
Management Console allows you to view the query plan of an active query or a manually entered query specified by the user.
Management Console allows you to view the query plan of an active query or a manually entered query specified by the user.
-
On the MC Home Page, click the database you want to view the Overview page.
-
Select the Activity tab to view the query activity.
-
Click the Explain tab to access the query plan.
See Working with query plans in MC and Accessing query plans in Management Console for further information.
Management Console provides two options for viewing the query plan: Path Information and Tree Path. For details on each, refer Query plan view options.
Additionally, you can also Viewing projection and column metadata using the MC Explain tab.
See also
1 - About profile data in Management Console
After you profile a specific query, the Management Console Explain page displays profile data like query duration, projection metadata, execution events, optimizer events, and metrics in a pie chart.
After you profile a specific query, the Management Console Explain page displays profile data like query duration, projection metadata, execution events, optimizer events, and metrics in a pie chart.
See the following links for more information on the kinds of profile data you can review on the Management Console Explain page:
1.1 - Projection metadata
To view projection metadata for a specific projection, click the projection name in the EXPLAIN output.
To view projection metadata for a specific projection, click the projection name in the EXPLAIN output. Metadata for that projection opens in a pop-up window.
To view projection data for all projections accessed by that query, click the View Projection Metadata button at the top of the Explain page. The metadata for all projections opens in a new browser window.
Note
If the View Projection Metadata button is not enabled, click Profile to retrieve the profile data, including the projection metadata.
The projection metadata includes the following information:
-
Projection ID
-
Schema name
-
Whether or not it is a superprojection
-
Sort columns
-
IDs of the nodes the projection is stored on
-
Whether or not it is segmented
-
Whether or not it is up to date
-
Whether or not it has statistics
-
Owner name
-
Anchor table name
To display a SQL script that can recreate the projection on a different cluster, click Click to get export data. This script is identical to the output of the EXPORT_OBJECTS function. The SQL script opens in a pop-up window.
Copy and paste the command from this window, and click Close.
1.2 - Query phase duration
This pie chart appears in the upper-right corner of the Query Plan window.
This pie chart appears in the upper-right corner of the Query Plan window. It shows what percentage of total query processing was spent in each phase of processing the query.
The phases included in the pie chart (when applicable) are:
Hover over the slices on the pie chart or over the names of the phases in the box to get additional information. You can see the approximate number of milliseconds (ms) and percentage used during each phase.
Note
The time data in the profile metrics might not match the times in the query phase duration. These times can differ because the query phase duration graph uses the longest execution time for a given phase from all the nodes. Network latency can add more data, which is not taken into account in these calculations.
1.3 - Profile metrics
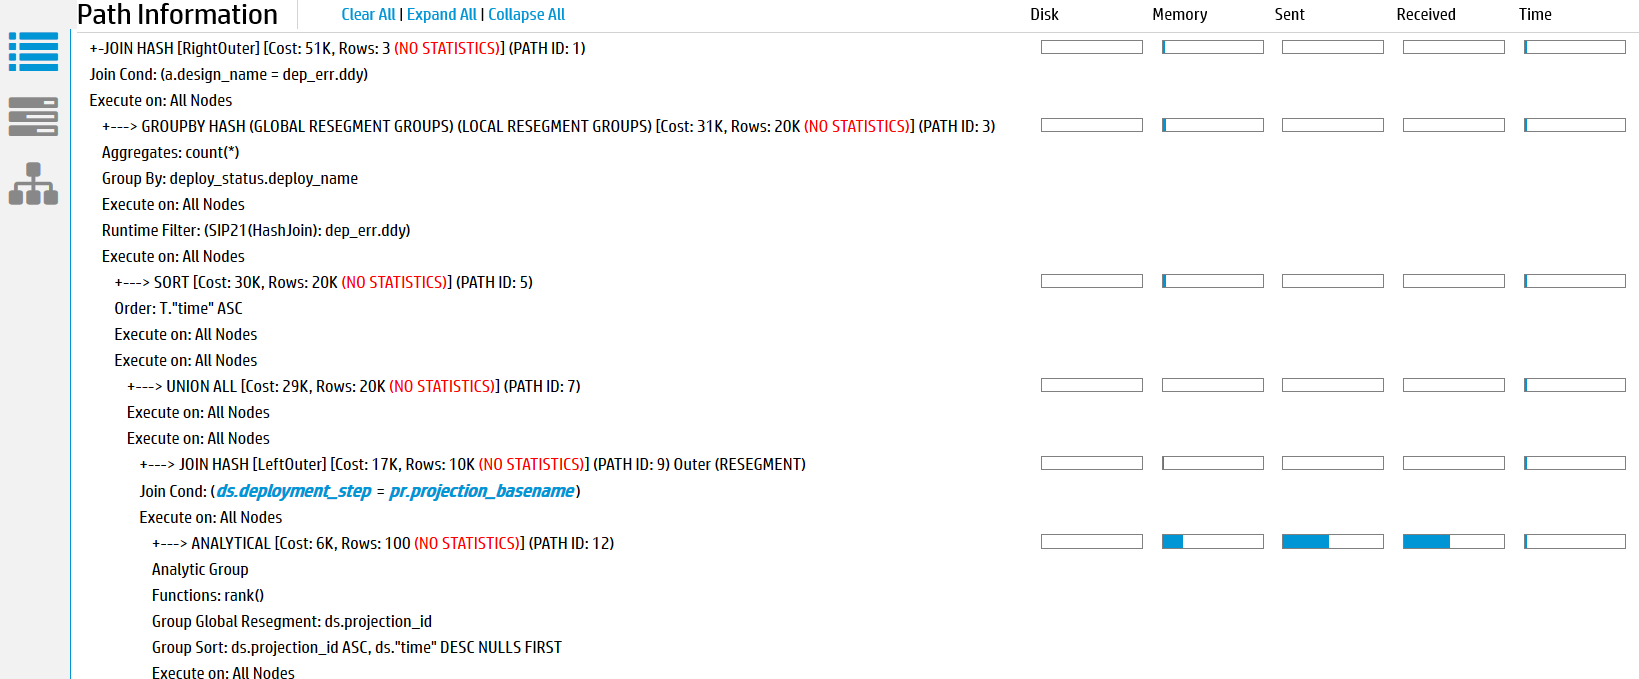
In the Path Information view, the area to the right of each query path contains profile metrics for that path.
In the Path Information view, the area to the right of each query path contains profile metrics for that path.
-
Disk—Bytes of data accessed from disk by each query path. If none of the query paths accessed the disk data, all the values are 0.
-
Memory—Bytes of data accessed from memory by each query path.
-
Sent—Bytes of data sent across the cluster by each query path.
-
Received—Bytes of data received across the cluster by each query path.
-
Time—Number of milliseconds (ms) that the query path took to process on a given node, shown on progress bars. The sum of this data does not match the total time required to execute the query. This mismatch occurs because many tasks are executed in parallel on different nodes.
Hover over the progress bars to get more information, such as total bytes and percentages.
Note
The time data in the profile metrics might not match the times in the
Query phase duration chart. These times can differ because the query phase duration graph uses the longest execution time for a given phase from all the nodes. Network latency can add more data, which is not taken into account in these calculations.
1.4 - Execution events
To help you monitor your database system, Vertica logs significant events that affect database performance and functionality.
To help you monitor your database system, Vertica logs significant events that affect database performance and functionality. Click View Execution Events to see information about the events that took place while the query was executing.
If the View Execution Events button is not enabled, click Profile to retrieve the profile data, including the execution events.
The arrows on the header of each column allow you to sort the table in ascending or descending order of that column.
The execution events are described in the following table.
|
Event Characteristic |
Details |
|
Time |
Clock time when the event took place. |
|
Node Name |
Name of the node for which information is listed. |
|
Session ID |
Identifier of the session for which profile information is captured. |
|
User ID |
Identifier of the user who initiated the query. |
|
Request ID |
Unique identifier of the query request in the user session. |
|
Event Type |
Type of event processed by the execution engine. For a list of events and their descriptions, see Initial process for improving query performance. |
|
Event Description |
Generic description of the event. |
|
Operator Name |
Name of the Execution Engine component that generated the event. Examples include but are not limited to:
-
DataSource
-
DataTarget
-
NetworkSend
-
NetworkRecv
-
StorageUnion
Values from the Operator name and Path ID columns let you tie a query event back to a particular operator in the query plan. If the event did not come from a specific operator, then this column is NULL.
|
|
Path ID |
Unique identifier that Vertica assigns to a query operation or a path in a query plan. If the event did not come from a specific operator, this column is NULL. |
|
Event OID |
A unique ID that identifies the specific event. |
|
Event Details |
A brief description of the event and details pertinent to the specific situation. |
|
Suggested Action |
Recommended actions (if any) to improve query processing. |
1.5 - Optimizer events
To help you monitor your database system, Vertica logs significant events that affect database performance and functionality.Click View Optimizer Events to see a table of the events that took place while the optimizer was planning the query.
To help you monitor your database system, Vertica logs significant events that affect database performance and functionality.Click View Optimizer Events to see a table of the events that took place while the optimizer was planning the query.
If the View Optimizer Events button is not enabled, click Profile to retrieve the profile data, including the optimizer events.
The arrows on the header of each column allow you to sort the table in ascending or descending order of that column.
The following types of optimizer events may appear in the table:
|
Event characteristic |
Details |
|
Time |
Clock time when the event took place. |
|
Node Name |
Name of the node for which information is listed. |
|
Session ID |
Identifier of the session for which profile information is captured. |
|
User ID |
Identifier of the user who initiated the query. |
|
Request ID |
Unique identifier of the query request in the user session. |
|
Event Type |
Type of event processed by the optimizer. |
|
Event Description |
Generic description of the event. |
|
Event OID |
A unique ID that identifies the specific event. |
|
Event Details |
A brief description of the event and details pertinent to the specific situation. |
|
Suggested Action |
Recommended actions (if any) to improve query processing. |
2 - Profiling queries using MC
Management Console allows you to view profile data for a query.
Management Console allows you to view profile data for a query.
-
On the MC Home Page, click the database to view the Overview page.
-
Click the Explain tab to perform tasks related to profiling a query.
See Viewing profile data in MC for further details.
On the Explain tab, you can view the following profile data using MC:
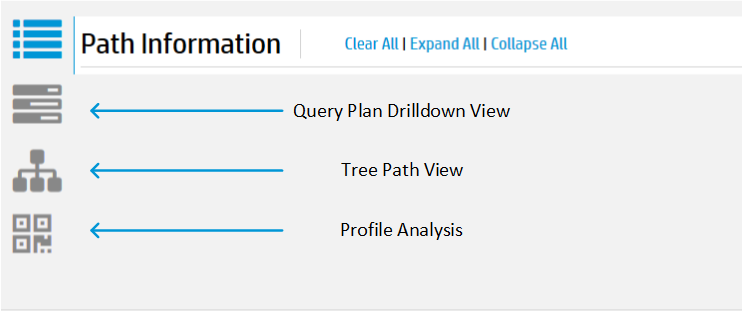
You can use any of the four different formats to view the profile data:
-
Path Information view
-
Query Drilldown view
-
Tree Path view
-
Profile Analysis view
See Viewing different profile outputs for detailed explanation of each view.
Additionally, Management Console supports different color codes for viewing the progress of profiling a query. For an explanation of these color codes, see Monitoring profiling progress.
See also
3 - Viewing profile data in MC
Management Console allows you to view profile data about a single query.
Management Console allows you to view profile data about a single query. You can:
-
Review the profile data in multiple views
-
View details about projection metadata, execution events, and optimizer events
-
Identify how much time was spent in each phase of query execution and which phases took the most amount of time
After you select the database you want to use, you can view the profile data using Management Consolein either of two ways:
- Focus on specific areas of database activity, such as spikes in CPU usage
- Review the profile data for a specific query
To focus on specific areas of database activity:
-
At the bottom of the Management Console window, click the Activity tab.
-
From the list at the top of the page, select Queries.
-
On the activity graph, click the data point that corresponds to the query you want to view.
-
In the View Plan column, click Profile next to the command for which you want to view the query plan. Only certain queries, like SELECT, INSERT, UPDATE, and DELETE, have profile data.
-
In The Explain Plan window, Vertica profiles the query.
-
You can view the output in Path Information view, Query Plan Drilldown view, Tree Path view, or Profile Analysis view. To do so, click the respective buttons on the left of the output box.
To review the profile data for a specific query:
-
In the Explain window, type or paste the query text into the text box. Additionally, you can monitor queries that are currently running. To do so, perform one of the following. In the Find a Query By ID input window:
Caution
If you enter more than one query, Management Console profiles only the first query.
-
To receive periodic updates about the query's progress and resources used, select the Enable Monitoring check box. As a best practice, avoid specifying an interval time of less than 60 seconds because doing so may slow your query's progress.
-
Click the Profile button.
While Vertica is profiling the query, a Cancel Query button is enabled briefly, allowing you to cancel the query and profiling task. If the Cancel Query button is disabled, that means Management Console does not have the proper information to cancel the query or the query is no longer running in the database.
When processing completes, the profile data and metrics display below the text box. You can view the output in Path Information view, Query Plan Drilldown view, Tree Path view , or Profile Analysis view. To do so, click the respective view buttons on the left of the output box.
3.1 - Viewing different profile outputs
Vertica Management Console allows you to examine the results of your query profile in multiple views.
Vertica Management Console allows you to examine the results of your query profile in multiple views. You can view your profile in the following formats:
-
Path Information view
-
Query Drilldown view
-
Tree Path view
-
Profile Analysis view
You can change the query profile output using the icons on the bottom portion of the Explain page.
The Path Information view displays the query plan path along with metric data. If you enable profile monitoring, the data will update at the specified interval. To view metadata for a projection or a column, click the object name in the path output. A pop-up window displays the metadata if it is available.
The Query Plan Drilldown view shows detailed counter information at the node and operator level.
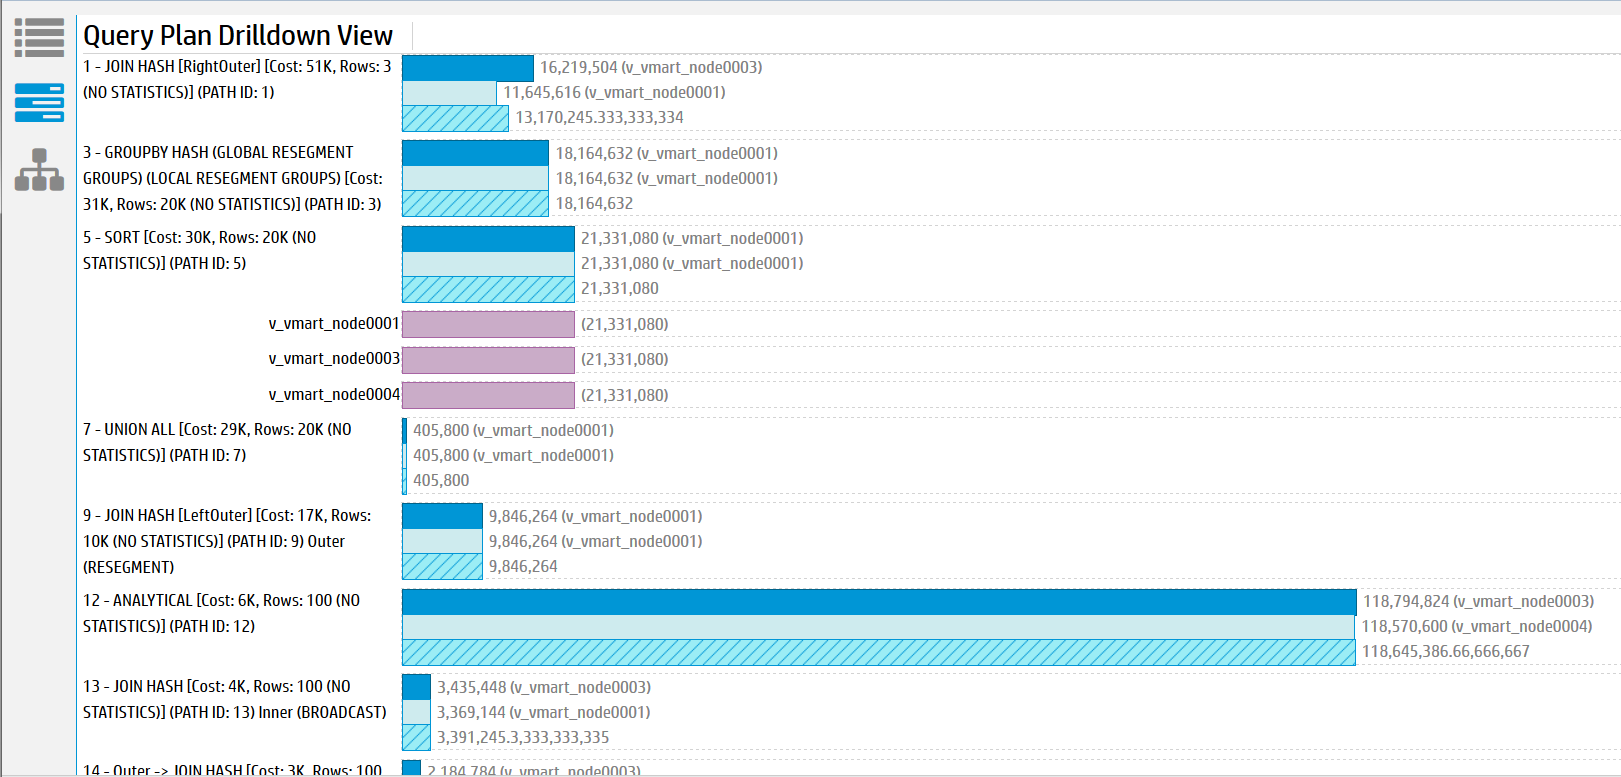
For each path, the path number is listed along with statistical information on the node and operator level. This view allows you to see which nodes are acting as outliers. Click on any of the bars to expand details for that node.
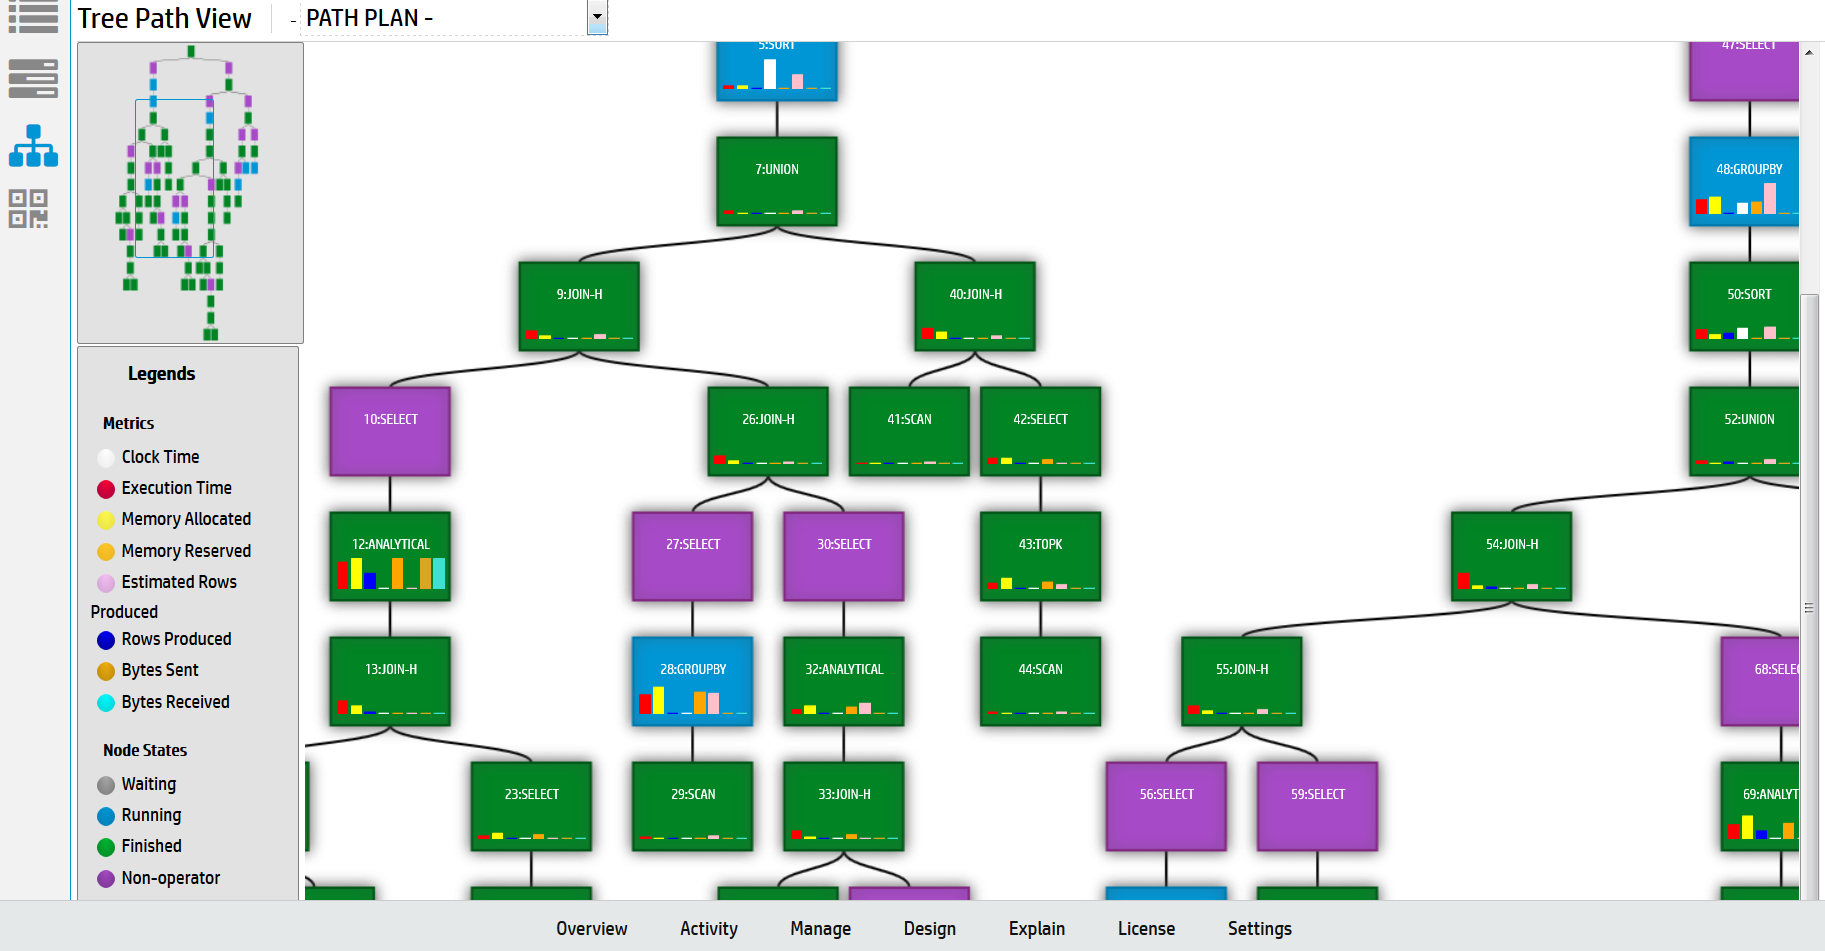
The Tree Path details the query plan in the form of a tree. If you enable monitoring, the state of the path blocks will change depending on whether the path is running, done, or has not started. Metric information is displayed in each path block for the counters you specified in the Profile Settings.
The Profile Analysis view allows you to identify any resource outliers. You can compare the estimated rows produced count with the actual rows produced count, view execution time per path, and identify memory usage per path.
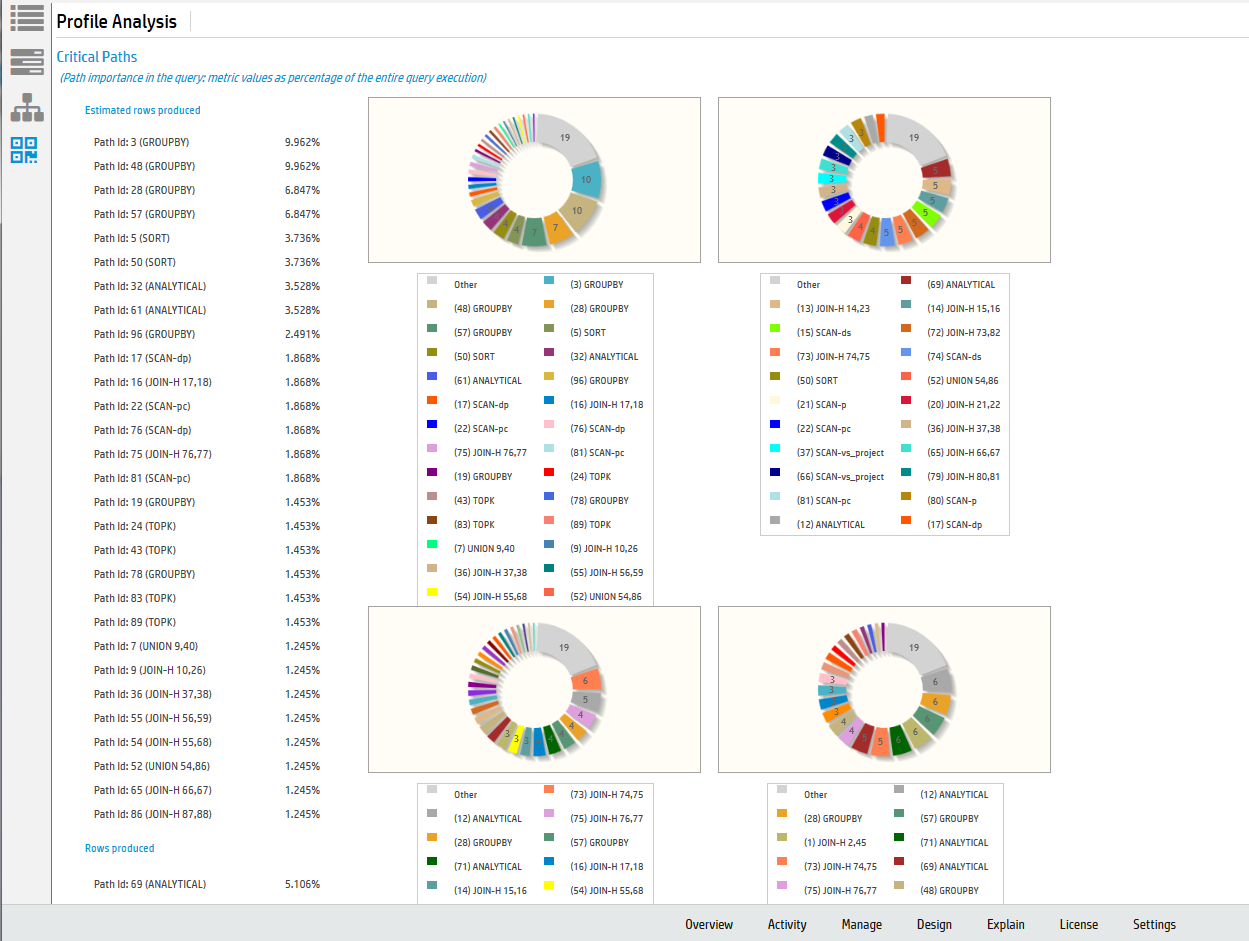
When you profile a query, you will also see a pie chart detailing the query phase duration. You can also view projection metadata, execution events, and optimizer events by clicking on the respective buttons next to the pie chart.
3.2 - Monitoring profiling progress
While loading profile data for a query, Management Console can provide updates about the query's progress and resources used.
While loading profile data for a query, Management Console can provide updates about the query's progress and resources used.
To enable profiling progress updates, select the Enable Monitoring check box when profiling a query. See Viewing Profile Data in Management Console.
The default interval time is 60 seconds. At the specified interval, Management Console displays an updated view of the query's progress. Note that interval times of less than 60 seconds may slow down your query.
Viewing updated profile metrics
At every interval, Management Console displays a new set of profile metrics. You can view these metrics in Path Information view, Query Plan Drilldown view, or Tree view by clicking the respective view buttons on the left of the output box.
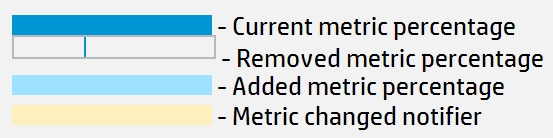
-
A dark blue bar indicates the current metric percentage.
-
When a metric bar has decreased, a dark blue line indicates the previous metric percentage.
-
When a metric bar has increased, a light blue bar indicates the added percentage. The previous percentage appears as a dark blue bar.
-
A metric bar highlighted in yellow indicates it has changed since the last interval.
-
A metric bar highlighted in red indicates the absolute value of the metric has decreased. This typically means Vertica reported the previous value incorrectly, and has readjusted. (For example, if Vertica previously reported path's Time value as 75 seconds, then reports it as 50 seconds at the next interval, the metric bar turns red to indicate the decrease in absolute Time value.)
3.3 - Expanding and collapsing query path profile data
When you have a query on the EXPLAIN window, the profile data displays in the right-hand side of the lower half of the window.
When you have a query on the EXPLAIN window, the profile data displays in the right-hand side of the lower half of the window. The query path information can be lengthy, so you can collapse path information that is uninteresting, or expand paths that you want to focus on.
-
To collapse all the query paths, click Collapse All.
-
To expand all the query paths, click Expand All.
-
To expand an individual query path so you can see details about that step in processing the query, click the first line of the path information. Click the first line again to collapse the path data.
For information about what the profile data means, see About profile data in Management Console.