Managing an Eon Mode database in the cloud
After you provision your cluster and database in the cloud, the screens and techniques you use to monitor the database are the same regardless of the database mode or cluster platform. (Exceptions are noted in the documentation for particular features.)
Using MC to monitor your cluster, you can monitor the nodes in your subcluster, load data, run queries, and perform all other monitoring tasks for subclusters and nodes.
For details about Vertica and the supported cloud providers, see Set up Vertica on the cloud.
Monitoring primary and secondary subclusters
The Cluster > Manage page Database tab lets you monitor your database nodes in visual format. MC supports only the monitoring features on the Database tab, as described in Viewing and managing your cluster.
You can use the Manage > Subclusters tab to monitor your subcluster and nodes:
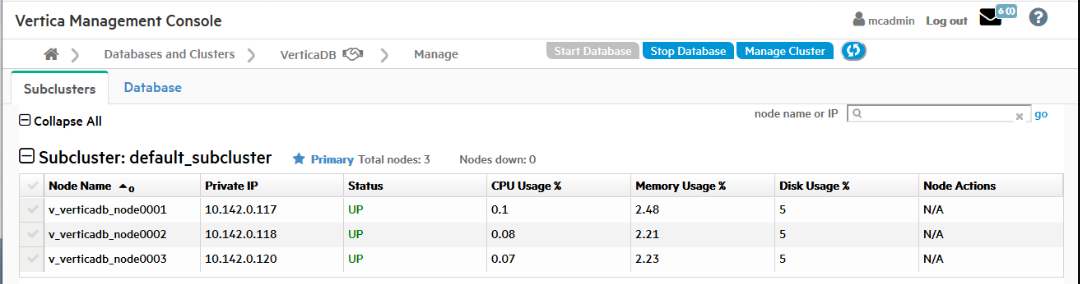
The Subclusters tab displays the following subcluster information:
-
Subcluster name
-
Whether it is primary or secondary
-
Total number of nodes
-
Number of down nodes in that subcluster
In addition, the tab displays the following node information:
-
Node name
-
Private IP address
-
UP or DOWN status
-
CPU
-
Memory
-
Disk usage percentages
-
Available node actions
Searching for nodes
On the Manage > Subclusters tab in MC, you can search for a specific node or group of nodes.
In the node name or IP field above the subcluster:
-
To find a single node, enter a complete node name or IP address.
-
To find a related group of nodes, enter a partial node name or IP address that those nodes share.