This is the multi-page printable view of this section.
Click here to print.
Return to the regular view of this page.
Monitoring database messages and alerts with MC
Management Console periodically checks system health and performance.
Management Console periodically checks system health and performance. When an important event occurs or system performance fluctuates beyond user- or system-defined limits, the Management Console generates a message to alert you about the state of your system. View and manage alerts in the Message Center.
Message alert notifications
Management Console uses multiple methods to communicate alert notifications to ensure that you are immediately aware of any changes to your database that might require attention. You receive message notifications by email, and you can view notifications using the following components:
-
Message envelope icon: This icon is located by the MC Help icon, in the top-right of any database-specific page. Select this icon display the Message Center quick view, and perform archive, read, and delete message actions. For details about message actions and alerts, see Message center.
-
Unread Messages (This Week) widget: On the database Overview tab, this widget is located in the quick stats sidebar. It displays unread, high-priority messages. Select the number (including 0) in the widget to go to the Message Center.
Management Console provides pre-configured alerts to provide system monitoring capabilities without manual setup. Each alert has a pre-configured threshold that defines the acceptable performance limit, and MC sends a message notification when the database exceeds that threshold.
By default, pre-configured alerts are not active and require minimal initial setup. For details on how to set pre-configured alert properties, see Alert configuration.
Node health
Vertica provides the following pre-configured alerts to monitor node health:
-
Node CPU
-
Node Memory
-
Node Disk Usage
-
Node Disk I/O
-
Node CPU I/O Wait
-
Node Reboot Rate
-
Node State Change
-
Node Catalog Memory
Network health
Vertica provides the Network I/O Error pre-configured alert to monitor network health.
Query
Vertica provides the following pre-configured alerts to monitor queries:
-
Queued Query
-
NumberFailed
-
Query Number
-
Spilled Query Number
-
Retried Query Number
-
Query Running Time
License status
Vertica provides the License Usage pre-configured alert to monitor the status of your Vertica license.
Resource pool
MC can send alerts when an individual resource pool reaches a specified state or usage level. For details about resource pool configuration parameters, see Built-in resource pools configuration.
Important
Default settings for resource pool alerts apply to the GENERAL pool only.
You can configure the MC to send the following resource pool alerts:
-
Queries Reaching the Max Allowed Execution Time: Triggers an alert when the specified number of queries reach the RUNTIMECAP execution threshold for the resource pool. You cannot set this alert if the resource pool does not have a RUNTIMECAP threshold set, or if the resource pool has a secondary resource pool.
-
Queries With Resource Rejections: Triggers an alert when the specified number of queries exceed a specified number of resource rejections within a set period of time.
-
Minimum Starting Resource Value: Triggers an alert when the resource pool reaches the minimum amount of resources allocated for the MEMORYSIZE value.
Note
By default, you cannot set MEMORYSIZE for the GENERAL pool. The GENERAL pool must have at least 1GB of memory and it cannot be smaller than 25% of the entire system memory.
-
Maximum Allowed Resource Value: Triggers an alert when the resource pool reaches the MAXMEMORYSIZE value.
-
Ended Query With Queue Time Exceeding Limit: Triggers an alert when the specified number of completed queries were queued for a specified length of time within a timeframe.
-
Ended Query With Run Time Exceeding Limit: Triggers an alert when the specified number of completed queries ran for a specified length of time within a timeframe.
Custom alerts
Create custom alerts to measure system performance metrics that are not monitored by the pre-configured alerts. Create a dynamic SQL query that triggers an alert when it returns any results. You can configure how often an alert is generated, the alert priority, and who receives email alerts. For example, you can create custom alerts that monitor the following:
For details about creating and managing custom alerts, including a tutorial on how to create a custom alert that monitors failed logins, see Custom alerts.
Default notifications
Management Console generates the following messages about the database that appear only in the Message Center:
-
Low disk space
-
Read-only file system
-
Loss of K-safety
-
Current fault tolerance at critical level
-
Too many ROS containers
-
Change in node state
-
Recovery error
-
Recovery failure
-
Recovery lock error
-
Recovery projection retrieval error
-
Refresh error
-
Refresh lock error
-
Workload analyzer operations
-
Tuple Mover error
-
Timer service task error
-
Last Good Epoch (LGE) lag
-
License size compliance
-
License term compliance
Disk space check and cleanup
When the Management Console checks alerts, it generates a result set and saves it to disk. If you use aggressive alert configurations, the result set might use a large amount of disk space. By default, Vertica reserves 500MB of disk space to save result sets.
Vertica checks the free disk space 2 times each day and cleans alerts that are older than 7 days. If the available disk space is low, custom alerts are disabled. Notifications and emails are generated when an alert is disabled due to insufficient disk space.
The /opt/console/vconsole/config/console.properties file contains these settings. Edit the following values to configure the how the MC manages your disk space:
|
Property |
Description |
console.diskspace.threshold |
The amount of disk space Vertica reserves to save result sets.
Default: 500MB
|
customthreshold.alerts.toKeepInDays |
The number of days that alerts are retained on disk.
Default: 7
|
1 - Message center
The Message Center organizes system performance alerts to help you effectively monitor the state of your database.
The Message Center organizes system performance alerts to help you effectively monitor the state of your database. Pre-configured and custom alerts generate messages when the component they measure exceeds the specified threshold.
Access the Message Center in the following ways:
-
On the MC Home page, select Message Center in the MC Tools section.
-
Select the message envelope icon in the top-right of any database-specific page, then select Message Center in the quick view.
-
On the database Overview tab, select the number (including 0) in the Unread Messages (This Week) widget.
The Message Center can retrieve up to 10,000 of the most recent messages generated for a database. By default, it lists up to 600 messages generated in the previous week. For details on how to retrieve messages that predate the previous week, see Date Filtering.
Note
To adjust the maximum number of messages listed in the Message Center, edit the messageCenter.maxEntries value in the /opt/vconsole/config/console.properties file from the command line. For example, the following value increases the number of alerts listed in the Message Center to 5000:
messageCenter.maxEntries=5000
Filter the messages grid
The Management Console provides options that filter the messages that populate the messages grid by database, keyword, message type, and date. Use one or more of these options to view only the messages that you want to manage.
Database filtering
Select Showing to list the databases that are associated with the logged in user account. Choose a specific database to view only messages for that database, or select (All DBs) to view and manage messages across all of your databases.
Keyword filtering
Use the search bar at the top-right of the screen to list messages that contain the entered text. For example, if you enter 29, the grid lists any messages that contain those characters within the message title or message details available when you click the plus (+) icon to expand the message row.
Message type filtering
After you select a value for Showing, the number of messages for that value are totaled and grouped by type near the top-right corner of the screen, below the search bar. These message types use the syslog standard to define severity levels. The MC message types are defined as follows:
-
All Messages: Messages that are not archived or deleted, and are within messageCenter.maxEntries for the previous week.
-
High Priority: Messages that you assigned a High Priority alert priority on the Alerts tab. These messages correspond to syslog levels 0 and 1.
-
Need Attention: Critical or error messages that indicate that correspond to syslog levels 2 and 3.
-
Informational: Warning, notice, informational, or debugging messages that correspond to syslog levels 4, 5, 6, and 7.
To populate the grid with only a single message type, select the number or message type description.
Date filtering
Select Retrieve Older Messages to enter From and To dates to list messages that were generated before the previous week. Vertica stores 10,000 of the most recent database messages so that you can retrieve older messages when necessary.
Message groups
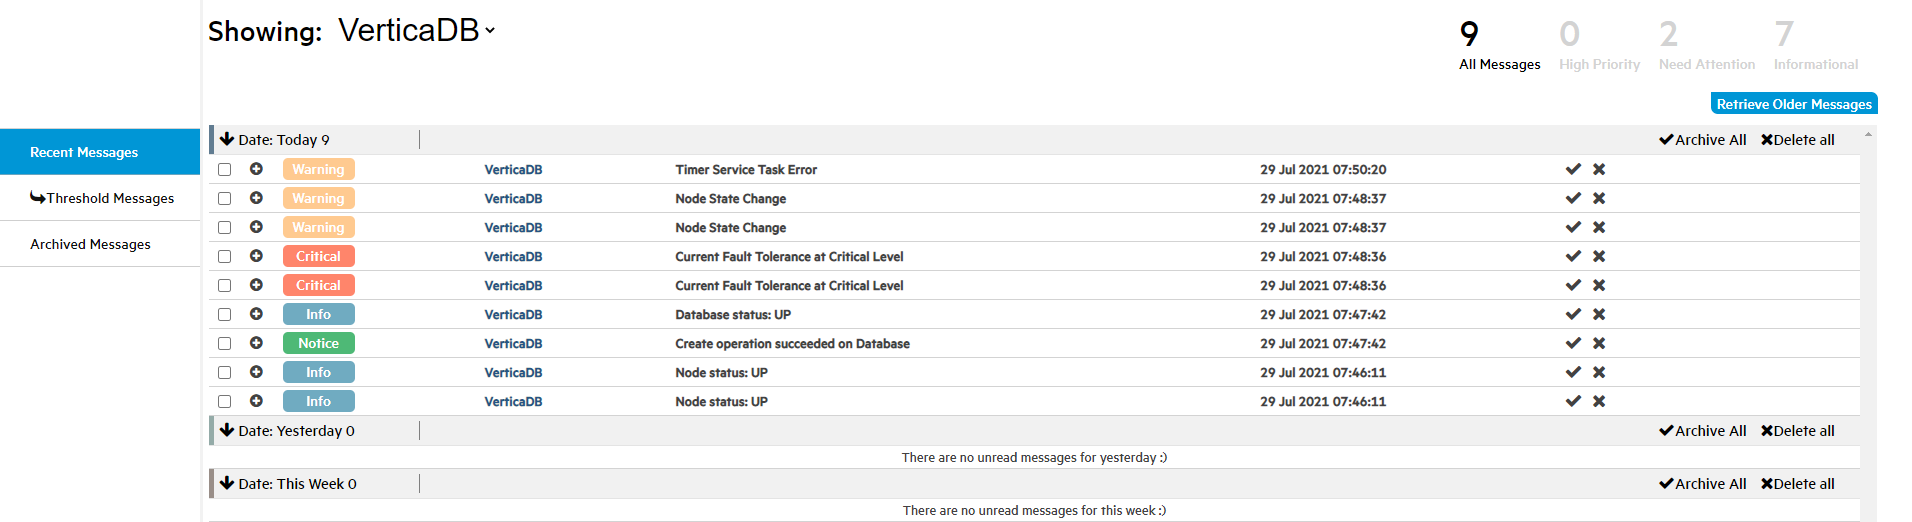
The Message Center groups messages and notifications as Recent Messages, Threshold Messages, and Archived Messages. All message groups use the following priority levels and color codes:
-
Critical (Red)
-
Warning (Orange)
-
Notice (Green)
-
Info (Blue)
Recent messages and threshold messages
Recent Messages include the most recent messages generated within the previous week within the messageCenter.maxEntries value. Threshold messages include messages that are generated when the database exceeds a pre-configured, custom, or default alert threshold.
Recent Messages and Threshold Messages are listed using the message type, database name, a description of the message, and the date and time that the message was generated. Additionally, there are collapsible grid headings that group the alerts by Today, Yesterday, and This Week.
Archived messages
Archived messages are messages that you manually saved for later. When you select the check icon for an individual message or select Archive All, MC marks the message as read and archives it. Archived messages do not have the same date or messageCenter.maxEntries restrictions as Recent Messages or Threshold Messages.
The Archived Messages tab contains the following tools to refine search result filters:
-
Use the From and To boxes above the grid to define a time frame for the archived message search. To combine multiple time frames, select the Do not clear existing search results checkbox.
-
Sort or filter messages even further using the Type, Database Name, Description, and Date columns.
Message actions
Perform actions on all, multiple, or individual messages. To execute actions on all messages at the same time, use the Select All or Select None buttons near the top-right of the screen by the search bar.
Each message row has a checkbox so that you can perform actions on one or more messages simultaneously. Select the plus (+) icon to expand the message row and display the following message details:
For additional information about each message, query EVENT_CONFIGURATIONS.
When you select the X icon or select multiple messages and click the Delete Msgs or Delete all buttons, the message is permanently deleted.
2 - Alert configuration
Enable and customize settings for pre-configured or custom alerts for each database.
Enable and customize settings for pre-configured or custom alerts for each database. For example, you can set the Threshold Value for Node Disk Usage to a 20% minimum or 80% maximum. If any node exceeds either of those thresholds, the MC generates a message and you receive a notification. Take action on alerts in the Message center.
To access the Alerts tab, log in to the Management Console, then select Go to database > Settings > Alerts.
Configurable settings
To configure any alert, you must toggle the switch on the left of the row to the on position. Node State Change is the only pre-configured alert turned on by default. By default, custom alerts are toggled off.
Pre-configued and custom alerts have the following settings:
-
Query variables: Custom alerts only. Query variables are the variables that you added when you created the alert. You must provide a value for each variable. The query variable is not validated after you create the alert. If you update the variable to a value that results in an invalid query, the alert is silently disabled during the next execution.
To view the original SQL query, hover the mouse over the alert name to display the alert in a tooltip.
-
Threshold Value: Pre-configured alerts only. You can add a lower and upper limit on acceptable operating values for the component.
-
Check Interval: This value determines how often Vertica executes the underlying SQL for the alert.
-
Alert Priority: You can assign one of the following priority labels to determine how the alert is distributed:
-
Alert and Critical: Displays the message using the message alert notification mechanisms on the Overview page and creates a message in the Message Center.
-
Warning: Creates a message in the Message center.
-
Alert Email Recipients: Configure email notifications for any alert priority when the alert is triggered. You must have SMPT configured. For details about adding email recipients to alerts, see Custom alerts.
-
Vertical ellipses: For custom alerts and new resource pool alerts, click the vertical ellipses to delete the alert. You must have MC ADMIN role privileges to delete an alert.
Configuring resource pool alerts
Resource pool alerts use the same configurable settings as the other alerts, but you can set alerts per resource pool. By default, pre-configured alerts are set for the GENERAL pool only.
Note
Only users with
MC ADMIN role privileges can add alerts for resource pools other than the GENERAL pool.
-
Log in to the Management Console and select Databases > Settings > Alerts.
-
In the top row labeled Resource Pool, select the blue box with a plus (+) symbol on the far right of the row. When you hover over the button, the button expands and displays Add Resource Pool Alert +.
The New Resource Pool Alert window opens.
-
In Alert Name, choose the alert that you want to add to a resource pool.
-
In Resource Pool, choose the resource pool that you want to add this alert to.
-
When you are finished configuring the remaining settings, select Create Alert.
Edit Check Interval, Alert Priority, and Alert Email Recipients as you would other alerts. For guidance, see Configurable Settings or Custom alerts.
To delete the alert, select the vertical ellipses at the right of the row, and select Delete. You must have MC ADMIN role privileges to delete an alert.
3 - Setting up SMTP for email alerts
Management Console can generate email notifications when your database exceeds high-priority alert thresholds.
Management Console can generate email notifications when your database exceeds high-priority alert thresholds. To receive email alerts, you must configure your SMTP settings in MC.
You must be an administrator to provide SMTP settings. To set up MC to send email:
-
Select the Email Gateway tab on the MC Settings page.
-
Provide the following information about your SMTP server:
-
Email Server (Hostname): the hostname or IP of the SMTP server
-
Port: the port of the SMTP server
-
Session Type: the type of connection to use (e.g. SSL)
-
SMTP Username (optional): the username credential for connecting to the server
-
SMTP Password (optional): the password credential for connecting to the server
-
Sender Address: The sender address for your server when it sends email alerts
-
Trust SSL Certificate: Whether to automatically trust the SMTP server's certificate
-
Click Test at the top of the page. MC validates your SMTP settings and sends a test email to the inbox of the email alias you provided.
-
Verify that you successfully received the test email.
-
Click Apply at the top-right of the page to save the settings.
After you set up SMTP for email, you can configure MC to send high-priority threshold alerts through email. For details, seeAlert configuration or Custom alerts.
4 - Custom alerts
Create custom events-based alerts to track abnormalities and performance fluctuations for node health, queries, and resource pools using your own database schemas and tables.
Create custom events-based alerts to track abnormalities and performance fluctuations for node health, queries, and resource pools using your own database schemas and tables. When the database triggers an active alert, you receive notifications according to the alert priority, and can take action in the Message center.
Creating a custom alert
You must have MC ADMIN role privileges to create a custom alert.
The following steps create a custom alert named Failed logins within a X time period to track the number of failed logins in the previous two hours, per user. This alert might indicate a possible distributed denial-of-service (DDoS) attack, or an application behaving inappropriately. The underlying SQL query uses a variable to create a dynamic threshold value that you can fine-tune after you create the alert.
-
Log in to the Management Console, then select Go to database > Settings > Alerts.
-
In the Custom Alerts row at the top of the page, click the blue box with a plus (+) symbol on the far right of the row. When you hover over the button, the button expands and displays Create Custom Alert +.
The Create custom alert window displays.
-
In Alert Name, enter Failed logins within X time period.
-
In SQL Query, enter the following SQL query:
SELECT
  login_timestamp,
  user_name,
  node_name,
  client_hostname,
  reason
FROM
  login_failures
WHERE
  reason in ('INVALID USER', 'FAILED', 'INVALID DATABASE')
  AND login_timestamp > sysdate - INTERVAL '{{Time_Interval}}'
The AND clause of the preceding query encloses the variable of type String named Time_Interval in double curly braces to represent a valid SQL syntax element.
A variable is a dynamic value that is evaluated at runtime that you can configure after you save the alert. You can add up to 6 variables per custom alert. Variable names may consist of a maximum of 14 alpha-numeric characters, including underscores. Verify that the variable uses the correct data type and format. Variables of type String require single quotes around the curly braces.
A SQL query triggers an alert if it returns one or more rows. Use the formatting or full screen buttons above and to the right of the SQL Query box as needed.
-
A box displays below the SQL Query box containing placeholder text that corresponds to each variable name. To test the alert, enter 2 Hours in this box.
-
Select Run Query. The Query Results section displays any rows returned from your query. Alternatively, you might encounter one of the following issues:
-
If you use invalid SQL syntax, you receive an error.
-
If the query returns more than 5 columns or 100 rows, you receive a warning. Because every query result set is saved to disk, it is important to be aware of the size of your result set. For more information, see Monitoring database messages and alerts with MC.
A long-running query runs until it succeeds or returns a Query Error that indicates that there are insufficient resources to continue. To stop a long-running query, select Cancel Query.
-
When you are satisfied with the query results, select Create Alert.
The Create custom alert window closes and the alert you just created is listed in the Custom Alerts section on the Alerts page. When you point the mouse on the query name, the query is displayed in a tooltip. Under the query name, there are editable boxes that correspond to the variables you added when creating the alert.
-
In the Time_Interval variable box, enter 2 Hours.
-
Select a value for Check Interval. The default setting is 10 minutes. This value determines how often the query is executed.
Important
To prevent the scheduled query from impacting system performance, each query has a default runtime threshold of 30 seconds. If the query runtime exceeds this threshold once, the alert is automatically disabled.
To adjust the timeout threshold, edit the threshold_query.disable_time_out setting in the /opt/vconsole/config/console.properties file.
-
Select a value for Alert Priority. By default, the alert is assigned the Critical value priority.
-
Optionally, select the Manage Emails icon under Alert Email Recipients to send an email alert to specific users when the alert is triggered. To register a user to receive email alerts, complete the steps in Setting up SMTP for email alerts.
-
Complete the following steps in the Manage Email Recipient window:
-
To add an existing user to an alert, click the checkbox beside the existing MC user, or select the box at the top to add all. For non-existing MC users, enter their email address at the bottom of the window.
-
In Email Interval, select how often the email is sent:
For example, if you select One hour, an email is sent every hour, even if the alert is triggered multiple times within the hour.
-
Click Save.
After you create the alert, toggle it on or off using switch at the far left of the alert row.
Editing a custom alert
You must have MC ADMIN role privileges to edit a custom alert.
-
Log in to the Management Console, then select Go to database > Settings > Alerts.
-
In the Custom Alerts row at the top of the page, locate the custom alert that you want to edit.
-
Select the vertical ellipses, and select Edit.
The Edit custom alert window opens and displays the previously saved values for the custom alert.
-
Edit the alert. You can edit any of the following alert properties:
-
Alert Name
-
SQL Query
-
Any variable values
-
Select Run Query. The Query Results section displays any rows returned from your query. Alternatively, you might encounter one of the following issues:
-
If you use invalid SQL syntax, you receive an error.
-
If the query returns more than 5 columns or 100 rows, you receive a warning. Because every query result set is saved to disk, it is important to be aware of the size of your result set. For more information, see Monitoring database messages and alerts with MC.
A long-running query runs until it succeeds or returns a Query Error that indicates that there are insufficient resources to continue. To stop a long-running query, select Cancel Query.
-
When you are satisfied with the query results, select Update Alert.
Deleting an alert
To delete a custom alert, select the vertical ellipses at the right of the row, and select Delete. You must have MC ADMIN role privileges to delete an alert.
5 - Exporting MC-managed database messages and logs
You can export the contents of database messages, log details, query details, and MC user activity to a file.
You can export the contents of database messages, log details, query details, and MC user activity to a file.
Information comes directly from the MC interface. This means that if the last five minutes of vertica.log information displays on the interface, you can save that five minutes of data to a file, not the entire log. When you filter messages or logs, MC exports only the filtered results.
Depending on how you set your browser preferences, when you export messages you can view the output immediately or specify a location to save the file. System-generated file names include a timestamp for uniqueness.
The following table shows, by record type, the MC pages that contain content you can export, the name of the system-generated file, and what that file's output contains:
|
Message type |
Where you can export on MC |
System-generated filename |
Contents of exported file |
|
All db-related message types |
Message Center page |
vertica-alerts-<timestamp>sv |
Exports messages in the Message Center to a .csv file. Message contents are saved under the following headings:
|
|
MC log files |
Diagnostics page |
mconsole-<timestamp>.log |
Exports MC log search results from MC to a ** .log file under the following headings:
|
|
Vertica logs |
Manage page
Double-click any node to get to the details and then click the VerticaLog tab
|
vertica-vertica-<db>-<timestamp>.log |
Exports vertica log search results from MC to a .log file under the following headings:
|
|
Agent logs |
Manage page
Click any node to get to the details and then click the AgentTools Log tab.
|
vertica-agent-<db>-<timestamp>.log |
Exports agent log search results from MC to a .log file under the following headings:
|
|
Query details |
Activity page
Click any query spike in the Queries graph to get to the Detail page.
|
vertica-querydetails-<db>-<timestamp>.dat |
Exports query details for the database between <timestamp> and <timestamp> as a tab-delimited .dat file. Content is saved under the following headings:
-
Query type
-
Session ID
-
Node name
-
Started
-
Elapsed
-
User name
-
Request/Query
|
|
MC user activity |
Diagnostics page
Click the Audit Log task
|
vertica_audit<timestamp>.csv |
Exports MC user-activity results to a .csv file. Content is saved under the following headings:
-
Time
-
MC User
-
Resource
-
Target User
-
Client IP
-
Activity
|