Clustering data hierarchically using bisecting k-means
This bisecting k-means example uses two small data sets named agar_dish_training and agar_dish_testing. Using the numeric data in the agar_dish_training data set, you can cluster the data into k clusters. Then, using the resulting bisecting k-means model, you can run APPLY_BISECTING_KMEANS on agar_dish_testing and assign the data to the clusters created in your trained model. Unlike regular k-means (also provided in Vertica), bisecting k-means allows you to predict with any number of clusters less than or equal to k. So if you train the model with k=5 but later decide to predict with k=2, you do not have to retrain the model; just run APPLY_BISECTING_KMEANS with k=2.
Before you begin the example, load the Machine Learning sample data. For this example, we load agar_dish_training.csv and agar_dish_testing.csv.
Clustering training data into k clusters to train the model
-
Create the bisecting k-means model, named agar_dish_bkmeans, using the agar_dish_training table data.
=> SELECT BISECTING_KMEANS('agar_dish_bkmeans', 'agar_dish_training', '*', 5 USING PARAMETERS exclude_columns='id', key_columns='id', output_view='agar_1_view');
 BISECTING_KMEANS
------------------
 Finished.
(1 row)
This example creates a model named agar_dish_bkmeans and a view containing the results of the model named agar_1_view. You might get slightly different results when you run the clustering algorithm. This is because BISECTING_KMEANS uses random numbers to generate the best clusters.
-
View the output of agar_1_view.
=> SELECT * FROM agar_1_view;
 id  | cluster_id
-----+------------
   2 |          4
   5 |          4
   7 |          4
   9 |          4
...
Here we can see the id of each point in the agar_dish_training table and which cluster it has been assigned to.
-
Because we specified the number of clusters as 5, verify that the function created five clusters by counting the number of data points within each cluster.
=> SELECT cluster_id, COUNT(cluster_id) as Total_count FROM agar_1_view GROUP BY cluster_id;
 cluster_id | Total_count
------------+-------------
          5 |          76
          7 |          73
          8 |          74
          4 |          72
          6 |          80
(5 rows)
You may wonder why the cluster_ids do not start at 0 or 1. The reason is that the bisecting k-means algorithm generates many more clusters than k-means, and then outputs the ones that are needed for the designated value of k. We will see later why this is useful.
You have now successfully clustered the data from
agar_dish_training.csvinto five distinct clusters.
Summarizing your model
View the summary output of agar_dish_bkmeans using the GET_MODEL_SUMMARY function.

```
=> SELECT GET_MODEL_SUMMARY(USING PARAMETERS model_name='agar_dish_bkmeans');
======
BKTree
======
center_id|   x    |   y    | withinss |totWithinss|bisection_level|cluster_size|parent|left_child|right_child
---------+--------+--------+----------+-----------+---------------+------------+------+----------+-----------
    0    |-3.59450|-3.59371|6008.46192|6008.46192 |       0       |    375     |      |    1     |     2
    1    |-6.47574|-6.48280|336.41161 |1561.29110 |       1       |    156     |  0   |    5     |     6
    2    |-1.54210|-1.53574|1224.87949|1561.29110 |       1       |    219     |  0   |    3     |     4
    3    |-2.54088|-2.53830|317.34228 | 665.83744 |       2       |    147     |  2   |    7     |     8
    4    | 0.49708| 0.51116| 12.08355 | 665.83744 |       2       |     72     |  2   |          |
    5    |-7.48119|-7.52577| 12.38904 | 354.80922 |       3       |     76     |  1   |          |
    6    |-5.52057|-5.49197| 12.99436 | 354.80922 |       3       |     80     |  1   |          |
    7    |-1.56238|-1.50561| 12.63924 | 61.31633  |       4       |     73     |  3   |          |
    8    |-3.50616|-3.55703| 11.21015 | 61.31633  |       4       |     74     |  3   |          |


=======
Metrics
=======
                       Measure                       |  Value
-----------------------------------------------------+----------
                Total sum of squares                 |6008.46192
         Total within-cluster sum of squares         | 61.31633
           Between-cluster sum of squares            |5947.14559
Between-cluster sum of squares / Total sum of squares| 98.97950
      Sum of squares for cluster 1, center_id 5      | 12.38904
      Sum of squares for cluster 2, center_id 6      | 12.99436
      Sum of squares for cluster 3, center_id 7      | 12.63924
      Sum of squares for cluster 4, center_id 8      | 11.21015
      Sum of squares for cluster 5, center_id 4      | 12.08355


===========
call_string
===========
bisecting_kmeans('agar_dish_bkmeans', 'agar_dish_training', '*', 5
USING PARAMETERS exclude_columns='id', bisection_iterations=1, split_method='SUM_SQUARES', min_divisible_cluster_size=2, distance_method='euclidean', kmeans_center_init_method='kmeanspp', kmeans_epsilon=0.0001, kmeans_max_iterations=10, output_view=''agar_1_view'', key_columns=''id'')

===============
Additional Info
===============
        Name         |Value
---------------------+-----
   num_of_clusters   |  5
dimensions_of_dataset|  2
num_of_clusters_found|  5
  height_of_BKTree   |  4

(1 row)
```
Here we can see the details of all the intermediate clusters created by bisecting k-means during training, some metrics for evaluating the quality of the clustering (the lower the sum of squares, the better), the specific parameters with which the algorithm was trained, and some general information about the data algorithm.
Clustering testing data using a bisecting k-means model
Using agar_dish_bkmeans, the bisecting k-means model you just created, you can assign the points in agar_dish_testing to cluster centers.
-
Create a table named bkmeans_results, using the agar_dish_testing table as your input table and the agar_dish_bkmeans model for your cluster centers. Add only the relevant feature columns to the arguments in the APPLY_BISECTING_KMEANS function.
=> CREATE TABLE bkmeans_results_k5 AS
        (SELECT id,
                APPLY_BISECTING_KMEANS(x, y
                             USING PARAMETERS
                                              model_name='agar_dish_bkmeans', number_clusters=5) AS cluster_id
         FROM agar_dish_testing);
=> SELECT cluster_id, COUNT(cluster_id) as Total_count FROM bkmeans_results_k5 GROUP BY cluster_id;
 cluster_id | Total_count
------------+-------------
          5 |          24
          4 |          28
          6 |          20
          8 |          26
          7 |          27
(5 rows)
The bkmeans_results_k5 table shows that the agar_dish_bkmeans model correctly clustered the agar_dish_testing data.
-
The real advantage of using bisecting k-means is that the model it creates can cluster data into any number of clusters less than or equal to the k with which it was trained. Now you could cluster the above testing data into 3 clusters instead of 5, without retraining the model:
=> CREATE TABLE bkmeans_results_k3 AS
        (SELECT id,
                APPLY_BISECTING_KMEANS(x, y
                             USING PARAMETERS
                                              model_name='agar_dish_bkmeans', number_clusters=3) AS cluster_id
         FROM agar_dish_testing);
=> SELECT cluster_id, COUNT(cluster_id) as Total_count FROM bkmeans_results_k3 GROUP BY cluster_id;
 cluster_id | Total_count
------------+-------------
          4 |          28
          3 |          53
          1 |          44
(3 rows)
Prediction using the trained bisecting k-means model
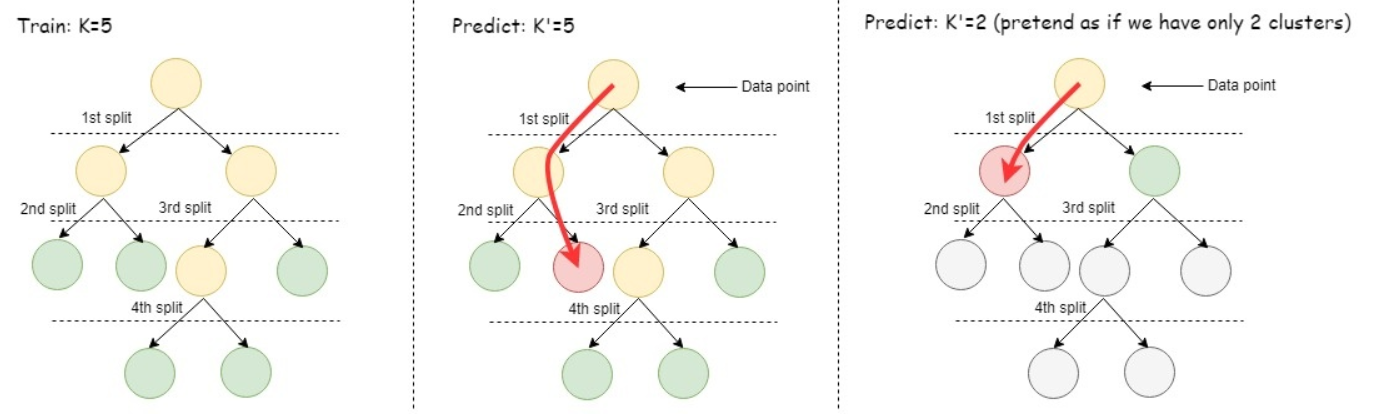
To cluster data using a trained model, the bisecting k-means algorithm starts by comparing the incoming data point with the child cluster centers of the root cluster node. The algorithm finds which of those centers the data point is closest to. Then the data point is compared with the child cluster centers of the closest child of the root. The prediction process continues to iterate until it reaches a leaf cluster node. Finally, the point is assigned to the closest leaf cluster. The following picture gives a simple illustration of the training process and prediction process of the bisecting k-means algorithm. An advantage of using bisecting k-means is that you can predict using any value of k from 2 to the largest k value the model was trained on.
The model in the picture below was trained on k=5. The middle picture shows using the model to predict with k=5, in other words, match the incoming data point to the center with the closest value, in the level of the hierarchy where there are 5 leaf clusters. The picture on the right shows using the model to predict as if k=2, in other words, first compare the incoming data point to the leaf clusters at the level where there were only two clusters, then match the data point to the closer of those two cluster centers. This approach is faster than predicting with k-means.