This is the multi-page printable view of this section.
Click here to print.
Return to the regular view of this page.
Profiling database performance
You can profile database operations to evaluate performance.
You can profile database operations to evaluate performance. Profiling can deliver information such as the following:
-
How much memory and how many threads each operator is allocated.
-
How data flows through each operator at different points in time during query execution.
-
Whether a query is network bound.
Profiling data can help provide valuable input into database design considerations, such as how best to segment and sort projections, or facilitate better distribution of data processing across the cluster.
For example, profiling can show data skew, where some nodes process more data than others. The rows produced counter in system table EXECUTION_ENGINE_PROFILES shows how many rows were processed by each operator. Comparing rows produced across all nodes for a given operator can reveal whether a data skew problem exists.
The topics in this section focus on obtaining profile data with vsql statements. You can also view profiling data in the Management Console.
1 - Enabling profiling
You can enable profiling at three scopes:.
You can enable profiling at three scopes:
Vertica meta-function
SHOW_PROFILING_CONFIG shows whether profiling is enabled at global and session scopes. In the following example, the function shows that profiling is disabled across all categories for the current session, and enabled globally across all categories:
=> SELECT SHOW_PROFILING_CONFIG();
SHOW_PROFILING_CONFIG
------------------------------------------
 Session Profiling: Session off, Global on
 EE Profiling:      Session off, Global on
 Query Profiling:   Session off, Global on
(1 row)
Global profiling
When global profiling is enabled or disabled for a given category, that setting persists across all database sessions. You set global profiling with
ALTER DATABASE, as follows:
ALTER DATABASE db-spec SET profiling-category = {0 | 1}
profiling-category specifies a profiling category with one of the following arguments:
|
Argument |
Data profiled |
GlobalQueryProfiling |
Query-specific information, such as query string and duration of execution, divided between two system tables:
|
GlobalSessionProfiling |
General information about query execution on each node during the current session, stored in system table
SESSION_PROFILES. |
GlobalEEProfiling |
Execution engine data, saved in system tables
QUERY_CONSUMPTION and
EXECUTION_ENGINE_PROFILES. |
For example, the following statement globally enables query profiling on the current (DEFAULT) database:
=> ALTER DATABASE DEFAULT SET GlobalQueryProfiling = 1;
Session profiling
Session profiling can be enabled for the current session, and persists until you explicitly disable profiling, or the session ends. You set session profiling with the following Vertica meta-functions:
profiling-type specifies type of profiling data to enable or disable with one of the following arguments:
|
Argument |
Data profiled |
query |
Query-specific information, such as query string and duration of execution, divided between two system tables:
|
session |
General information about query execution on each node during the current session, stored in system table
SESSION_PROFILES. |
ee |
Execution engine data, saved in system tables
QUERY_CONSUMPTION and
EXECUTION_ENGINE_PROFILES. |
For example, the following statement enables session-scoped profiling for the execution run of each query:
=> SELECT ENABLE_PROFILING('ee');
   ENABLE_PROFILING
----------------------
 EE Profiling Enabled
(1 row)
Statement profiling
You can enable profiling for individual SQL statements by prefixing them with the keyword
PROFILE. You can profile a SELECT statement, or any DML statement such as
INSERT,
UPDATE,
COPY, and
MERGE. For detailed information, see Profiling single statements.
Precedence of profiling scopes
Vertica checks session and query profiling at the following scopes in descending order of precedence:
-
Statement profiling (highest)
-
Sesssion profiling (ignored if global profiling is enabled)
-
Global profiling (lowest)
Regardless of query and session profiling settings, Vertica always saves a minimum amount of profiling data in the pertinent system tables: QUERY_PROFILES, QUERY_PLAN_PROFILES, and SESSION_PROFILES.
For execution engine profiling, Vertica first checks the setting of configuration parameter SaveDCEEProfileThresholdUS. If the query runs longer than the specified threshold (by default, 60 seconds), Vertica gathers execution engine data for that query and saves it to system tables
QUERY_CONSUMPTION and
EXECUTION_ENGINE_PROFILES. Vertica uses profiling settings of other scopes (statement, session, global) only if the query's duration is below the threshold.
Important
To disable or minimize execution engine profiling:
-
Set SaveDCEEProfileThresholdUS to a very high value, up to its maximum value of 2147483647 (231-1, or ~35.79 minutes).
-
Disable profiling at session and global scopes.
2 - Profiling single statements
To profile a single statement, prefix it with PROFILE.
To profile a single statement, prefix it with
PROFILE. You can profile a query (SELECT) statement, or any DML statement such as
INSERT,
UPDATE,
COPY, and
MERGE. The statement returns with a profile summary:
For example:
=> PROFILE SELECT customer_name, annual_income FROM public.customer_dimension
   WHERE (customer_gender, annual_income) IN (SELECT customer_gender, MAX(annual_income)
   FROM public.customer_dimension GROUP BY customer_gender);NOTICE 4788:  Statement is being profiled
HINT:  Select * from v_monitor.execution_engine_profiles where transaction_id=45035996274760535 and statement_id=1;
NOTICE 3557:  Initiator memory for query: [on pool general: 2783428 KB, minimum: 2312914 KB]
NOTICE 5077:  Total memory required by query: [2783428 KB]
  customer_name   | annual_income
------------------+---------------
 James M. McNulty |        999979
 Emily G. Vogel   |        999998
(2 rows)
You can use the profile identifiers transaction_id and statement_id to obtain detailed profile information for this query from system tables
EXECUTION_ENGINE_PROFILES and
QUERY_PLAN_PROFILES. You can also use these identifiers to obtain resource consumption data from system table
QUERY_CONSUMPTION.
For example:
=> SELECT path_id, path_line::VARCHAR(68), running_time FROM v_monitor.query_plan_profiles
    WHERE transaction_id=45035996274760535 AND statement_id=1 ORDER BY path_id, path_line_index;
 path_id |                              path_line                               |  running_time
---------+----------------------------------------------------------------------+-----------------
       1 | +-JOIN HASH [Semi] [Cost: 631, Rows: 25K (NO STATISTICS)] (PATH ID:  | 00:00:00.052478
       1 | |  Join Cond: (customer_dimension.customer_gender = VAL(2)) AND (cus |
       1 | |  Materialize at Output: customer_dimension.customer_name           |
       1 | |  Execute on: All Nodes                                             |
       2 | | +-- Outer -> STORAGE ACCESS for customer_dimension [Cost: 30, Rows | 00:00:00.051598
       2 | | |      Projection: public.customer_dimension_b0                    |
       2 | | |      Materialize: customer_dimension.customer_gender, customer_d |
       2 | | |      Execute on: All Nodes                                       |
       2 | | |      Runtime Filters: (SIP1(HashJoin): customer_dimension.custom |
       4 | | | +---> GROUPBY HASH (GLOBAL RESEGMENT GROUPS) (LOCAL RESEGMENT GR | 00:00:00.050566
       4 | | | |      Aggregates: max(customer_dimension.annual_income)         |
       4 | | | |      Group By: customer_dimension.customer_gender              |
       4 | | | |      Execute on: All Nodes                                     |
       5 | | | | +---> STORAGE ACCESS for customer_dimension [Cost: 30, Rows: 5 | 00:00:00.09234
       5 | | | | |      Projection: public.customer_dimension_b0                |
       5 | | | | |      Materialize: customer_dimension.customer_gender, custom |
       5 | | | | |      Execute on: All Nodes                                   |
(17 rows)
3 - Labeling statements
To quickly identify queries and other operations for profiling and debugging purposes, include the LABEL hint.
To quickly identify queries and other operations for profiling and debugging purposes, include the LABEL hint.
LABEL hints are valid in the following statements:
For example:
SELECT /*+label(myselectquery)*/ COUNT(*) FROM t;
INSERT /*+label(myinsertquery)*/ INTO t VALUES(1);
After you add a label to one or more statements, query the QUERY_PROFILES system table to see which queries ran with your supplied labels. The QUERY_PROFILES system table IDENTIFIER column returns the user-defined label that you previously assigned to a statement. You can also obtain other query-specific data that can be useful for querying other system tables, such as transaction IDs.
For example:
=> SELECT identifier, query FROM query_profiles;
     identifier | query
 ---------------+-----------------------------------------------------------
  myselectquery | SELECT /*+label(myselectquery)*/ COUNT(*) FROM t;
  myinsertquery | INSERT /*+label(myinsertquery)*/ INTO t VALUES(1);
  myupdatequery | UPDATE /*+label(myupdatequery)*/ t SET a = 2 WHERE a = 1;
  mydeletequery | DELETE /*+label(mydeletequery)*/ FROM t WHERE a = 1;
                | SELECT identifier, query from query_profiles;
(5 rows)
4 - Real-time profiling
You can monitor long-running queries while they execute by querying system table EXECUTION_ENGINE_PROFILES.
You can monitor long-running queries while they execute by querying system table
EXECUTION_ENGINE_PROFILES. This table contains available profiling counters for internal operations and user statements. You can use the Linux watch command to query this table at frequent intervals.
Queries for real-time profiling data require a transaction ID. If the transaction executes multiple statements, the query also requires a statement ID to identify the desired statement. If you profile individual queries, the query returns with the statement's transaction and statement IDs. You can also obtain transaction and statement IDs from the
SYSTEM_SESSIONS system table.
Profiling counters
The
EXECUTION_ENGINE_PROFILES system table contains available profiling counters for internal operations and user statements. Real-time profiling counters are available for all statements while they execute, including internal operations such as mergeout, recovery, and refresh. Unless you explicitly enable profiling using the keyword PROFILE on a specific SQL statement, or generally enable profiling for the database and/or the current session, profiling counters are unavailable after the statement completes.
Useful counters include:
You can view all available counters by querying
EXECUTION_ENGINE_PROFILES:
=> SELECT DISTINCT(counter_name) FROM EXECUTION_ENGINE_PROFILES;
To monitor the profiling counters, you can run a command like the following using a retrieved transaction ID (a000000000027):
=> SELECT * FROM execution_engine_profiles
   WHERE TO_HEX(transaction_id)='a000000000027'
   AND counter_name = 'execution time (us)'
   ORDER BY node_name, counter_value DESC;
The following example finds operators with the largest execution time on each node:
=> SELECT node_name, operator_name, counter_value execution_time_us FROM V_MONITOR.EXECUTION_ENGINE_PROFILES WHERE counter_name='execution time (us)' LIMIT 1 OVER(PARTITION BY node_name ORDER BY counter_value DESC);
    node_name     | operator_name | execution_time_us
------------------+---------------+-------------------
 v_vmart_node0001 | Join          |            131906
 v_vmart_node0002 | Join          |            227778
 v_vmart_node0003 | NetworkSend   |            524080
(3 rows)
Linux watch command
You can use the Linux watch command to monitor long-running queries at frequent intervals. Common use cases include:
-
Observing executing operators within a query plan on each Vertica cluster node.
-
Monitoring workloads that might be unbalanced among cluster nodes—for example, some nodes become idle while others are active. Such imbalances might be caused by data skews or by hardware issues.
In the following example, watch queries operators with the largest execution time on each node. The command specifies to re-execute the query each second:
watch -n 1 -d "vsql VMart -c\"SELECT node_name, operator_name, counter_value execution_time_us
FROM v_monitor.execution_engine_profiles WHERE counter_name='execution time (us)'
LIMIT 1 OVER(PARTITION BY node_name ORDER BY counter_value DESC);

Every 1.0s: vsql VMart -c"SELECT node_name, operator_name, counter_value execution_time_us FROM v_monitor.execu...  Thu Jan 21 15:00:44 2016

    node_name     | operator_name | execution_time_us
------------------+---------------+-------------------
 v_vmart_node0001 | Root          |            110266
 v_vmart_node0002 | UnionAll      |             38932
 v_vmart_node0003 | Scan          |             22058
(3 rows)
5 - Profiling query resource consumption
Vertica collects data on resource usage of all queries—including those that fail—and summarizes this data in system table QUERY_CONSUMPTION.
Vertica collects data on resource usage of all queries—including those that fail—and summarizes this data in system table
QUERY_CONSUMPTION. This data includes the following information about each query:
-
Wall clock duration
-
CPU cycles consumed
-
Memory reserved and allocated
-
Network bytes sent and received
-
Disk bytes read and written
-
Bytes spilled
-
Threads allocated
-
Rows output to client
-
Rows read and written
You can obtain information about individual queries through their transaction and statement IDs. Columns TRANSACTION_ID and STATEMENT_ID provide a unique key to each query statement.
Note
One exception applies: a query with multiple plans has a record for each plan.
For example, the following query is profiled:
=> PROFILE SELECT pd.category_description AS 'Category', SUM(sf.sales_quantity*sf.sales_dollar_amount) AS 'Total Sales'
     FROM store.store_sales_fact sf
     JOIN public.product_dimension pd ON pd.product_version=sf.product_version AND pd.product_key=sf.product_key
     GROUP BY pd.category_description;
NOTICE 4788:  Statement is being profiled
HINT:  Select * from v_monitor.execution_engine_profiles where transaction_id=45035996274751822 and statement_id=1;
NOTICE 3557:  Initiator memory for query: [on pool general: 256160 KB, minimum: 256160 KB]
NOTICE 5077:  Total memory required by query: [256160 KB]
             Category             | Total Sales
----------------------------------+-------------
 Non-food                         |  1147919813
 Misc                             |  1158328131
 Medical                          |  1155853990
 Food                             |  4038220327
(4 rows)
You can use the transaction and statement IDs that Vertica returns to get profiling data from QUERY_CONSUMPTION—for example, the total number of bytes sent over the network for a given query:
=> SELECT NETWORK_BYTES_SENT FROM query_consumption WHERE transaction_id=45035996274751822 AND statement_id=1;
 NETWORK_BYTES_SENT
--------------------
             757745
(1 row)
Note
QUERY_CONSUMPTION saves data from all queries, whether explicitly profiled or not.
QUERY_CONSUMPTION versus EXECUTION _ENGINE_PROFILES
QUERY_CONSUMPTION includes data that it rolls up from counters in
EXECUTION_ENGINE_PROFILES. In the previous example, NETWORK_BYTES_SENT rolls up data that is accessible through multiple counters in EXECUTION_ENGINE_PROFILES. The equivalent query on EXECUTION_ENGINE_PROFILES looks like this:
=> SELECT operator_name, counter_name, counter_tag, SUM(counter_value) FROM execution_engine_profiles
     WHERE transaction_id=45035996274751822 AND statement_id=1 AND counter_name='bytes sent'
     GROUP BY ROLLUP (operator_name, counter_name, counter_tag) ORDER BY 1,2,3, GROUPING_ID();
 operator_name | counter_name |          counter_tag           |  SUM
---------------+--------------+--------------------------------+--------
 NetworkSend   | bytes sent   | Net id 1000 - v_vmart_node0001 | 252471
 NetworkSend   | bytes sent   | Net id 1000 - v_vmart_node0002 | 251076
 NetworkSend   | bytes sent   | Net id 1000 - v_vmart_node0003 | 253717
 NetworkSend   | bytes sent   | Net id 1001 - v_vmart_node0001 |    192
 NetworkSend   | bytes sent   | Net id 1001 - v_vmart_node0002 |    192
 NetworkSend   | bytes sent   | Net id 1001 - v_vmart_node0003 |      0
 NetworkSend   | bytes sent   | Net id 1002 - v_vmart_node0001 |     97
 NetworkSend   | bytes sent   |                                | 757745
 NetworkSend   |              |                                | 757745
               |              |                                | 757745
(10 rows)
QUERY_CONSUMPTION and EXECUTION_ENGINE_PROFILES also differ as follows:
-
QUERY_CONSUMPTION saves data from all queries, no matter their duration or whether they are explicitly profiled. It also includes data on unsuccessful queries.
-
EXECUTION_ENGINE_PROFILES only includes data from queries whose length of execution exceeds a set threshold, or that you explicitly profile. It also excludes data of unsuccessful queries.
6 - Profiling query plans
To monitor real-time flow of data through a query plan and its individual , query the following system tables:.
To monitor real-time flow of data through a query plan and its individual paths, query the following system tables:
EXECUTION_ENGINE_PROFILES and
QUERY_PLAN_PROFILES. These tables provides data on how Vertica executed a query plan and its individual paths:
Each query plan path has a unique ID, as shown in the following
EXPLAIN output fragment.
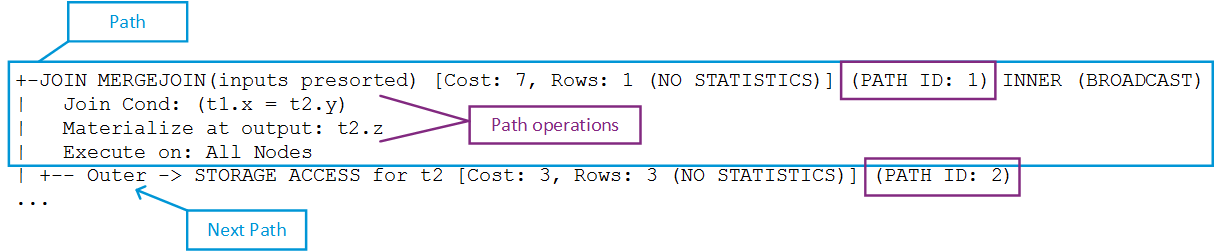
Both tables provide path-specific data. For example, QUERY_PLAN_PROFILES provides high-level data for each path, which includes:
-
Length of a query operation execution
-
How much memory that path's operation consumed
-
Size of data sent/received over the network
For example, you might observe that a GROUP BY HASH operation executed in 0.2 seconds using 100MB of memory.
Requirements
Real-time profiling minimally requires the ID of the transaction to monitor. If the transaction includes multiple statements, you also need the statement ID. You can get statement and transaction IDs by issuing
PROFILE on the query to profile. You can then use these identifiers to query system tables EXECUTION_ENGINE_PROFILES and QUERY_PLAN_PROFILES.
For more information, see Profiling single statements.
6.1 - Getting query plan status for small queries
Real-time profiling counters, stored in system table EXECUTION_ENGINE_PROFILES, are available for all currently executing statements, including internal operations, such as a .
Real-time profiling counters, stored in system table
EXECUTION_ENGINE_PROFILES, are available for all currently executing statements, including internal operations, such as a mergeout.
Profiling counters are available after query execution completes, if any one of the following conditions is true:
-
The query was run via the
PROFILE command
-
Systemwide profiling is enabled by Vertica meta-function
ENABLE_PROFILING.
-
The query ran more than two seconds.
Profiling counters are saved in system table EXECUTION_ENGINE_PROFILES until the storage quota is exceeded.
For example:
-
Profile the query to get transaction_id and statement_id from from EXECUTION_ENGINE_PROFILES. For example:
=> PROFILE SELECT * FROM t1 JOIN t2 ON t1.x = t2.y;
NOTICE 4788:  Statement is being profiled
HINT:  Select * from v_monitor.execution_engine_profiles where transaction_id=45035996273955065 and statement_id=4;
NOTICE 3557:  Initiator memory for query: [on pool general: 248544 KB, minimum: 248544 KB]
NOTICE 5077:  Total memory required by query: [248544 KB]
 x | y |   z
---+---+-------
 3 | 3 | three
(1 row)
-
Query system table
QUERY_PLAN_PROFILES.
Note
For best results, sort on columns transaction_id, statement_id, path_id, and path_line_index.
=> SELECT ... FROM query_plan_profiles
     WHERE transaction_id=45035996273955065 and statement_id=4;
     ORDER BY transaction_id, statement_id, path_id, path_line_index;
6.2 - Getting query plan status for large queries
Real-time profiling is designed to monitor large (long-running) queries.
Real-time profiling is designed to monitor large (long-running) queries. Take the following steps to monitor plans for large queries:
-
Get the statement and transaction IDs for the query plan you want to profile by querying system table
CURRENT_SESSION:
=> SELECT transaction_id, statement_id from current_session;
  transaction_id   | statement_id
-------------------+--------------
 45035996273955001 |            4
(1 row)
-
Run the query:
=> SELECT * FROM t1 JOIN t2 ON x=y JOIN ext on y=z;
-
Query system table
QUERY_PLAN_PROFILES, and sort on the transaction_id, statement_id, path_id, and path_line_index columns.
=> SELECT ... FROM query_plan_profiles WHERE transaction_id=45035996273955001 and statement_id=4
   ORDER BY transaction_id, statement_id, path_id, path_line_index;
You can also use the Linux watch command to monitor long-running queries (see Real-time profiling).
Example
The following series of commands creates a table for a long-running query and then queries system table QUERY_PLAN_PROFILES:
-
Create table longq:
=> CREATE TABLE longq(x int);
CREATE TABLE
=> COPY longq FROM STDIN;
Enter data to be copied followed by a newline.
End with a backslash and a period on a line by itself.
>> 1
>> 2
>> 3
>> 4
>> 5
>> 6
>> 7
>> 8
>> 9
>> 10
>> \.
=> INSERT INTO longq SELECT f1.x+f2.x+f3.x+f4.x+f5.x+f6.x+f7.x
      FROM longq f1
      CROSS JOIN longq f2
      CROSS JOIN longq f3
      CROSS JOIN longq f4
      CROSS JOIN longq f5
      CROSS JOIN longq f6
      CROSS JOIN longq f7;
  OUTPUT
----------
 10000000
(1 row)
=> COMMIT;
COMMIT
-
Suppress query output on the terminal window by using the vsql \o command:
=> \o /home/dbadmin/longQprof
-
Query the new table:
=> SELECT * FROM longq;
-
Get the transaction and statement IDs:
=> SELECT transaction_id, statement_id from current_session;
  transaction_id   | statement_id
-------------------+--------------
 45035996273955021 |            4
(1 row)
-
Turn off the \o command so Vertica continues to save query plan information to the file you specified. Alternatively, leave it on and examine the file after you query system table QUERY_PLAN_PROFILES.
=> \o
-
Query system table QUERY_PLAN_PROFILES:
=> SELECT
     transaction_id,
     statement_id,
     path_id,
     path_line_index,
     is_executing,
     running_time,
     path_line
   FROM query_plan_profiles
   WHERE transaction_id=45035996273955021 AND statement_id=4
   ORDER BY transaction_id, statement_id, path_id, path_line_index;
6.3 - Improving readability of QUERY_PLAN_PROFILES output
Output from the QUERY_PLAN_PROFILES table can be very wide because of the path_line column.
Output from the
QUERY_PLAN_PROFILES table can be very wide because of the path_line column. To facilitate readability, query QUERY_PLAN_PROFILES using one or more of the following options:
-
Sort output by transaction_id, statement_id, path_id, and path_line_index:
=> SELECT ... FROM query_plan_profiles
     WHERE ...
    ORDER BY transaction_id, statement_id, path_id, path_line_index;
-
Use column aliases to decrease column width:
=> SELECT statement_id AS sid, path_id AS id, path_line_index AS order,
     is_started AS start, is_completed AS end, is_executing AS exe,
     running_time AS run, memory_allocated_bytes AS mem,
     read_from_disk_bytes AS read, received_bytes AS rec,
     sent_bytes AS sent, FROM query_plan_profiles
     WHERE transaction_id=45035996273910558 AND statement_id=3
     ORDER BY transaction_id, statement_id, path_id, path_line_index;
-
Use the vsql \o command to redirect
EXPLAIN output to a file:
=> \o /home/dbadmin/long-queries
=> EXPLAIN SELECT * FROM customer_dimension;
=> \o
6.4 - Managing query profile data
Vertica retains data for queries until the storage quota for the table is exceeded, when it automatically purges the oldest queries to make room for new ones.
Vertica retains data for queries until the storage quota for the table is exceeded, when it automatically purges the oldest queries to make room for new ones. You can also clear profiled data by calling one of the following functions:
-
CLEAR_PROFILING clears profiled data from memory. For example, the following command clears profiling for general query-run information, such as the query strings used and the duration of queries.
=> SELECT CLEAR_PROFILING('query');
-
CLEAR_DATA_COLLECTOR clears all memory and disk records on the Data Collector tables and functions and resets collection statistics in system table DATA_COLLECTOR.
-
FLUSH_DATA_COLLECTOR waits until memory logs are moved to disk and then flushes the Data Collector, synchronizing the DataCollector log with the disk storage.
Configuring data retention policies
Vertica retains the historical data it gathers as specified by the configured retention policies.
6.5 - Analyzing suboptimal query plans
If profiling uncovers a suboptimal query, invoking one of the following functions might help:.
If profiling uncovers a suboptimal query, invoking one of the following functions might help:
-
ANALYZE_WORKLOAD analyzes system information held in system tables and provides tuning recommendations that are based on a combination of statistics, system and data collector events, and database-table-projection design.
-
ANALYZE_STATISTICS collects and aggregates data samples and storage information from all nodes that store projections associated with the specified table or column.
You can also run your query through the Database Designer. See Incremental Design.
7 - Sample views for counter information
The EXECUTION_ENGINE_PROFILES table contains the data for each profiling counter as a row within the table.
The EXECUTION_ENGINE_PROFILES table contains the data for each profiling counter as a row within the table. For example, the execution time (us) counter is in one row, and the rows produced counter is in a second row. Since there are many different profiling counters, many rows of profiling data exist for each operator. Some sample views are installed by default to simplify the viewing of profiling counters.
Running scripts to create the sample views
The following script creates the v_demo schema and places the views in that schema.
/opt/vertica/scripts/demo_eeprof_view.sql
Viewing counter values using the sample views
There is one view for each of the profiling counters to simplify viewing of a single counter value. For example, to view the execution time for all operators, issue the following command from the database:
=> SELECT * FROM v_demo.eeprof_execution_time_us;
To view all counter values available for all profiled queries:
=> SELECT * FROM v_demo.eeprof_counters;
To select all distinct operators available for all profiled queries:
=> SELECT * FROM v_demo.eeprof_operators;
Combining sample views
These views can be combined:
=> SELECT * FROM v_demo.eeprof_execution_time_us
    NATURAL LEFT OUTER JOIN v_demo.eeprof_rows_produced;
To view the execution time and rows produced for a specific transaction and statement_id ranked by execution time on each node:
=> SELECT * FROM v_demo.eeprof_execution_time_us_rank
    WHERE transaction_id=45035996273709699
    AND statement_id=1
    ORDER BY transaction_id, statement_id, node_name, rk;
To view the top five operators by execution time on each node:
=> SELECT * FROM v_demo.eeprof_execution_time_us_rank
    WHERE transaction_id=45035996273709699
    AND statement_id=1 AND rk<=5
    ORDER BY transaction_id, statement_id, node_name, rk;