This is the multi-page printable view of this section.
Click here to print.
Return to the regular view of this page.
Working with query plans in MC
Management Console can show you a query plan in easy-to-read format, where you can review the optimizer's strategy for executing a specific query.
Management Console can show you a query plan in easy-to-read format, where you can review the optimizer's strategy for executing a specific query. You can view a query plan in either of two ways:
Access the plan of an active query
-
At the bottom of the Management Console window, click the Activity tab.
-
From the list at the top of the page, select Queries.
-
On the activity graph, click the data point that corresponds to the query you want to view.
-
In the View Plan column, click Explain next to the command for which you want to view the query plan. Only certain queries use query plans—for example, SELECT, INSERT, DELETE, and UPDATE.
-
In the Explain Plan window, click Explain. Vertica generates the query plan.
-
(Optional) View the output in Path Information view or Tree Path view. To do so, click the respective view buttons on the left of the output box.
Access the plan for a specific query
-
Locate the query for which you want to see the query plan in either of the following ways:
-
Queries Not Running — In the Explain window, type or paste the query text into the text box.
-
Queries Currently Running — In the Find a Query By ID input window, perform one of the following actions:
Caution
Entering the word EXPLAIN before the query results in a syntax error.
-
Click Explain. Vertica generates the plan.
If the query is invalid, Management Console highlights in red the parts of your query that might have caused a syntax error.
-
(Optional) View the output in Path Information view or Tree Path view. To do so, click the respective view buttons on the left of the output box.
1 - Accessing query plans in Management Console
You can access query plans in Management Console in two ways:.
You can access query plans in Management Console in two ways:
-
In the Detail page for query-related charts on the database's Activity page, click Explain next to a query to view a plan for that query.
-
Enter a query manually on the Explain page and click Explain Plan.
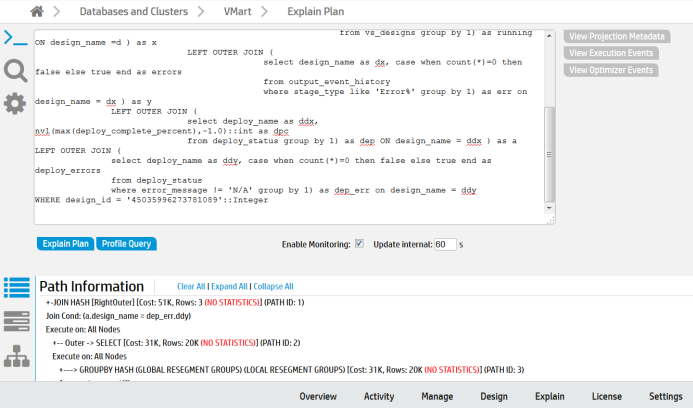
In both cases, the following window opens:
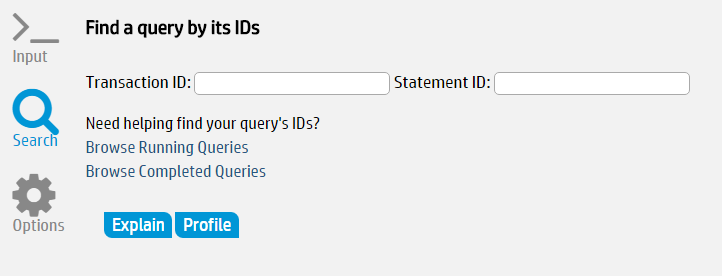
You can also enter the transaction ID and statement ID or browse running or completed queries in the Find a Query input window:
In the output window, you can perform the following tasks related to the query you entered:
2 - Query plan view options
Vertica Management Console provides two views for displaying query plans:.
Vertica Management Console provides two views for displaying query plans:
-
Path Information
-
Tree Path
Note
Query Plan Drilldown and Profile Analysis output views are only available when you run
PROFILE.
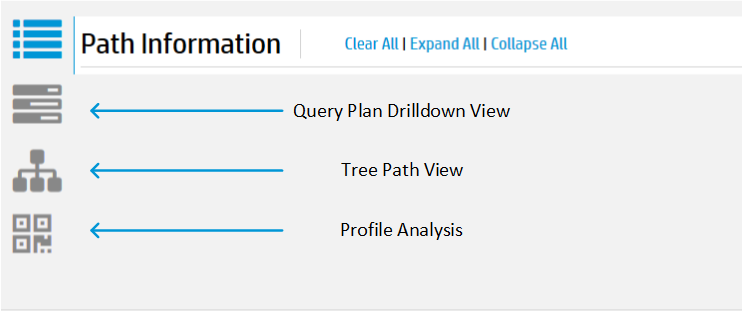
You can change the query plan view using the icons on the bottom portion of the Explain page.
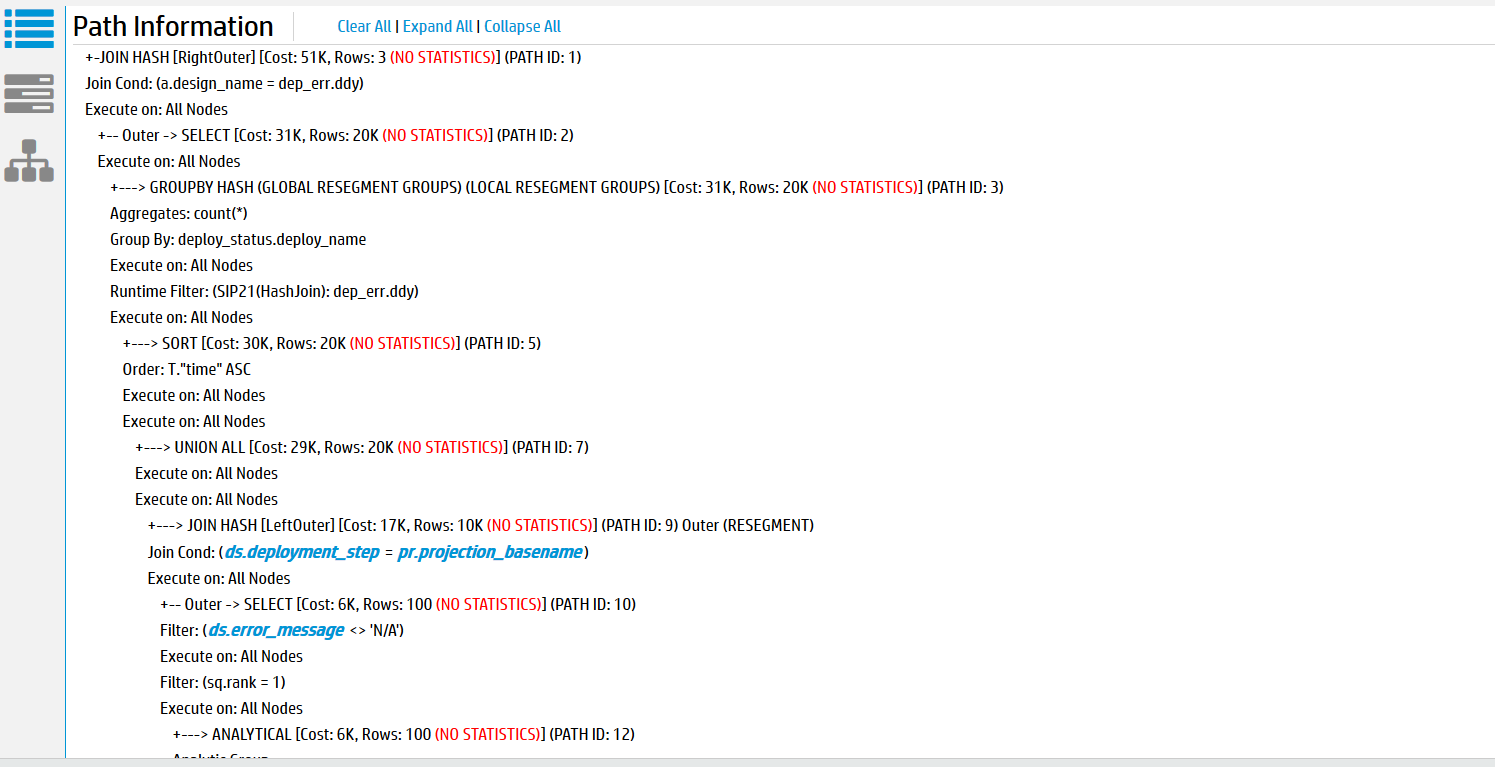
The Path Information view displays the query plan path. You can expand or collapse the view to see different levels of detail. To view metadata for a projection or a column, click the object name in the path output. A pop-up window displays the metadata, if it is available.
 The
The
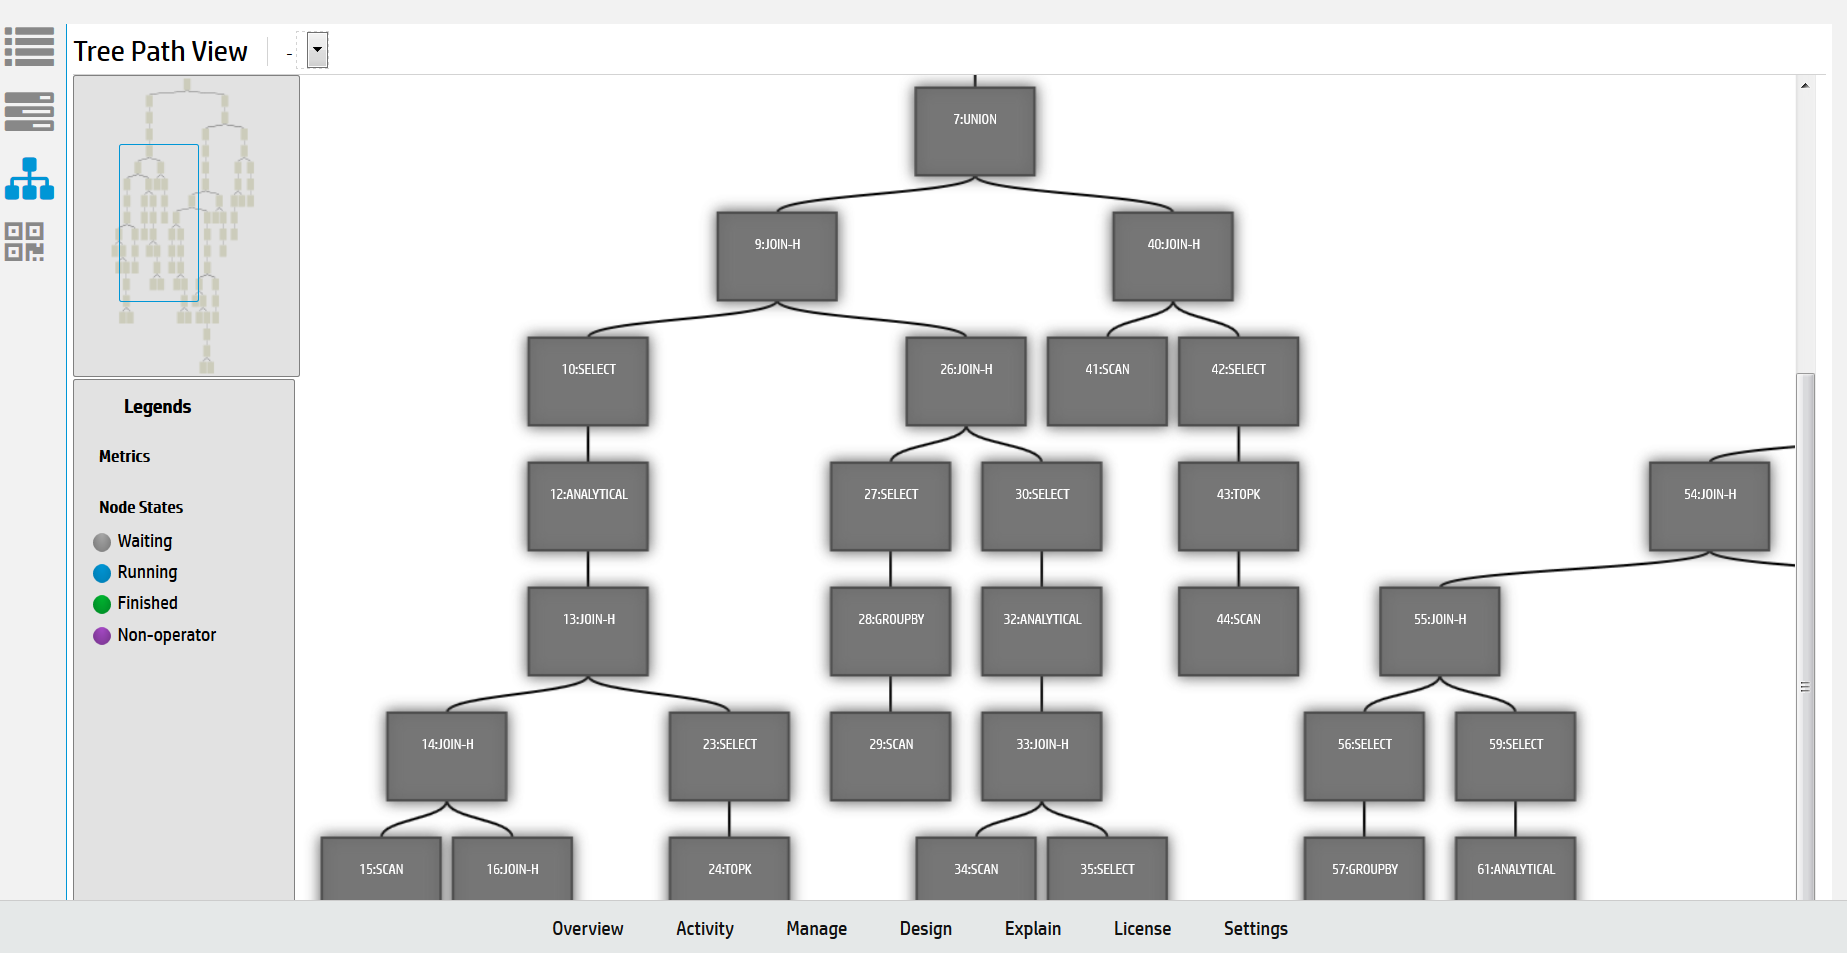
The Tree Path view details the query plan in the form of a tree. When you run EXPLAIN, the tree view does not contain any metrics because the query has not yet executed.
3 - Expanding and collapsing query paths
The EXPLAIN window initially displays the full query plan as generated by the EXPLAIN command.
The EXPLAIN window initially displays the full query plan as generated by the EXPLAIN command. Query plans can be lengthy, so you might want to modify the display so you can focus only on areas of interest:
-
Collapse All collapses all query paths, and displays only a summary of each path.
-
Expand All expands all query paths.
-
Click the first line of a path to display details for that path. To collapse that path, click its first line again.
For details about EXPLAIN command output, see EXPLAIN-Generated query plans.
4 - Clearing query data
After you finish reviewing the current query data, click Clear All to clear the query text and data.
After you finish reviewing the current query data, click Clear All to clear the query text and data. Alternatively, to display information about another query, enter the query text and click Explain or Profile.
5 - Viewing projection and column metadata
In the Management Console EXPLAIN window, when query paths are expanded in the Path Information view, Projection lines contain a projection name and Materialize lines contain one or more column names.
In the Management Console EXPLAIN window, when query paths are expanded in the Path Information view, Projection lines contain a projection name and Materialize lines contain one or more column names.
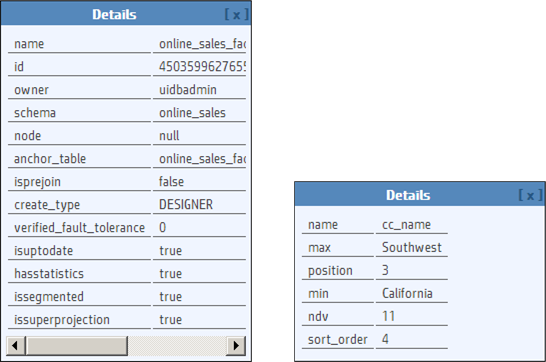
To view metadata for a projection or a column, click the object name. A pop-up window displays the metadata. The following image on the left shows example projection metadata and the image on the right shows example column metadata.
Note
Most system tables do not have metadata.
When you are done viewing the metadata, close the pop-up window.